
Photocatalyst Market Size and Share
Market Overview
| Study Period | 2020 - 2031 |
|---|---|
| Market Size (2026) | USD 3.22 Billion |
| Market Size (2031) | USD 4.87 Billion |
| Growth Rate (2026 - 2031) | 8.66 % |
| Fastest Growing Market | North America |
| Largest Market | Asia Pacific |
| Market Concentration | Medium |
Major Players *Disclaimer: Major Players sorted in no particular order Image © Mordor Intelligence. Reuse requires attribution under CC BY 4.0. | |
Photocatalyst Market Analysis by Mordor Intelligence
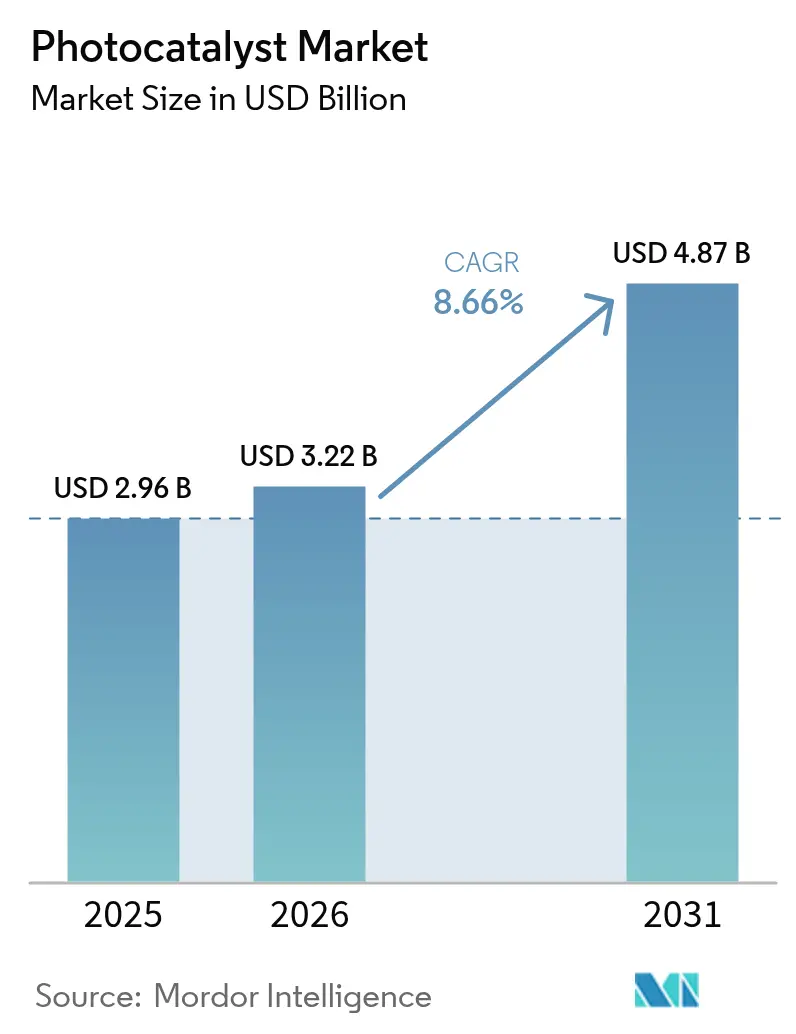
The Photocatalyst market size is expected to grow from USD 2.96 billion in 2025 to USD 3.22 billion in 2026 and is forecast to reach USD 4.87 billion by 2031 at 8.66% CAGR over 2026-2031. Strong regulatory pressure on air and water pollutants, wider acceptance of self-cleaning construction materials and breakthroughs that move titanium-dioxide (TiO₂) systems into the visible-light spectrum headline the growth narrative. Market demand is reinforced by construction firms seeking lifetime maintenance savings, utilities tackling emerging water contaminants and consumer-electronics producers adding antimicrobial coatings. Accelerated scale-up is also visible as modular reactors and 3-D printed composites cut capital costs, while regional supply chains adapt to European antidumping tariffs on Chinese TiO₂ imports. Finally, research momentum in plasmonic nanocomposites and MOF-derived catalysts signals a broadening application base that now reaches agrivoltaic glass and renewable-hydrogen production.
Key Report Takeaways
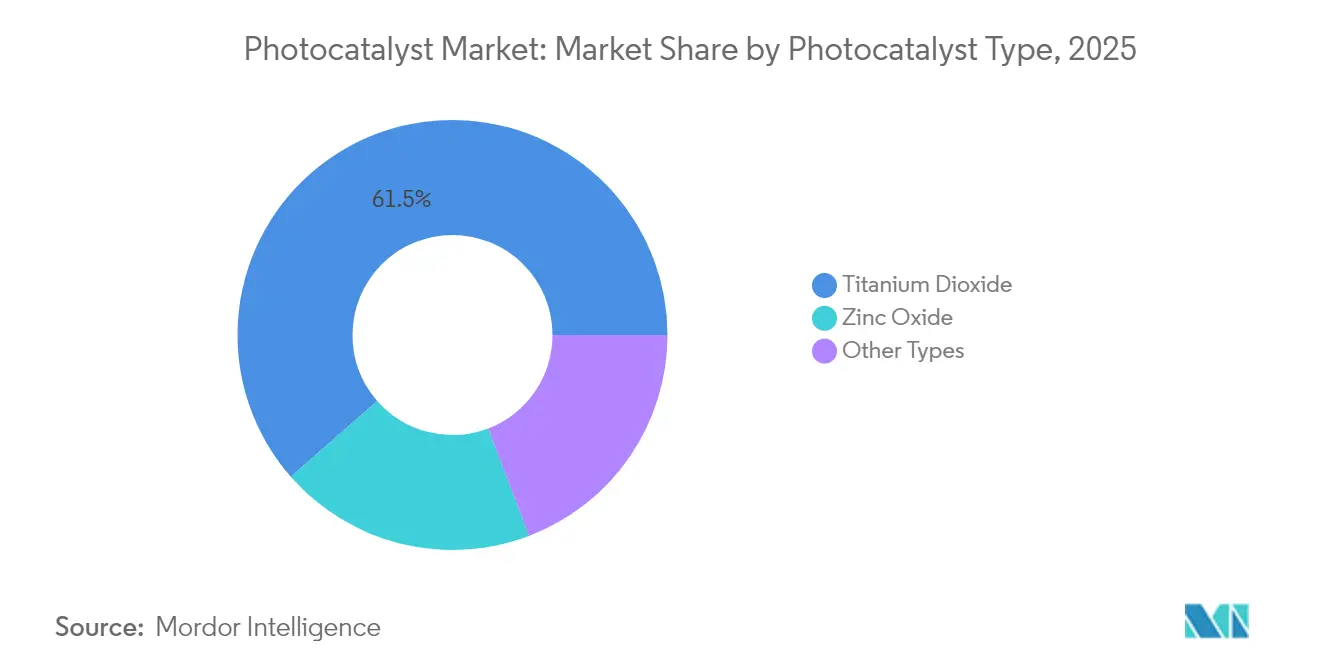
- By photocatalyst type, TiO₂ captured 61.45% of photocatalysts market share in 2025, whereas ZnO is projected to advance at a 9.55% CAGR through 2031.
- By application, self-cleaning held 59.92% of the photocatalysts market size in 2025 and is expanding at a 10.35% CAGR between 2026-2031.
- By end-use industry, construction and infrastructure accounted for 45.10% of revenue in 2025 and is growing at a 9.74% CAGR to 2031.
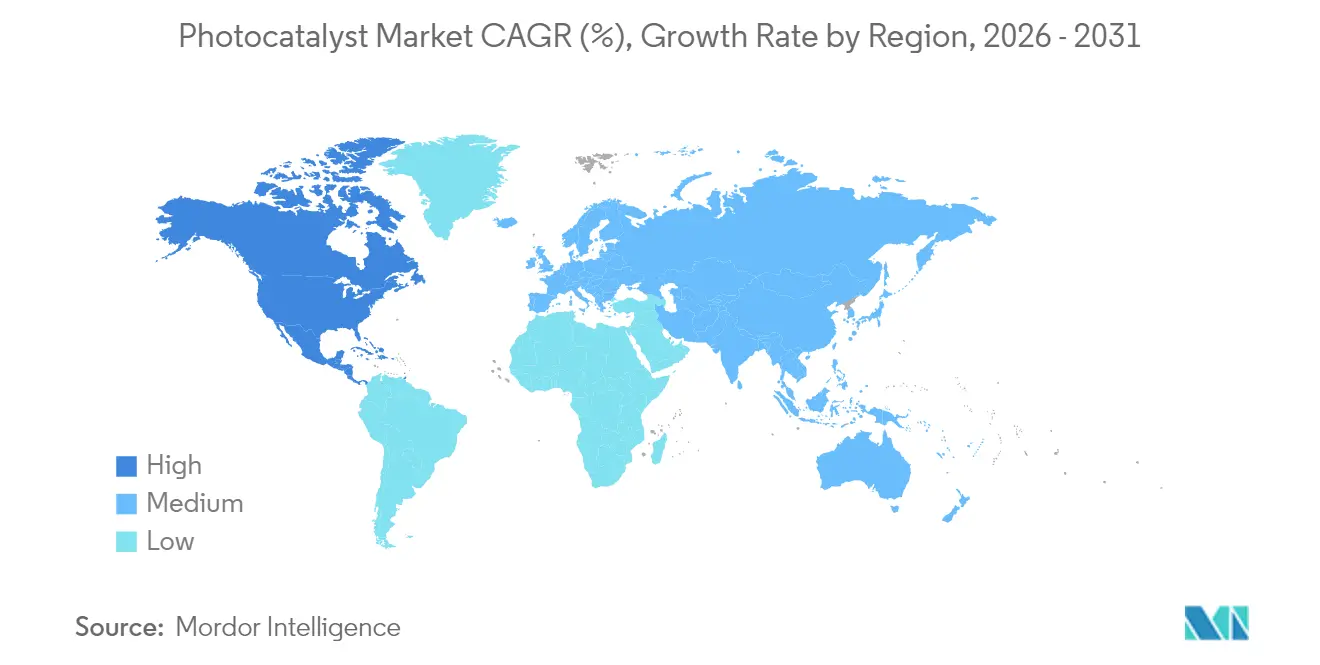
- By geography, Asia-Pacific led with 66.15% revenue share in 2025, while North America registers the fastest 9.62% CAGR over the forecast period.
Note: Market size and forecast figures in this report are generated using Mordor Intelligence’s proprietary estimation framework, updated with the latest available data and insights as of 2026.
Global Photocatalyst Market Trends and Insights
Drivers Impact Analysis*
| Driver | (~) % Impact on CAGR Forecast | Geographic Relevance | Impact Timeline |
|---|---|---|---|
| Surging demand for TiO₂ photocatalysts in self-cleaning construction materials | +2.1% | Global, focus in Asia-Pacific & Europe | Medium term (2-4 years) |
| Rising adoption in municipal water & wastewater treatment plants | +1.8% | North America & EU, spreading to Asia-Pacific | Long term (≥ 4 years) |
| Stricter indoor-air VOC regulations boosting photocatalytic air purifiers | +1.6% | North America & EU | Short term (≤ 2 years) |
| Visible-light plasmonic nanocomposites enabling indoor consumer-electronics coatings | +1.4% | Global, led by Japan & South Korea | Medium term (2-4 years) |
| Photocatalytic coatings for agrivoltaic glass reducing bio-fouling | +0.9% | Global, early uptake in Europe & Australia | Long term (≥ 4 years) |
| Source: Mordor Intelligence | |||
Surging Demand for TiO₂ Photocatalysts in Self-Cleaning Construction Materials
Building owners now specify nano-textured TiO₂ coatings that cut façade washing expenses by as much as 40% across a building’s life. Recent formulations achieve 95% optical transmittance, meeting the aesthetic needs of high-profile glass architecture. Photocatalytic surfaces also remove 63% of airborne toluene under daylight, easing urban air-quality concerns. High-rise projects adopt these coatings because rope-access cleaning is expensive and disruptive, while novel Bi@Bi₄Ti₃O₁₂/TiO₂ films extend the benefit to visible light, broadening design freedom for shaded elevations[1]Lv et al., “Bi@Bi₄Ti₃O₁₂/TiO₂ Photocatalyst Films Under Visible Light,” rsc.org.
Rising Adoption in Municipal Water & Wastewater Treatment Plants
Utilities turn to solar-driven photocatalytic tertiary treatment to tackle pesticides such as 2,4-D, MCPP and dicamba, achieving up to 99.8% degradation without external power[2]Heydari et al., “Passive Solar Photocatalytic Removal of Herbicides,” acs.org. Photocatalytic membrane reactors gain traction for their precise effluent quality control and resilience to contaminant peaks. Additive-manufactured composite structures push costs down by customizing surface area and light-distribution geometry, making remote installations viable where grid electricity is scarce.
Stricter Indoor-Air VOC Regulations Boosting Photocatalytic Air Purifiers
New EPA rules on benzene and hydrocarbon emissions spark demand for continuous, filter-free air cleaners in offices, schools and vehicles. Polypropylene membranes embedded with TiO₂ nanoparticles degrade VOCs efficiently under LED lighting, and automotive prototypes already lower evaporative-fuel vapor by 60% in diurnal cycles. Designs that mimic the troposphere’s OH-radical chemistry enable effective treatment even at the very low contaminant concentrations typical of conditioned interiors.
Visible-Light Plasmonic Nanocomposites Enabling Indoor Consumer-Electronics Coatings
Silver-enhanced Ag/AgCl-glass maintains high transparency yet delivers strong photocatalytic activity under everyday indoor lighting, lending self-cleaning and antibacterial properties to touchscreens. Subnanometric MoOₓ clusters on TiO₂ nanosheets further raise selectivity, avoiding unwanted by-products and reaching 95% reaction efficiency. Manufacturers appreciate the dual hygiene and aesthetic value, while 3-D flower-like Ag/Bi₅O₇I coatings show 99.63% bacterial kill alongside 95% pollutant removal in tablet-lens tests.
Restraints Impact Analysis*
| Restraint | (~) % Impact on CAGR Forecast | Geographic Relevance | Impact Timeline |
|---|---|---|---|
| High capital expenditure for industrial-scale photocatalytic reactors | -1.9% | Global, acute in emerging markets | Medium term (2-4 years) |
| Catalyst deactivation from surface fouling & electron-hole recombination | -1.5% | Global, worst in polluted settings | Long term (≥ 4 years) |
| Regulatory uncertainty on nanoparticle release & disposal | -0.8% | North America & EU | Short term (≤ 2 years) |
| Source: Mordor Intelligence | |||
High Capital Expenditure for Industrial-Scale Photocatalytic Reactors
Economic modeling shows treatment costs spike when reaction rate constants fall below 0.1 min⁻¹, pushing developers to cut catalyst price rather than over-engineer reactors. UV-lamp arrays, precision flow control and fouling mitigation further inflate capex, often pushing projects 3-5 times above initial budgets. Modular units and hybrid photo-bioreactors emerge as workable answers, spreading investment over time and keeping payback within acceptable 5-15 year windows where energy prices and water-quality mandates align.
Catalyst Deactivation from Surface Fouling & Electron-Hole Recombination
Field deployments reveal that multicomponent pollutant streams quickly passivate catalytic surfaces, while high recombination rates sap quantum efficiency. Regeneration by thermal or chemical means consumes both energy and labor, eroding the cost advantage of “sunlight-only” treatment. Research now tailors co-catalysts and surface modifiers to extend lifetime, but added material complexity raises procurement cost and validation cycles, particularly in automotive fuel-vapor control where light alkanes accelerate deactivation.
*Our forecasts treat driver/restraint impacts as directional, not additive. The impact forecasts reflect baseline growth, mix effects, and variable interactions.
Segment Analysis
By Photocatalyst Type: TiO₂ Dominance Faces ZnO Challenge
In 2025, TiO₂ held 61.45% of photocatalyst market share owing to mature production scale and decades of formulation know-how. Concurrent advances such as Ti³⁺ self-doping via triethanolamine routes widen its visible-light window, reinforcing performance leadership even as antidumping duties change supply logistics. ZnO meanwhile posts the fastest 9.55% CAGR because its surface reaction pathway favors hydrogen generation, an area receiving generous green-fuel funding across Asia-Pacific and North America.
Momentum is nonetheless shifting toward multi-component systems. Bismuth-oxides, graphene composites and MOF-derived structures demonstrate quantum yields above 10%, targeting CO₂ conversion and specialty chemical synthesis. Market selection is expected to tilt on application specificity more than on universal metrics, suggesting TiO₂ might relinquish some high-margin niches even while retaining overall volume leadership in the photocatalyst market.


By Application: Self-Cleaning Leads Diversification
Self-cleaning captured 59.92% of the photocatalyst market size in 2025 and continues to pace expansion at 10.35% CAGR, leveraging its ubiquity across construction façades, automotive clear-coats and phone glass. Architectural cladding gains particular traction from life-cycle maintenance savings and enhanced urban aesthetic. Air purification ranks second as offices retrofit HVAC units to comply with stricter VOC thresholds, while water treatment grows as a tertiary barrier against trace organics that evade biological steps.
Anti-fogging lenses and mirrors exploit the same hydrophilic surface property that underpins self-cleaning, giving OEMs an easy bolt-on feature set. Over the horizon, CO₂ reduction, methane oxidation and renewable hydrogen collectively seed an emerging application cluster where higher value per kilogram of catalyst could offset lower volumes, further diversifying revenue streams for the photocatalyst market.
By End-Use Industry: Construction Drives Adoption
Construction and infrastructure commanded 45.10% demand in 2025, supported by building codes that incentivise sustainable materials and façade longevity. Developers tout 40% cleaning cost cuts in tender documents, and city planners welcome the 63% toluene removal capability that improves street-level air quality. Automotive and transportation follow as OEMs explore self-healing clear-coats and vapor-reducing canisters, yet deactivation under hydrocarbon load remains a hurdle.
Consumer electronics, although a smaller base, show outsized potential as visible-light plasmonic films enable in-situ antimicrobial and smudge-free screens. Energy and utilities weave photocatalysts into solar panel glass and pilot hydrogen generators, broadening the industrial canvas. Healthcare facilities and agritech greenhouses round out adoption as specialty users that prize continuous sterilisation and light-management efficiency.

Geography Analysis
Asia-Pacific maintained 66.15% share in 2025 as Japan’s research leadership and China’s low-cost TiO₂ output anchor a vertically integrated cluster from laboratory to factory floor. Post-Fukushima R&D grants propel visible-light innovation, and China’s scale—2.65 million tons TiO₂ via the sulphate route in 2017—supports price competitiveness even amid tightening environmental rules. Rapid urbanisation and seasonal smog further drive municipal demand for photocatalytic air-scrubbed façades and subway stations.
North America expands fastest at a 9.62% CAGR thanks to EPA VOC limits that accelerate HVAC retrofits and automotive fuel-vapor controls. Municipal utilities implement passive solar tertiary treatment to meet trace-contaminant discharge permits, while federal clean-hydrogen credits stimulate ZnO-based water-splitting demonstrations. Canadian green building codes and Mexico’s expanding industrial base add regional volume beyond the United States.
Europe benefits from the Green Deal’s circular-economy clauses, channelling subsidies into sustainable construction and agrivoltaic pilots that pair photocatalytic glazing with transparent PV. Antidumping tariffs on Chinese TiO₂ galvanise local pigment makers to diversify into higher-margin catalyst grades, thereby shortening supply chains. South America and Middle East & Africa represent early-stage arenas where point-of-use water treatment and solar-panel coatings can leapfrog conventional solutions, especially in remote agriculture and mining camps.

Regulatory Landscape
Regulation affecting photocatalysts is shaped by chemical registration and nano-safety requirements, alongside performance test standardization, rather than a single unified photocatalyst law. In the European Union, titanium dioxide (CAS 13463-67-7) is governed through European Chemicals Agency (ECHA) substance and registration requirements, and its classification for certain powder fractions increases scrutiny on labeling, worker exposure controls, and downstream handling across TiO2-based photocatalyst supply chains.
At the same time, standards work is tightening comparability of claims in key demand centers such as indoor air purification and building materials. ISO published updated methods in 2025 (ISO 17168-2:2025 and ISO 17168-5:2025) for evaluating air-purification performance of semiconducting photocatalytic materials under indoor-lighting conditions, while ISO 18473-4:2022 specifies requirements and test methods for nanoscale TiO2 used for photocatalysis. China also uses national standardization for TiO2-based photocatalyst preparations (GB/T 39952-2021 for titanium dioxide-based photocatalytic dispersion), which informs qualification practices for coatings and formulated products in Asia-Pacific.
Value Chain Analysis
Upstream inputs start with titanium feedstocks (commonly ilmenite) processed into TiO2 via sulfate or chloride routes, and chloride-process production is viewed as newer, more scalable, and lower in byproduct generation in many industrial chains. For advanced photocatalyst grades, the supply base extends beyond TiO2 into dopants and co-catalysts (for example, bismuth- and vanadium-linked chemistries for visible-light activity) and specialty chemicals used for surface engineering. These ingredients can raise procurement volatility and qualification burden compared with pigment-grade materials.
Midstream manufacturing focuses on particle-size control (often sub-30 nm), phase control, and surface modification, followed by conversion into dispersions, coatings, membranes, and composite structures, including additively manufactured or structured supports for reactor internals. Downstream channels split across construction-material formulators and glass/coating OEMs, air-purifier and HVAC integrators, and water-treatment system providers that package catalyst materials with light sources and reactors. Claims validation increasingly relies on ISO test methods for indoor air applications. Logistics and trade measures affecting TiO2 flows also influence photocatalyst availability and lead times, as producers and formulators adjust sourcing and inventory around regional supply-chain constraints.
Competitive Landscape
Competitive Landscape
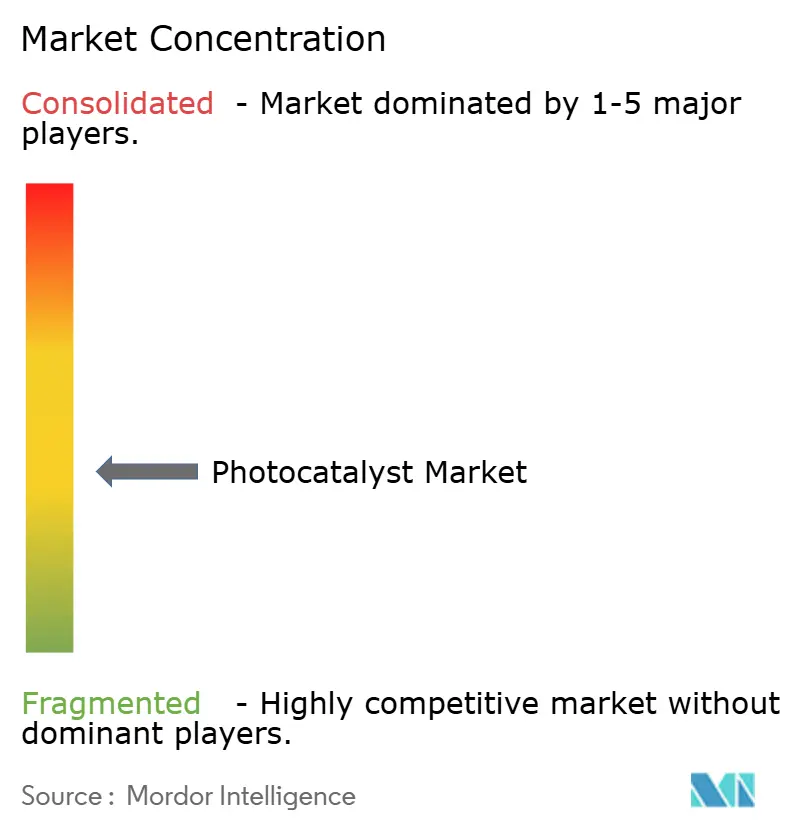
The sector is moderately fragmented: global pigment leaders such as BASF, Kronos Worldwide and Chemours leverage scale, logistics and customer service to defend TiO₂ franchises, while mid-cap specialists pursue visible-light or MOF-driven breakthroughs. Tronox’s recent Netherlands plant idling underscores price pressure from Chinese exports, yet Chemours offset margin squeeze through premium pigment and catalyst grades tied to construction megaprojects.
Strategic moves highlight the industry’s pivot toward sustainability. Resonac’s tie-up with Neste and Marubeni channels bio-based feedstocks into photocatalyst precursors, and BASF’s 2024 catalyst research centre focuses on decarbonising chemical processes via advanced photocatalysis. Start-ups harness 3-D printing to craft bespoke reactor internals, and AI-guided material discovery platforms cut lab cycles, accelerating time-to-pilot for combinatorial nanocomposites that outperform legacy TiO₂. White-space opportunity clusters include indoor electronics coatings, agrivoltaic glass and decentralized hydrogen generators, setting the stage for cross-industry alliances that blend materials, device and service expertise within the photocatalysts market.
Photocatalyst Industry Leaders
KRONOS Worldwide Inc
Tronox Holdings Plc
The Chemours Company
LB Group
ISHIHARA SANGYO KAISHA, LTD.
- *Disclaimer: Major Players sorted in no particular order

Market Opportunities and Future Outlook
A primary opportunity area is shifting from commodity pigment supply toward higher-value photocatalyst and functional TiO2 grades used in self-cleaning construction materials, air purification media, and water-treatment systems. Buyers pay for controlled morphology and validated performance in these segments. Visible-light-active formulations expand addressable indoor and shaded-surface use cases, aligning with ISO 17168-2:2025 and ISO 17168-5:2025 test methods that help commercial users specify indoor-light air-purification performance in a comparable way.
Supply-chain expansion in chloride-process TiO2 also creates room for tailored grades and tighter downstream integration into photocatalyst dispersions and coated products. In China, multiple capacity moves were announced or reached trial operation in 2026, including Lubei Chemical reporting full-load trial operation of a 60,000-ton/year chloride-process TiO2 expansion (doubling its total capacity to 120,000 tons/year) and Yibin Tianyuan Haifeng Hetai Co., Ltd. announcing construction of a 100,000-ton/year chloride-process facility in Sichuan (taking total TiO2 capacity to 200,000 tons/year). On the application side, scaling progress is visible in reactor and testing infrastructure, including published standardized high-throughput screening approaches for photocatalytic membrane supports and growing use of techno-economic assessment frameworks for industrial-scale LED-driven wastewater reactors that place buyer attention on electricity tariffs and catalyst replacement intervals as adoption levers.
Recent Industry Developments
- June 2026: Tronox published its 2025 sustainability report, describing progress that included a 27% reduction in Scope 1 and 2 greenhouse gas emissions intensity versus 2019 levels, supported by automated process controls at chlorine pigment plants. The disclosure reinforces how TiO2 producers are linking operating upgrades and site efficiency programs to customer and regulatory decarbonization requirements, which also influence functional and catalyst-grade supply chains.
- January 2026: Tronox announced its intent to permanently close its 46,000 metric ton per year TiO2 pigment plant in Fuzhou, China, citing weak domestic demand and high raw material costs. The footprint change can tighten regional supply options and supports portfolio optimization toward more competitive assets and higher-margin grades used by downstream formulators.
- December 2024: Chemours announced plans by PCC Group to build a 340,000 metric ton per year chlor-alkali facility at Chemours TiO2 plant in DeLisle, Mississippi, with construction expected to begin in early 2026. On-site chlor-alkali integration supports feedstock and utility resilience at a major TiO2 site, which can improve cost stability for downstream titanium-based functional materials.


Research Methodology Framework and Report Scope
Market Definition and Coverage
For this study, the photocatalyst market covers the value of photocatalyst materials sold for use in products and processes where light triggers a catalytic reaction, mainly for cleaning and purification outcomes.
Scope exclusions: It excludes downstream finished equipment and services where photocatalyst is only a small embedded component and not priced as a material input.
Segmentation Overview
- By Photocatalyst Type
- Titanium Dioxide
- Zinc Oxide
- Other Types
- By Application
- Self-Cleaning
- Air Purification
- Water Treatment
- Anti-Fogging
- Other Applications
- By End-Use Industry
- Construction and Infrastructure
- Automotive and Transportation
- Consumer Electronics and Appliances
- Energy and Utilities (Solar, Hydrogen)
- Other End-user Industries (Healthcare and Hygiene, Agriculture and Aquaculture)
- By Geography
- North America
- United States
- Canada
- Mexico
- South America
- Brazil
- Argentina
- Rest of South America
- Europe
- Germany
- United Kingdom
- France
- Italy
- Rest of Europe
- Asia-Pacific
- China
- India
- Japan
- South Korea
- Rest of Asia-Pacific
- Middle East and Africa
- Saudi Arabia
- South Africa
- Rest of Middle East and Africa
- North America
Data Sources, Market Sizing, and Validation
Desk Research
Desk research built the first layer of our understanding on where photocatalysts are being used and how demand is shaped by water and air quality needs. We relied on public sources such as environmental regulators and statistical bodies (for example, the US EPA and Eurostat), trade and standards references (such as ISO publications), and scientific literature indexed in open journal platforms to validate common chemistries and performance claims.
We also reviewed company annual reports, investor presentations, and press releases to understand capacity additions, product focus, and application pull from coatings and construction. To strengthen the commercial view, we used paid databases for company financials and intelligence, patent databases to check R and D intensity, and an import and export shipment level database where trade flows were useful for cross-checking supply availability. These desk sources are illustrative, and other public references were also used for data collection, validation, and clarification.
Primary Interviews and Surveys
Primary work focused on confirming what actually gets counted as photocatalyst demand in each application, and how pricing changes when volumes scale up. We spoke with a mix of material suppliers, formulators, and downstream users in coatings, building materials, and environmental solutions across the Americas, EMEA, and APAC, which helped close data gaps and align assumptions before finalizing the model.
Distribution of primary research fieldwork respondents
| Company type | Respondent position | Region |
|---|---|---|
| Top tier: 39% | CXOs: 14% | APAC: 49% |
| Mid tier: 44% | Functional/Unit leaders: 33% | EMEA: 29% |
| Smaller Players: 17% | Managers: 53% | Americas: 22% |
Market-Sizing & Forecasting
Sizing starts from a top-down build where production indicators and end-use demand signals are used to reconstruct the addressable pool for photocatalyst materials, and then it is split by major applications such as self-cleaning, air purification, water treatment, and anti-fogging. Once the demand pool is formed, the value is derived using application-level usage intensity and typical selling price ranges.
To keep the totals realistic, we check the outputs with selective bottom-up approximations, such as sampled supplier revenue logic, channel conversations on volumes, and a simple ASP times volume sanity check for the larger chemistries. Inputs that matter in this market include TiO2 and ZnO mix shifts, adoption rates in architectural coatings and building materials, water and air treatment project activity, and observed price progression by grade (industrial versus higher performance grades). When details are missing for smaller applications, we apply conservative penetration assumptions and then test the impact in the validation step.
For forecasting, scenario analysis is used because adoption can move faster or slower depending on regulation, construction cycles, and the pace of retrofits for air and water purification. The scenario ranges are narrowed using expert views gathered during interviews, and the mid-case is used for the headline forecast.
Data Validation & Update Cycle
Validation is done through multiple checks so the final number stays consistent with real market signals. Our team compares model outputs against independent indicators like regional demand direction, trade flow movement where applicable, and whether implied pricing remains within observed ranges, and then unusual swings are reviewed before sign-off.
A second analyst review is completed for assumption consistency, math accuracy, and year-to-year logic, followed by re-contacts if a variance cannot be explained through public evidence. The report is refreshed annually, and interim updates are triggered when there are material events such as sharp raw material changes, major capacity moves, or policy shifts. Before delivery, we run a final pass so clients receive the most current view available at the time.
Mordor Intelligence's Photocatalyst Market Size Compared With Other Published Estimates
Published market sizes for photocatalysts can differ even when they discuss similar applications, because the scope lines and the timing of price inputs are not always aligned. Differences also come from whether estimates lean on reported sales, modeled consumption, or broader adjacent categories that can be easy to accidentally include.
The main gap comes from whether photocatalyst is counted only as a material sold into defined uses like self-cleaning and purification, or if adjacent finished products are also blended in. In our approach, Mordor Intelligence handles the market as a material-only value so the total stays tied to measurable volume and ASP assumptions. Currency timing and the treatment of base year (base versus estimated year) can also widen the spread, especially when TiO2-linked pricing moves quickly and when regional adoption is assumed to accelerate at different speeds.
Benchmark comparison
| Source | Market Size | Gaps in Research Methodology |
|---|---|---|
| Mordor Intelligence | USD 3.22 B (2026) | |
| Global Consultancy A | USD 2.66 B (2026) | Uses a different base setup (base year 2025 with 2026 as an estimated year) and can apply alternate ASP progression, which can pull down the implied 2026 value even with similar end uses. |
| Industry Publisher B | USD 2.90 B (2025) | Reports a 2025 starting value with its own application and form scope, so the figure is not directly comparable to a 2026 base year without adjusting for year shift, currency timing, and assumed adoption slope. |
The table shows that year choice and what gets counted as material demand versus adjacent product value are the two biggest reasons for the spread. When the scope is kept tight and the price and volume drivers are written down clearly, the market size becomes easier to reproduce and to stress-test for planning.


Key Questions Answered in the Report
What is the current size of the photocatalyst market?
The photocatalyst market size is valued at USD 3.22 billion in 2026, with expectations to reach USD 4.87 billion by 2031 on a 8.66% CAGR trajectory.
Which segment holds the largest photocatalysts market share?
TiO₂ remains dominant with 61.45% share in 2025, largely due to entrenched manufacturing scale and broad application acceptance.
Why are self-cleaning applications growing so quickly?
Self-cleaning coatings lower façade maintenance costs by up to 40% and simultaneously remove urban air pollutants, driving 10.35% CAGR growth through 2031.
Which region is expanding fastest in photocatalysts demand?
North America leads growth at a 9.62% CAGR because of stringent VOC regulations and rapid uptake of photocatalytic air purification systems.
What is the main hurdle to wider industrial adoption?
High capital expenditure for large-scale reactors and catalyst-deactivation challenges together shave about 3.4 percentage points off potential CAGR, underscoring the need for cost-effective, long-life designs.
Page last updated on:


 Your data is secure and never sold or shared.


