
Phoropters Market Size and Share
Market Overview
| Study Period | 2020 - 2031 |
|---|---|
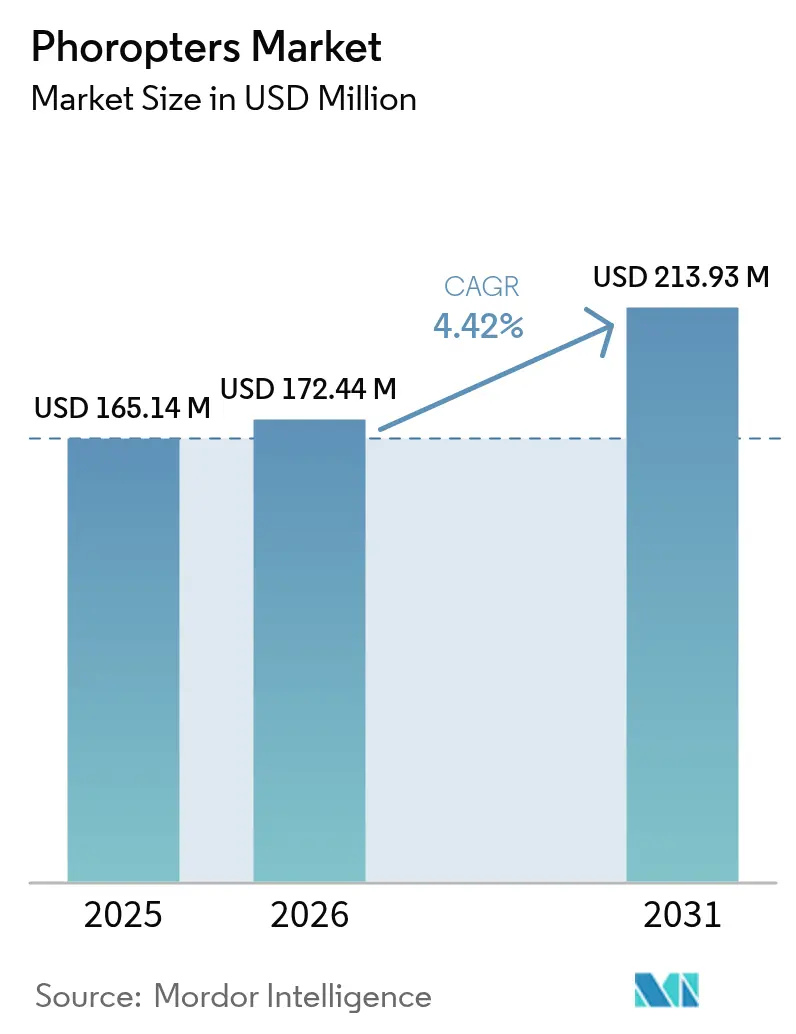
| Market Size (2026) | USD 172.44 Million |
| Market Size (2031) | USD 213.93 Million |
| Growth Rate (2026 - 2031) | 4.42 % |
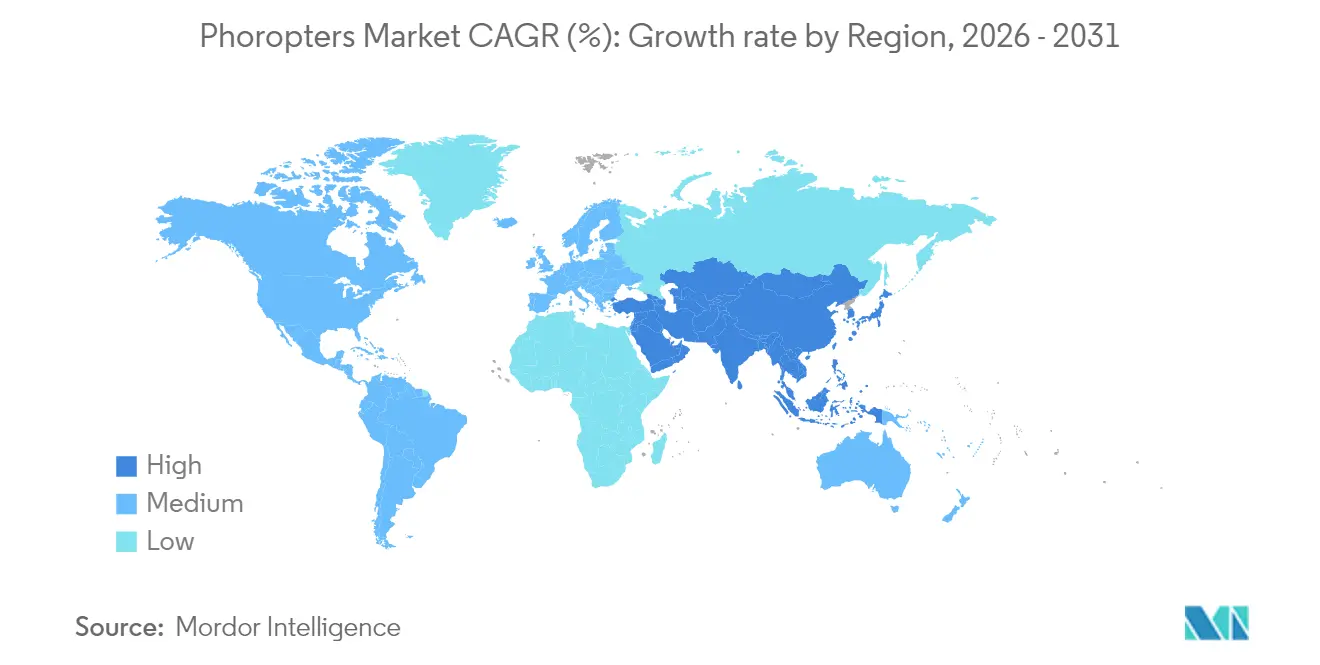
| Fastest Growing Market | Asia Pacific |
| Largest Market | North America |
| Market Concentration | Medium |
Major Players *Disclaimer: Major Players sorted in no particular order Image © Mordor Intelligence. Reuse requires attribution under CC BY 4.0. | |
Phoropters Market Analysis by Mordor Intelligence
The phoropter market size is expected to grow from USD 165.14 million in 2025 to USD 172.44 million in 2026 and is forecast to reach USD 213.93 million by 2031 at 4.42% CAGR over 2026-2031. Demand stems from rising refractive-error prevalence, rapid aging, and the switch from manual refraction to connected diagnostic workflows. Automated models lower examination time, integrate with electronic health records, and support technician-led service models, while traditional manual units still dominate in many independent clinics. Optical retail chains standardize high-volume testing, hospitals upgrade to digital platforms that interface with surgical planning software, and online procurement channels gain ground as specification transparency improves. Vendors now bundle software, analytics, and remote-support contracts, repositioning the phoropter market from a hardware purchase to a workflow solution.
Key Report Takeaways
- By product type, manual systems led with 53.78% of phoropter market share in 2025, while digital and automated units are expanding at a 5.21% CAGR through 2031.
- By end user, hospitals and eye clinics held 46.02% revenue share in 2025; optical retail chains show the fastest trajectory at 5.68% CAGR to 2031.
- By distribution channel, direct sales accounted for 49.65% of the phoropter market size in 2025, whereas online commerce is advancing at a 6.19% CAGR.
- By geography, North America contributed 38.21% revenue in 2025, but Asia-Pacific is scaling at a 6.84% CAGR through 2031.
Note: Market size and forecast figures in this report are generated using Mordor Intelligence’s proprietary estimation framework, updated with the latest available data and insights as of 2026.
Market Trends and Insights
Drivers Impact Analysis of Phoropters Market*
| Driver | (~) % Impact on CAGR Forecast | Geographic Relevance | Impact Timeline |
|---|---|---|---|
| Rising prevalence of refractive errors | +1.2% | Global, with concentration in Asia-Pacific | Long term (≥ 4 years) |
| Shift toward digital & automated refraction systems | +0.9% | North America & Europe, expanding to APAC | Medium term (2-4 years) |
| Aging population demanding frequent eye exams | +0.8% | Global, particularly developed markets | Long term (≥ 4 years) |
| EMR-integrated digital phoropters boost throughput | +0.6% | North America & Europe | Short term (≤ 2 years) |
| Tele-optometry & retail chain upgrades | +0.4% | Global, with early adoption in urban centers | Medium term (2-4 years) |
| Source: Mordor Intelligence | |||
Rising prevalence of refractive errors
Myopia now affects 80-90% of high-school graduates in several East-Asian economies, with 10-20% at risk of pathologic complications that need frequent monitoring [1]Source: Emma Liu, “Asian High-School Myopia Now Tops 90%,” BioSpectrum Asia, biospectrumasia.com . COVID-19 lockdowns magnified this burden; Hong Kong documented a 2.5-fold jump in new childhood myopia cases, cementing long-term demand for school-based screening. Outside East Asia, Iranian adults aged 60 and above show 31.65% myopia and 45.36% hyperopia, underscoring that uncorrected refractive error spans age groups[2]Source: Roya Ziaei, “Refractive Error Prevalence in Iranian Seniors,” BMC Ophthalmology, bmcophthalmol.biomedcentral.com . Such demographic and lifestyle shifts keep phoropters central to primary eye care, elevating them from elective tools to public-health necessities.
Shift toward digital & automated refraction systems
Automated binocular units completed tests in 171 seconds versus 190 seconds for legacy digital devices while maintaining accuracy parity. University of Arizona researchers produced a 20-second auto-phoropter that removes subjective answers, which addresses language barriers and standardizes results. Such speed improvements support high-throughput retail chains and rural tele-optometry hubs. When paired with software that auto-uploads refraction data to patient records, the phoropter market aligns with hospital digitization agendas and national e-health mandates.
Aging population demanding frequent eye exams
Presbyopia affects nearly every individual over 50 years, while corneal astigmatism above 1.00 D is present in 44.2% of cataract candidates. Frequent objective testing is vital for surgical planning and systemic disease detection because ophthalmic findings correlate with frailty biomarkers. This predictable, recurring requirement insulates the phoropter market from cyclical economic swings and favors premium models that interface with diagnostic imaging suites.
EMR-integrated digital phoropters boost throughput
Ophthalmology-specific electronic records demand seamless data import in formats absent from generic health IT. The U.S. Technology-based Eye Care Services program served over 70,000 veterans through remote consultations enabled by standardized capture protocols. Carl Zeiss Meditec’s VisioGen suite merges communication tools with auto-refraction upload to trim chair time. Clinics quantify return on investment through reduced transcription errors and faster patient flow, accelerating replacement cycles.
Restraints Impact Analysis of Phoropters Market*
| Restraint | (~) % Impact on CAGR Forecast | Geographic Relevance | Impact Timeline |
|---|---|---|---|
| High upfront cost of digital phoropters | -0.8% | Global, particularly emerging markets | Short term (≤ 2 years) |
| Limited reimbursement for advanced eye-exam devices | -0.6% | North America & Europe | Medium term (2-4 years) |
| Shortage of skilled refraction personnel | -0.5% | Global, acute in rural areas | Long term (≥ 4 years) |
| Booming second-hand equipment market | -0.3% | Developing countries, expanding globally | Medium term (2-4 years) |
| Source: Mordor Intelligence | |||
High upfront cost of digital phoropters
Premium automated units stretch capital budgets, especially for independent optometrists in regions lacking equipment financing. Refurbished devices resolve 43.5% of medical-equipment shortages in developing economies, underscoring cost sensitivity. Until manufacturing scale and local assembly compress prices, adoption splits: high-volume chains upgrade rapidly while smaller clinics hold to manual devices.
Limited reimbursement for advanced eye-exam devices
Payer policies such as Horizon Blue Cross Blue Shield reimburse CPT Code 92015 only for disease-related refractions, not routine screenings. Providers therefore fund equipment amortization through out-of-pocket fees, suppressing upgrade appetite. Evidence demonstrating preventive savings may spur policy change, yet near-term adoption remains uneven across health systems.
*Our forecasts treat driver/restraint impacts as directional, not additive. The impact forecasts reflect baseline growth, mix effects, and variable interactions.
Phoropters Market Segment Analysis
By Product Type – Manual Persistence, Digital Momentum
The phoropter market size for manual units stood at USD 88.81 million in 2025 and still accounted for 53.78 % of revenue. Long product lives and lower prices appeal to small clinics, but digital and automated alternatives rise at 5.21 % CAGR through 2031. Automated systems shave consultation time while exporting refraction data directly to cloud records. Their technician-friendly workflow helps mitigate the forecast 30 % shortfall in ophthalmologists by 2035. As regulatory guidance on objective testing solidifies, clinics will gradually trade artistry for repeatable analytics, positioning digital lines to erode manual dominance beyond 2030.
Manual devices will remain viable in refurbish-oriented markets where funding constraints prevail. Emerging subscription models that bundle software, maintenance, and periodic upgrades could accelerate retirement of purely mechanical systems. Manufacturers that retrofit existing frames with sensor modules might capture value from practices unwilling to purchase full replacements.


By End User – Retail Chains Lift Volume
Hospitals and specialty eye clinics drove 46.02 % of 2025 revenue owing to comprehensive care pathways. Their procurement cycles hinge on surgical throughput and accreditation audits that favor integrated platforms. In contrast, optical retail networks expand at 5.68 % CAGR because consumer walk-ins favor one-stop service with transparent pricing. Digital phoropters enable standardized protocols, shorter queues, and store-to-store consistency critical for franchisors.
Independent optometrists confront rising lease expenses and reimbursement ceilings that compress margins. Many respond by diversifying into dry-eye therapy or low-vision aids rather than upgrading refraction hardware. Academic research centers, though small in revenue terms, pioneer validation studies that speed regulatory approvals, thereby influencing market messaging and design priorities.
By Distribution Channel – Digital Commerce Gains Traction
Direct manufacturer deals maintained 49.65 % of 2025 revenue because customers depend on installation, calibration, and training. However, online procurement platforms post 6.19 % CAGR by lowering search costs and publishing transparent specification comparators. Standardized automated phoropters travel well and need minimal onsite setup, suiting courier delivery.
Dealer networks remain essential in emerging economies where import permits, after-sales servicing, and language support shape purchase decisions. Hybrid sales strategies—online lead generation with local service partners—have emerged to blend margin efficiency with hands-on support. As more providers pivot to multi-clinic ownership, centralized digital procurement offices will further legitimize e-commerce channels.

Geography Analysis
North America Phoropters Market
North America generated 38.21 % of global revenue in 2025, underpinned by high private-insurance penetration and robust capital spending. United States clinics upgrade frequently to comply with data-security rules and to gain reimbursement advantages for documented outcomes. FDA Class I and Class II device pathways define clear testing benchmarks, which accelerates commercialization timelines. Workforce shortages, with 60 % of optometric practices citing vacant positions, intensify the pivot to technician-run sessions that rely on automated phoropters. The proposed tariff hikes on ophthalmic imports could favor domestic assemblers but may inflate upgrade costs for smaller practices.
Europe Phoropters Market
Europe presents a mature yet cost-constrained profile. Universal coverage encourages regular eye screenings, supporting steady phoropter replacement cycles. However, single-payer reimbursement rates pressure clinics to justify premium equipment through demonstrated workflow savings. Stringent CE-marking rules advantage incumbent manufacturers with established quality management systems. Cross-border telemedicine pilots in Scandinavia reveal that integrated digital phoropters can serve remote islands effectively, potentially inspiring broader adoption.
APAC Phoropters Market
Asia-Pacific is the fastest-growing territory at 6.84 % CAGR. Public-health campaigns confront a myopia epidemic where up to 90 % of East-Asian teenagers need corrective lenses. Governments in China, Singapore, and South Korea subsidize school screening programs, spurring bulk procurement of portable automated units. Countries upgrading universal coverage, such as Thailand’s outpatient scheme expansion, fund provincial clinics that require low-maintenance phoropters. Domestic optical-component suppliers shorten lead times and compress costs, enabling local assembly that competes with imported brands.
South America and MEA Phoropters Market
South America shows fragmented uptake. Urban centers in Brazil and Colombia integrate digital phoropters into chain stores, yet rural areas still rely on manual devices due to constrained budgets and intermittent power. Non-profit vision missions bolster demand for portable units that can survive field conditions, indirectly fostering brand recognition among local practitioners. Middle East and Africa record sporadic hospital buys tied to donor-funded infrastructure projects; refurbished manual equipment dominates private-clinic inventories. Government import-duty relief on essential medical devices, recently enacted in Kenya, may lift shipments of entry-level automated models.

Regulatory Landscape
Phoropters are regulated as medical devices, with requirements varying by jurisdiction and by the level of software enablement and connectivity. In the United States, manual phoropters are classified under FDA product code HKN (21 CFR 886.1770) as Class I devices, which are generally exempt from 510(k) premarket notification, while manufacturers still must meet applicable controls such as labeling and recordkeeping. A key compliance milestone for manufacturers selling into the United States is the FDA Quality Management System Regulation (QMSR), which became effective in February 2026 and updates quality-system expectations to align more closely with ISO 13485.
In the European Union, phoropters fall under the Medical Device Regulation (MDR) 2017/745 and are classified using MDR risk-based rules (Annex VIII) rather than the FDA product-code system. Manufacturers must also manage MDR obligations such as technical documentation and UDI-related activities as applicable. Across regions, conformance to international standards used for ophthalmic instruments, such as ISO 15004-1:2020 (fundamental requirements and test methods for non-invasive ophthalmic instruments), supports market access and streamlines multi-market submissions for global vendors.
Competitive Landscape
The phoropter market houses a mix of established optical giants and specialist disruptors. Carl Zeiss Meditec, Topcon, and NIDEK reinforce positions through vertical integration. Zeiss consolidated seven optical divisions into a dedicated photonics unit and acquired Dutch Ophthalmic Research Center, enabling synergies from diagnostics to surgery. EssilorLuxottica secured an 80 % stake in Heidelberg Engineering, extending reach from lenses to OCT diagnostics. Such moves bundle refraction with imaging and therapeutic workflows, raising switching barriers.
Innovations differentiate: Zeiss unveiled VisioGen, an AI-driven clinic-operations aid; Reichert pushes Bluetooth-enabled devices that slot into cloud platforms; Visionix markets multifocal end-to-end exam lanes adaptable to space-constrained retail outlets.
Disruptors reshape competitive dynamics. iCRx claims a 60-second objective eye exam, challenging the traditional 15-minute subjective model. University of Arizona’s 20-second portable prototype targets humanitarian deployments and primary-care offices. These entrants weaponize speed, ease of use, and lower unit costs. Incumbents respond by embedding analytics, remote calibration, and subscription firmware. Strategic alliances with EMR vendors and tele-health platforms become decisive because buyers increasingly rate interoperability equal to optical quality.
Phoropters Industry Leaders
Marco
Rexxam Co., Ltd.
Reichert, Inc.
Carl Zeiss AG
Topcon Corporation
- *Disclaimer: Major Players sorted in no particular order

Phoropters Market Companies Covered in this Report
- Topcon
- Carl Zeiss
- Nidek
- EssilorLuxottica
- Reichert Technologies
- Huvitz Co., Ltd.
- Luneau Technology (Visionix)
- Marco Ophthalmic
- Takagi Seiko
- Canon
- Coburn Technologies
- Tomey
- Kowa
- Righton
- CSO Costruzione Strumenti Oftalmici
- Optomed
- Heidelberg Engineering
- Medizs Co.
- Visionix USA
- Bon Optic

Market Opportunities and Future Outlook
Workflow digitization and remote-care delivery are creating whitespace beyond conventional in-room subjective refraction lanes, especially where staffing constraints and multi-site operations push clinics toward standardized protocols. In May 2026, Ametek Reichert integrated its SightChek Digital Phoroptor into the DigitalOptometrics tele-optometry platform, illustrating a concrete pathway for vendors to position phoropters within a connected service stack that supports technician-led exams and off-site clinician review. The update reinforces opportunities around interoperability features, including data export, device-to-platform connectivity, and remote support, which can reduce manual transcription and fit EMR-driven clinical operations.
Product innovation is also broadening the practical use cases for subjective refraction hardware, including open-field and virtual-lens approaches that change form factors and exam flow. NIDEK announced the Phantom open-field refraction system in January 2026, and peer-reviewed work in 2026 assessed open-field and wearable digital subjective refraction concepts, pointing to continued clinical and engineering focus on shortening refraction time and improving consistency. Together, these lines of development complement demand from high-volume optical retail chains and portable-care models, where compact digital units and software-defined upgrades can differentiate against long-life manual instruments.
Recent Industry Developments in Phoropters Market
- May 2026: Ametek Reichert integrated the SightChek Digital Phoroptor into the DigitalOptometrics tele-optometry platform to support remote comprehensive refraction workflows. The integration links the phoropter to virtual-care operations and adds recurring software and service touchpoints alongside hardware placements.
- October 2025: Haag-Streit brought its Refractor 900 digital phoropter to the United States market around the AAO annual meeting timeframe. The U.S. debut expands competitive choice in connected refraction lanes and raises the bar for digital workflow features for clinics evaluating upgrades from manual systems.
- September 2025: Haag-Streit launched the Refractor 900 digital phoropter internationally at the ESCRS congress in Copenhagen. The international rollout supports faster multi-region adoption of digitally integrated refraction lanes for hospitals, specialty eye clinics, and optical chains standardizing exam protocols across sites.


Phoropters Market Report Scope and Research Methodology
Market Definition and Coverage
This market covers the annual revenue generated from new phoropters used for subjective refraction during eye exams, covering manual and digital systems that hold interchangeable lenses, cylinders, and prisms for prescription fine-tuning.
Scope exclusions: Excludes standalone objective refraction devices (such as autorefractors and wavefront aberrometers), plus refurbished units and rentals.
Segments Covered in This Report
- By Product Type (Value)
- Manual Phoropters
- Digital / Automated Phoropters
- By End User (Value)
- Hospitals & Eye Clinics
- Optical Retail Chains
- Independent Optometrists
- Ambulatory Surgical Centers
- Academic & Research Institutes
- By Distribution Channel (Value)
- Direct Sales
- Distributor / Dealer Network
- Online Sales
- By Region (Value)
- North America
- United States
- Canada
- Mexico
- Europe
- Germany
- United Kingdom
- France
- Italy
- Spain
- Rest of Europe
- Asia-Pacific
- China
- India
- Japan
- South Korea
- Australia
- Rest of Asia-Pacific
- South America
- Brazil
- Argentina
- Rest of South America
- Middle East and Africa
- GCC
- South Africa
- Rest of Middle East and Africa
- North America
Data Sources, Market Sizing, and Validation
Desk Research
Desk work starts by mapping the demand pool for routine and specialty eye examinations, and then translating that into equipment needs for clinics, hospitals, and optical practices. We pull foundational signals from public health and demographic series, and we also review care delivery trends so the assumed equipment replacement pace does not drift away from observed clinic behavior.
Examples of non-paywalled sources used include publications and datasets from the World Health Organization, U.S. CDC vision and health statistics, OECD health indicators, the World Bank population and aging profiles, and peer-reviewed ophthalmology and optometry journals. On the supply side, we screen company annual reports, investor presentations, product brochures, and regulatory and standards references for ophthalmic devices, followed by reputable press coverage of clinic expansion and device launches. Select paid subscriptions are used mainly for company financial intelligence, patent checks, and shipment-linked trade statistics where available, so pricing and volume assumptions can be stress-tested against trade patterns. These sources are illustrative, and many other public references were also used for data collection, validation, and clarification.
Primary Interviews and Surveys
Primary inputs come from interviews and structured surveys with manufacturers, distributors, optometry and ophthalmology practitioners, and procurement teams at care sites. Since adoption differs by care setting and region, we validate assumptions across APAC, EMEA, and the Americas, and we recheck areas where desk signals are thin, including replacement timing and the manual to digital mix.
Distribution of primary research fieldwork respondents
| Company type | Respondent position | Region |
|---|---|---|
| Top tier: 26% | CXOs: 13% | APAC: 43% |
| Mid tier: 53% | Functional/Unit leaders: 34% | EMEA: 31% |
| Smaller Players: 21% | Managers: 53% | Americas: 26% |
Market-Sizing & Forecasting
The core model is built using a top-down approach, where eye-care activity and installed care capacity are used to reconstruct the likely purchasing pool for phoropters by region and care setting. To keep the totals practical, results are then corroborated with selective bottom-up approximations, such as rolling up a sample of supplier revenues by geography, checking channel markups, and testing price ranges against observed manual versus digital configurations.
Key inputs that shape the sizing include the number of eye exams and refraction-heavy visits, the count and expansion rate of optometry and ophthalmology clinics, replacement and service-life ranges for phoropters, the manual to digital mix, and average selling price bands by device type and channel. Where direct volume visibility is limited, gaps are handled by using conservative replacement cycles and by anchoring demand to facility counts and utilization patterns, before assumptions are adjusted through expert feedback from care-site and channel contacts.
For forecasting, we rely on scenario analysis with a light multivariate view of the main drivers, because market growth tends to follow repeatable signals such as aging population share, myopia prevalence trends, and clinic capacity additions. When the driver path differs by region, the forecast is split and recombined so one fast-growing geography does not overstate the global trend.
Data Validation & Update Cycle
Model outputs are checked against independent signals such as ophthalmic device ordering patterns, clinic expansion announcements, and price movement consistency across regions, and then reviewed for year-to-year jumps that do not match demand drivers. When a variance looks material, we circle back to the relevant assumption, recheck the desk sources, and re-contact industry participants to confirm whether the shift is real or timing-related.
Before sign-off, the work goes through multi-step analyst review, including logic checks for scope consistency and sensitivity tests on the highest-impact inputs. The report is refreshed on an annual cycle, and interim updates are done when material events occur, including notable regulatory shifts or sudden pricing changes noted in channel data. Right before delivery, a fresh pass is completed so clients receive the most current view available.
Mordor Intelligence's Phoropters Market Size Versus Other Published Estimates
Published numbers for phoropters can differ even when the growth story looks similar, because the counted products and the year alignment are not always the same. Differences usually come from what is treated as a phoropter sale, how manual and digital ASPs are progressed, and whether the market is anchored to care delivery activity or to broader ophthalmic equipment pools.
Refurbished and rental phoropter units sit outside Mordor Intelligence's scope, which tends to reduce the total versus estimates that treat secondary equipment flows as part of annual revenue. Other gaps often come from folding in objective refraction tools, applying higher near-term replacement assumptions, or using aggressive price uplift without validating it against channel feedback and procurement behavior. Currency timing and the chosen base year can also widen spreads when a study mixes calendar-year averages with point-in-time pricing.
Benchmark comparison
| Source | Market Size | Gaps in Research Methodology |
|---|---|---|
| Mordor Intelligence | USD 0.17 B (2026) | |
| Global Consultancy A | USD 0.18 B (2026) | Uses a higher 2026 level that appears to assume faster replacement and a quicker shift to digital configurations, which can lift blended ASPs without enough channel cross-checks. |
| Industry Publisher B | USD 0.16 B (2025) | Reports a prior-year value and may treat the product scope more narrowly around manual and automated phoropters, which can undercount software-enabled digital systems sold as part of connected exam workflows. |
The comparison shows that a one-year shift and small scope differences can explain most of the spread at this market size. By tying demand to exam activity, facility capacity, replacement timing, and realistic price bands, the estimate stays traceable to inputs that can be rechecked and updated as conditions change.


Key Questions Answered in the Report
What is driving the global shift toward digital phoropters?
Faster exam times, direct EMR integration, and the ability to delegate testing to technicians are the core catalysts. Automated units complete refractions in as little as 171 seconds while exporting results straight to patient records.
How large is the current phoropters-market and how fast is it growing?
The phoropters-market size stands at USD 172.44 million in 2026 and will expand to USD 213.93 million by 2031, reflecting a 4.42% CAGR.
Why is Asia-Pacific considered the fastest-growing region?
A myopia prevalence of up to 90 % among East-Asian teenagers and government-funded school screening programs push the region to a 6.84% CAGR
What limits adoption of premium digital phoropters in smaller clinics?
High upfront cost and limited insurance reimbursement mean independent practitioners often cannot recover investments quickly, especially in emerging markets where refurbished manual units are readily available.
Which market segment is expanding the quickest?
Optical retail chains grow at 5.68% CAGR because consumer demand for fast, transparent, in-store eye exams aligns with technician-operated digital phoropters.
Page last updated on:


 Your data is secure and never sold or shared.


