
Phoenix Data Center Market Size and Share
Market Overview
| Study Period | 2020 - 2031 |
|---|---|
| Forecast Data Period | 2026 - 2031 |
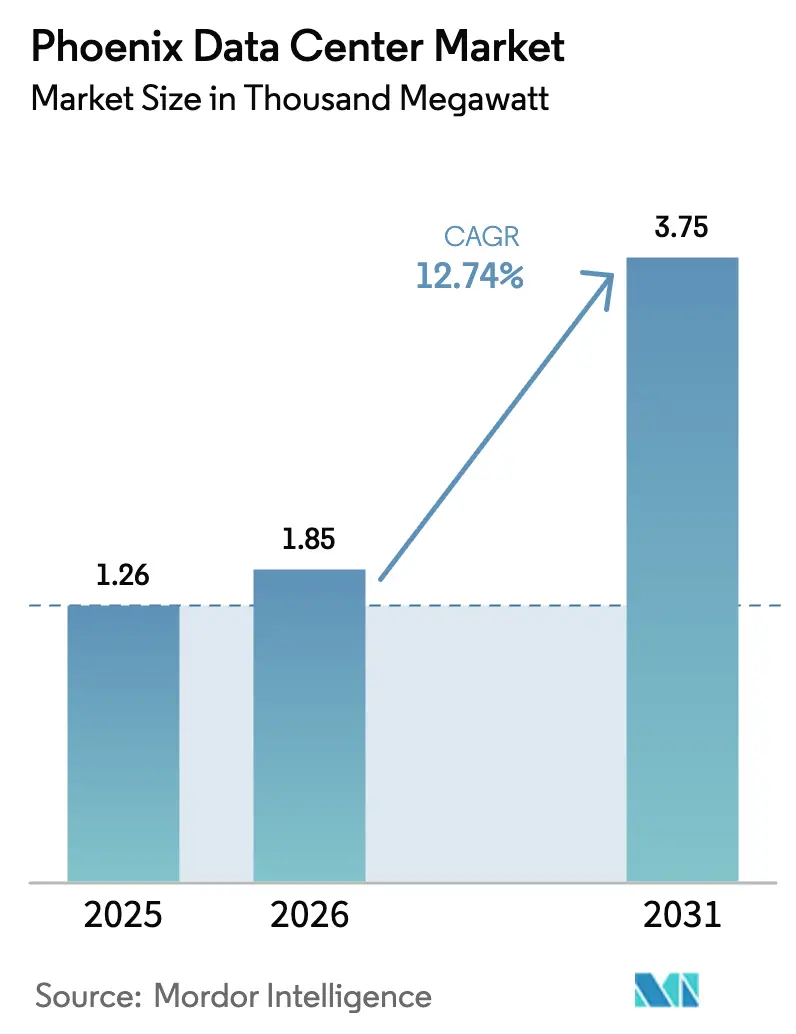
| Base Year Market Size (2025) | 1.26 Thousand megawatt |
| Market Volume (2026) | 1.85 Thousand megawatt |
| Market Volume (2031) | 3.75 Thousand megawatt |
| Growth Rate (2026 - 2031) | 12.74% CAGR |
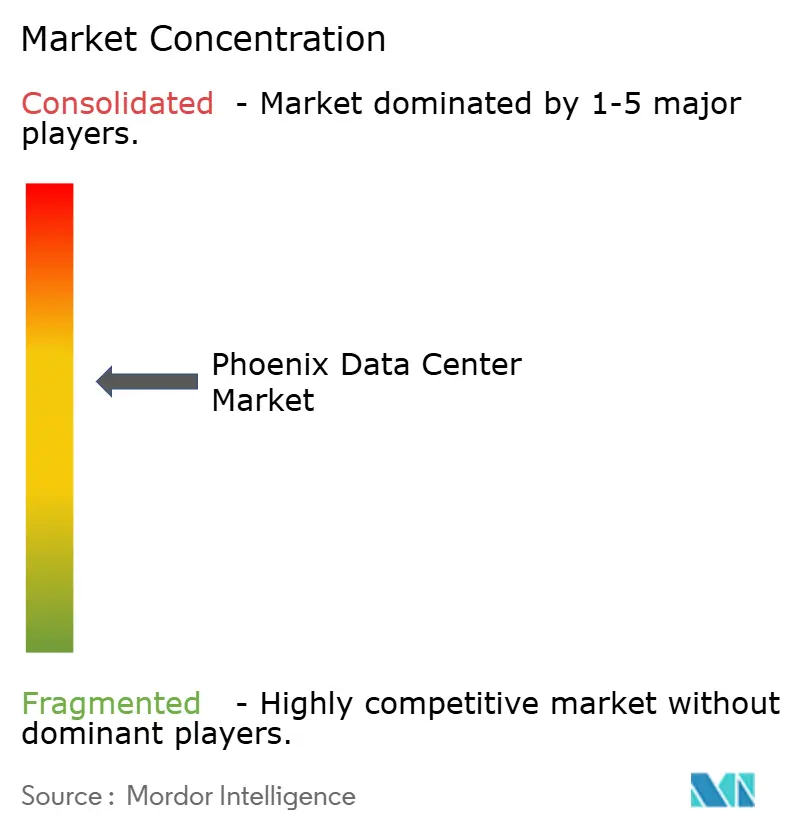
| Market Concentration | Medium |
Major Players *Disclaimer: Major Players sorted in no particular order Image © Mordor Intelligence. Reuse requires attribution under CC BY 4.0. | |
Phoenix Data Center Market Analysis by Mordor Intelligence
Phoenix data center market size in 2026 is estimated at 1.85gigawatt, growing from 2025 value of 1.25 gigawatt with 2031 projections showing 3.75 gigawatt, growing at 12.74% CAGR over 2026-2031. Growth stems from the convergence of hyperscale artificial intelligence (AI) workloads, a rapidly expanding semiconductor base, and cost-competitive renewable energy. Power-dense AI clusters, on-site microgrids, and a ten-year sales-tax waiver on IT equipment encourage rapid facility roll-outs. Operators also benefit from average electricity prices that sit 20% below California rates and a low-risk climate that avoids earthquakes and hurricanes. As a result, the Phoenix data center market continues to attract flagship deployments from Microsoft, Google, Amazon, and Meta while simultaneously drawing enterprise relocations out of constrained coastal hubs.
Key Report Takeaways
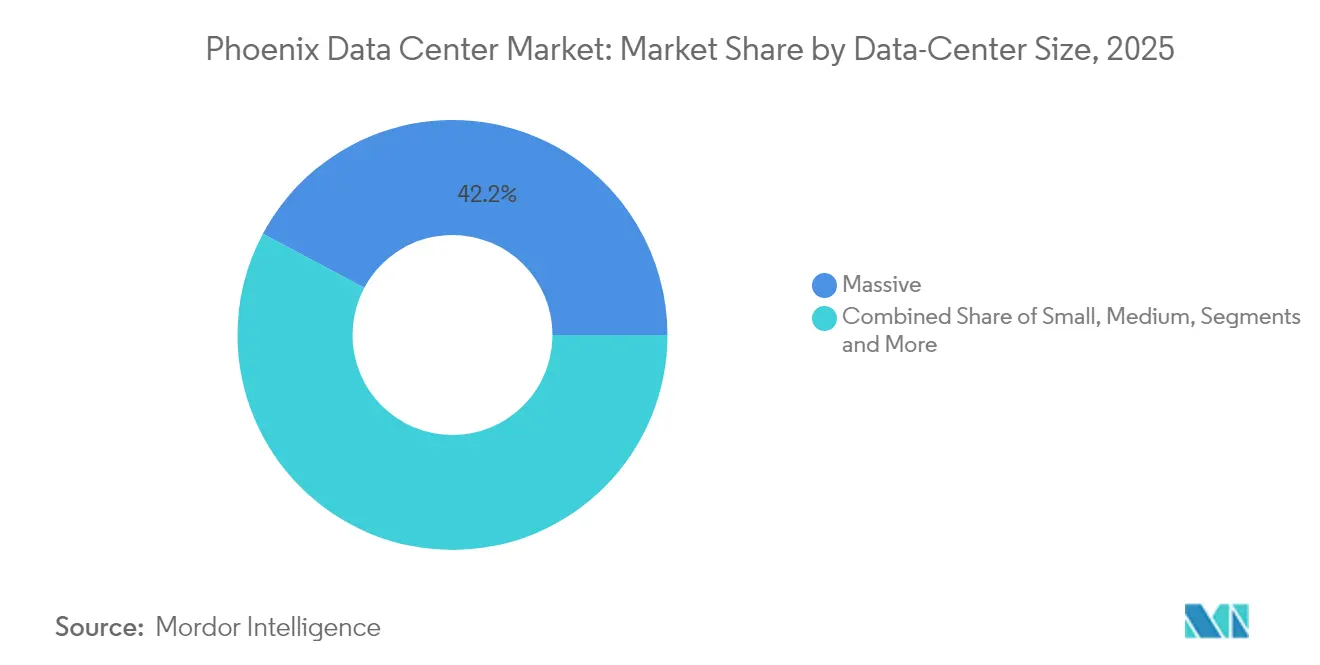
- By data-center size, large facilities commanded 42.19% of Phoenix data center market share in 2025 and are expanding at a 15.86% CAGR through 2031.
- By tier, Tier 4 infrastructure is set to grow at 16.74%—the fastest rate—while Tier 3 retained 76.22% share of Phoenix data center market size in 2025.
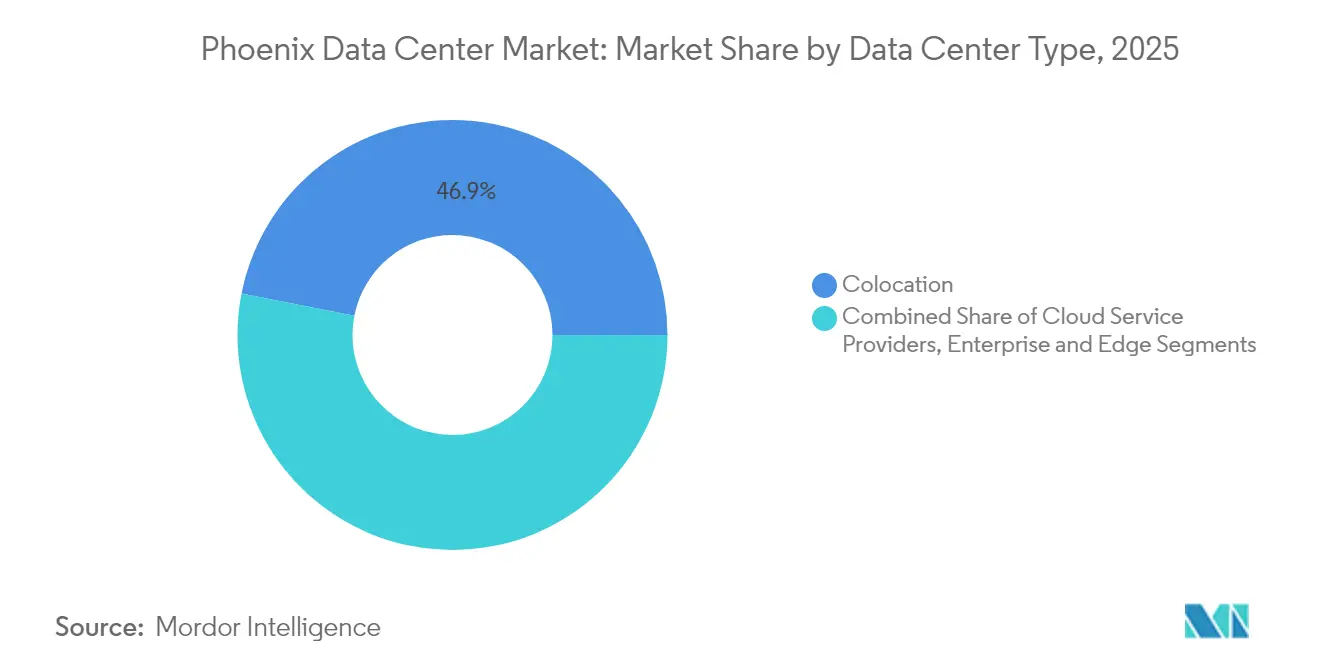
- By data-center type, colocation held 46.91% share in 2025, yet cloud service providers are advancing at an 17.82% CAGR over 2026-2031.
Note: Market size and forecast figures in this report are generated using Mordor Intelligence’s proprietary estimation framework, updated with the latest available data and insights as of 2026.
Phoenix Data Center Market Trends and Insights
Drivers Impact Analysis*
| Driver | (~) % Impact on CAGR Forecast | Geographic Relevance | Impact Timeline |
|---|---|---|---|
| Surging hyperscale and AI-driven demand | 4.2% | Global, concentrated in Phoenix metro | Short term (≤ 2 years) |
| Competitive power prices and renewable PPAs | 3.1% | Arizona statewide, spillover to Southwest | Medium term (2-4 years) |
| Ten-year sales-tax waiver on IT equipment | 2.3% | Arizona statewide | Long term (≥ 4 years) |
| Semiconductor fabs' edge-compute spill-over | 1.8% | Phoenix metro, Chandler corridor | Medium term (2-4 years) |
| Migration from CA seismic and water-restricted sites | 1.1% | California to Arizona corridor | Short term (≤ 2 years) |
| On-site microgrid deployment for rapid energization | 0.7% | Phoenix metro, utility-constrained areas | Medium term (2-4 years) |
| Source: Mordor Intelligence | |||
Surging hyperscale and AI-driven demand
AI training clusters require up to 1,000 MW per campus—tenfold traditional deployments—prompting rapid land and power acquisitions across greater Phoenix. Microsoft’s Goodyear estate is engineered for high water-usage evaporative cooling, while Blackstone’s USD 25 billion outlay covers more than 60 football fields of floor area.[1]Data Center Dynamics Editorial Team, “Microsoft is building two huge data centers in Arizona,” datacenterdynamics.com Local semiconductor output by TSMC from 2025 shortens supply chains for GPUs, reinforcing a loop in which chips feed local AI workloads and spur even more capacity additions.
Competitive power prices and renewable PPAs
Arizona’s average electricity tariff is 20% below California and is falling further through innovative power-purchase agreements (PPAs) that bypass utility bottlenecks.[2]Kye Larkin, “Data centers reshape Phoenix’s economy,” azbigmedia.com Salt River Project (SRP) supports Google’s Mesa campus with a 260 MW solar-plus-storage farm, while Meta’s 200 MW Brittlebush Solar Park delivers dedicated green power. The American Clean Power Association values completed and committed clean-energy investments across the state at USD 13 billion.
Ten-year sales-tax waiver on IT equipment
Arizona expanded its Computer Data Center Program in 2024 to grant 10-year sales-tax exemptions on purchases above USD 50 million, saving hyperscalers millions over the life of each campus.[3]Dave Smith, “Arizona’s new data-center deal sweetens tax breaks,” datacenterknowledge.com The incentive applies to both colocation customers and owner-operated builds, widening its reach throughout the Phoenix data center market.
Semiconductor fabs’ edge-compute spill-over
TSMC’s three-fab, USD 165 billion project is bringing more than 62,000 jobs and large-scale edge computing needs for real-time analytics and defect detection. Intel’s legacy Chandler campus and AMD’s design wins further densify the local chip supply chain, locking in steady data-center demand for at least the next decade.
Restraints Impact Analysis*
| Restraint | (~) % Impact on CAGR Forecast | Geographic Relevance | Impact Timeline |
|---|---|---|---|
| Utility power-queue bottlenecks | -2.8% | Phoenix metro, APS and SRP service areas | Short term (≤ 2 years) |
| Water-consumption scrutiny in desert climate | -1.9% | Arizona statewide, municipal oversight areas | Medium term (2-4 years) |
| Municipal push-back over heat-island rezoning | -1.3% | Phoenix city limits, suburban municipalities | Long term (≥ 4 years) |
| Transformer supply-chain delays for liquid-cooling | -0.9% | Global, acute in high-growth markets | Medium term (2-4 years) |
| Source: Mordor Intelligence | |||
Utility power-queue bottlenecks
APS is already evaluating interconnection requests that exceed 13 GW against an existing grid that served just 7 GW in 2024, stretching approval cycles to as long as three years. To sidestep the queue, Aligned Data Centers adopted a 63 MW diesel microgrid capable of grid-island operation, while Vantage paired with VoltaGrid to secure 1 GW of on-site generation capacity.
Water-consumption scrutiny in a desert climate
Microsoft’s Goodyear campus drew headlines for projected withdrawals of tens of millions of gallons annually. Roughly 66% of all U.S. data-center projects underway since 2022 sit in areas of “high” or “extremely high” water stress. Response strategies include Edged Energy’s Mesa site, which eliminates evaporative cooling and claims annual savings of 94 million gallons edgedenergy.com, and Microsoft’s pledge to achieve zero-water data centers by 2026.
*Our forecasts treat driver/restraint impacts as directional, not additive. The impact forecasts reflect baseline growth, mix effects, and variable interactions.
Segment Analysis
By Data Center Size: Large Facilities Drive AI Transformation
Large campuses accounted for 42.19% of Phoenix data center market share in 2025 and captured the highest growth trajectory at 15.86% CAGR to 2031. The Phoenix data center market size for large builds is therefore set to rise well above 2.2 GW by the end of the decade. Operators deploy massive footprints to deliver contiguous power and efficient liquid-cooling loops that suit AI racks drawing 40 kW or more per cabinet. QTS is progressing on a 750 MW campus over 400 acres in the West Valley, while Tract is master-planning a USD 14 billion, 1,000-acre estate comprising 30 buildings.
Second-tier demand persists for sub-50 MW halls serving regional enterprises, yet hyperscale roadmaps dominate expansions. Mega campuses typically add dedicated substations, solar arrays, and gas-fired microgrids, as seen in Vantage-VoltaGrid’s 1 GW program. Edge-scale rooms closer to TSMC fabs complement the wider footprint by hosting low-latency analytics and robotics control.


By Tier Type: Tier 4 Facilities Accelerate for AI Workloads
Tier 3 remained the workhorse at a 76.22% slice of Phoenix data center market size in 2025, but Tier 4 is on track for a 16.74% CAGR through 2031 digitalrealty.com. Up-time guarantees jump from 99.982% (Tier 3) to 99.995% (Tier 4), a differential that becomes pivotal when AI training clusters can cost millions if interrupted mid-cycle. Digital Realty’s roadmap includes multiple Tier 4-ready halls in Mesa, while Aligned integrates Delta³ cooling to hit both Tier 4 resilience and energy-efficiency benchmarks.
Legacy facilities are investing in electrical redundancies and new chillers to reclassify halls from Tier 3 into Tier 4, attracting premium rates from CSP tenants. Meanwhile, Tier 1 and Tier 2 builds persist for lab workloads and dev-test sandboxes where downtime is less critical.
By Data Center Type: Cloud Service Providers Lead Growth
Colocation maintained 46.91% share of Phoenix data center market size in 2025, but CSPs exhibit the quickest expansion at 17.82% CAGR. Microsoft secured nearly 300 acres in El Mirage, Google filed to double its Mesa campus footprint, and Amazon continues to scout land along Interstate-10. Hyperscalers prefer Phoenix for multi-AZ availability zones that back up California regions without crossing multiple time zones.
Retail colocation remains vital for enterprises migrating legacy hardware, government agencies centralizing workloads, and fintechs requiring audited facilities. However, wholesale colocation is migrating toward “hyperscale-as-a-service,” where providers build entire halls to a single tenant’s specification. Edge and modular deployments have begun serving semiconductor fabs and public-sector IoT nodes, ensuring data locality and sovereignty.
Geography Analysis
Phoenix ranks as the second-largest data-center cluster in the United States, anchored by low seismic risk, dry climate, and a backbone of more than 40 carriers. The Phoenix data center market benefits from 5,500 MW of installed clean-energy capacity with 8,700 MW more in the queue—ample headroom for 400 MW-plus campuses while hitting renewable commitments.
Expansion is no longer limited to Maricopa County. Tucson’s USD 1.2 billion Project Blue will add 8-10 halls over 290 acres, complementing Phoenix while tapping a different labor pool. Across the state line, Google’s Henderson, Nevada build illustrates a Southwest multi-state strategy whereby operators arbitrage solar resources and transmission capacity datacenterknowledge.com.
California’s strained grid and water restrictions have already triggered a migration wave; Santa Clara alone hosts more than 50 facilities consuming 60% of city power, a trend nudging operators toward Arizona’s friendlier permitting environment. Fiber and power interconnections across the Desert Southwest tie Phoenix, Las Vegas, and Southern California into a resilient “sun belt” corridor for cloud growth.
Regulatory Landscape
Phoenix data center projects operate under a mix of state incentive programs, municipal zoning controls, and utility oversight. At the city level, Phoenix adopted Ordinance G-7396 (Z-TA-2-25-Y) on July 2, 2025, creating a Special Permit requirement for data centers across multiple zoning districts and adding performance and noise standards, which makes early entitlement planning more consequential for multi-building campuses.
On the state side, Arizona’s Computer Data Center Program framework (including Transaction Privilege Tax relief tied to qualifying investments) remains a core siting lever, while 2026 legislative proposals add uncertainty around process and incentive eligibility for high-load customers, including a bill seeking to end new certifications after December 31, 2026). Water-use governance is also tightening through large-volume water user ordinances across municipalities in the metro area, pushing operators toward documented Water Use Plans and cooling approaches that reduce or avoid potable water. Utility cost-allocation scrutiny under the Arizona Corporation Commission (ACC) continues as well, particularly for grid impacts tied to large-load interconnections.
Value Chain Analysis
The Phoenix data center value chain starts with land acquisition and entitlements in Phoenix-area municipalities, followed by power procurement and interconnection planning. For high-load customers, this is increasingly shaped by ACC-regulated utility rate design and cost-allocation debates. Developers and operators then move into design and engineering, including high-density electrical architecture and liquid-cooling capable layouts, procure long-lead electrical gear such as substations, transformers, and switchgear, and contract with general contractors for phased builds. Commissioning, carrier and fiber connectivity onboarding, and ongoing facilities operations complete the chain.
Downstream, capacity is monetized through wholesale and retail colocation and hyperscale leasing. Energy strategy (renewable PPAs, storage, and on-site generation) and water strategy (waterless or low-water cooling) have become part of standard delivery requirements rather than optional add-ons. Key participants include hyperscalers, colocation and campus operators, utilities and clean power developers, municipal water and planning authorities, and specialized technology providers for cooling and power, with local water-use ordinances and state tax-incentive compliance influencing how facilities are designed, cooled, and brought online.
Competitive Landscape
The Phoenix data center market features a core of incumbents—Digital Realty, Vantage, CyrusOne, QTS, Iron Mountain—supplemented by agile entrants leveraging liquid cooling and modular construction. Digital Realty booked record quarterly signings in Q4 2024, translating worldwide scale into regional momentum. Vantage secured USD 9.2 billion in fresh equity and paired with VoltaGrid to guarantee 1 GW of dispatchable on-site power, a differentiator amid grid bottlenecks.
Iron Mountain reported 20% year-over-year data-center revenue growth in Q1 2025—proof that established storage brands can effectively cross-sell cloud-adjacent infrastructure. Disruptors such as Edged Energy target AI-ready, water-free designs, while the Evoque-Cyxtera merger into Centersquare aggregates 320 MW across 50 locations, adding national reach to new Phoenix builds.
Competitive differentiation now hinges on three levers: renewable-rich PPAs that lower total-cost-of-ownership, innovative liquid-cooling systems that shrink land and water footprints, and microgrid architectures that bypass multiyear interconnection queues. Whitespace persists in semiconductor edge hubs, government cloud zones, and AI inference clusters where low-latency proximity to end users matters.
Phoenix Data Center Industry Leaders
Digital Realty Trust, Inc.
CyrusOne
Vantage Data Centers
Aligned Data Centers
EdgeCore Digital Infrastructure
- *Disclaimer: Major Players sorted in no particular order

Market Opportunities and Future Outlook
A near-term whitespace in Phoenix is entitlement-ready, power-defined capacity outside the most congested interconnection pockets. In these areas, operators can progress sites through municipal approvals while aligning power strategies that reduce exposure to multi-year utility queues. The market is already showing this pattern through suburban campus activity and new construction starts, including Aligned Data Centers moving forward with Phoenix-area plans and breaking ground on PHX-13 in Glendale as part of a larger campus, alongside large planned campuses advancing in West Valley submarkets.
A second opportunity cluster centers on water-constrained design and compliance services. Multiple Phoenix-area municipalities have implemented large-volume water user ordinances that can require Water Use Plans or limit potable water for cooling. That regulatory direction supports providers that can deliver AI-ready density with reduced water footprints, including waterless or refrigerant-based cooling and heat-rejection optimization. It also opens room for partners that can package renewable PPAs, storage, and on-site generation into bankable power solutions that fit Arizona’s evolving utility cost-allocation environment. Private capital backing for AI-oriented infrastructure has become more visible in the region through large platform-level transactions involving operators active in Phoenix, supporting continued campus-scale development and ongoing demand for scalable construction and electrical supply chains.
Recent Industry Developments
- July 2026: Prime Data Centers broke ground on three of five buildings at its 240MW PHX01 campus in Avondale, with each building providing 48MW of IT capacity. The PHX01 campus advances hyperscale deployment in Avondale. Expands capacity and reinforces AZ as an AI-ready hub
- July 2026: Aligned Data Centers broke ground on the PHX-13 facility in Glendale, part of a planned 100-acre campus. Phx-13 supports continued AI-ready data center growth in Glendale. Strengthens foothold in Glendale and enhances regional supply options for hyperscale deployments
- May 2026: CyrusOne Mesa Planning and Zoning Commission recommended approval for CyrusOne's 1.4 million square foot data center campus at Elliot and Ellsworth Roads in Mesa. Regulatory milestone enabling large-scale Mesa expansion in Phoenix metro. Regulatory clearance enables significant suburb-borne capacity and diversifies Phoenix-area footprint


Research Methodology Framework and Report Scope
Market Definition and Coverage
This market covers data center supply and demand located in the Phoenix metro area, measured by commissioned and planned IT load capacity (MW/GW) and the related build-out activity that enables that capacity.
Scope exclusions: Retail edge closets inside offices, on-prem server rooms that are not purpose-built data centers, and telecom-only central offices are not counted.
Segmentation Overview
- By Data Center Size
- Small
- Medium
- Large
- Hyperscale
- By Tier Type
- Tier 1 and 2
- Tier 3
- Tier 4
- By Data Center Type
- Cloud Service Providers (CSPs)
- Enterprise, Modular and Edge
- Colocation
- Non-Utilized
- Utilized
- Colocation Type
- Retail
- Wholesale
- End User
- Cloud and IT
- Telecom
- Media and Entertainment
- Government
- BFSI
- Manufacturing
- E-Commerce
- Other End User
- Colocation Type
Data Sources, Market Sizing, and Validation
Desk Research
Desk work starts with building a fact base on Phoenix capacity additions, deliveries, and the near-term pipeline, then cross-checking it with power and permitting context. For this, we typically refer to public market dashboards and releases such as CBRE market profiles, City of Phoenix planning and permit resources, the US Energy Information Administration for electricity pricing and generation mix signals, and US Census Bureau construction and business series.
To reduce gaps, the desk view is then connected to operator expansion signals found in company filings, investor decks, utility interconnection updates, and reputed local business press. We also use select paid subscriptions for company financials and intelligence, import and export shipment-level checks for large electrical gear when relevant, and patent databases to spot cooling and power-density direction of travel. The desk sources listed here are illustrative only, and many other public documents were also used to collect, validate, and clarify data points.
Primary Interviews and Surveys
Primary work is used to pressure-test the desk model with people who track real capacity additions, lease-up, and power availability in Phoenix. We spoke with operators, engineering and facility leaders, brokers, contractors, and large users, and these discussions were used to validate timing of new capacity, typical power density, and realistic utilization at ramp-up across key Phoenix submarkets.
Distribution of primary research fieldwork respondents
| Company type | Respondent position | Region |
|---|---|---|
| Top tier: 31% | CXOs: 12% | APAC: 49% |
| Mid tier: 54% | Functional/Unit leaders: 42% | EMEA: 33% |
| Smaller Players: 15% | Managers: 46% | Americas: 18% |
Market-Sizing & Forecasting
Sizing is built using a top-down reconstruction of the Phoenix demand pool through data center capacity additions, absorption signals, and the local power-constrained build cycle, and then the totals are checked with selective bottom-up approximations. In practice, we use delivered MW, announced and under-construction MW, vacancy and absorption trendlines, and expected utilization ramps to translate the active pipeline into yearly capacity outcomes.
Key Phoenix fingerprints we track include the pace of commissioned MW additions, power availability and interconnection timing, typical prelease behavior for large blocks, and shifts in rack power density that affect how quickly MW gets absorbed. Inputs also cover construction lead times for electrical equipment, land and permitting timelines across the metro, and utility or renewable procurement signals that set constraints on feasible delivery schedules. Forecasts were produced using scenario analysis around power delivery and construction timing, and the final path was chosen based on expert consensus from interviews.
Where bottom-up views are incomplete, gaps are handled by sampling a set of active campuses and normalizing to observed MW-per-site and delivery cadence, then scaling that to the broader pipeline and rechecking against market-wide inventory movements.
Data Validation & Update Cycle
Outputs are validated through consistency checks across multiple indicators, including inventory growth, absorption, vacancy movement, and the visible construction pipeline. Any variance that looks too large is reviewed again, and assumptions such as utilization ramp, delivery timing, and power constraints are revisited before sign-off.
Reports are refreshed annually, and interim updates are triggered when material events occur, such as major campus announcements, utility queue changes, or sudden permitting shifts. Before final delivery, an analyst performs a fresh pass on recent public releases and key interview notes so clients receive the latest updated view.
Mordor Intelligence's Phoenix Data Center Market Sizing Compared With Other Published Estimates
Published estimates for Phoenix often differ because the market can be counted in different units, with different timing rules, and with different boundaries around what qualifies as usable capacity. Some sources focus on commissioned inventory at a point in time, others emphasize planned pipeline, and a few convert MW into dollars using assumptions that are not made visible.
Inventory and absorption signals such as Phoenix reaching 602.8 MW of total inventory in 2024 and the step-up in delivered capacity are the checks that anchor Mordor Intelligence's estimate to a traceable capacity pathway, rather than relying on a single pipeline headline number. Differences also come from how fast utilization is assumed to ramp, whether under-construction MW is treated as fully in-market, and what currency timing is used when values are converted from capacity-driven models.
Benchmark comparison
| Source | Market Size | Gaps in Research Methodology |
|---|---|---|
| Mordor Intelligence | USD 1.25 T (2025) | |
| Trade Journal A | USD 0.30 T (2020) | Uses commissioned power at a historical point in time (295 MW at end-2020) and does not normalize forward using delivery timing, utilization ramp, or the multi-year construction pipeline. |
| Industry Real Estate Source B | USD 0.60 T (2024) | Reflects inventory MW (602.8 MW in 2024) as a supply snapshot and does not extend it into a full forecasted market pathway that accounts for under-construction delivery schedules and ramp-to-stabilization. |
The spread in the table is mainly explained by timing and what stage of capacity is being counted, not by disagreement that Phoenix is expanding quickly. By linking the forecast to observable MW movements and then validating key assumptions through interviews, the final figures stay easier to follow and repeat when new capacity and leasing data is released.


Key Questions Answered in the Report
What is the current size of the Phoenix data center market?
The market hosts 2.71 GW of deployed capacity as of 2026, second only to Northern Virginia.
How fast is the Phoenix data center market expected to grow?
Capacity is forecast to reach 4.93 GW by 2031, translating into a 12.74% CAGR over the 2026-2031 forecast period.
Why are hyperscale operators choosing Phoenix over California?
Arizona offers electricity prices 20% lower than California, ten-year sales-tax exemptions, and a lower risk profile for natural disasters.
Which segment is expanding the quickest within the Phoenix data center market?
Tier 4 facilities register the highest growth rate at 16.74% through 2031 as AI workloads demand maximum uptime.
How are operators addressing water use in a desert environment?
Providers are adopting waterless or refrigerant-based cooling, on-site microgrids for energy efficiency, and corporate pledges toward zero-water operations by 2026.
What role does the semiconductor industry play in Phoenix’s data-center boom?
TSMC’s USD 165 billion fab complex and Intel’s upgrades generate edge computing demand that directly feeds new data-center builds across the metro area.
Page last updated on:






