
Market Overview
| Study Period | 2020 - 2031 |
|---|---|
| Forecast Data Period | 2026 - 2031 |
| Base Year Market Size (2025) | USD 15.26 Billion |
| Market Size (2026) | USD 16.20 Billion |
| Market Size (2031) | USD 21.60 Billion |
| Growth Rate (2026 - 2031) | 5.93 % |
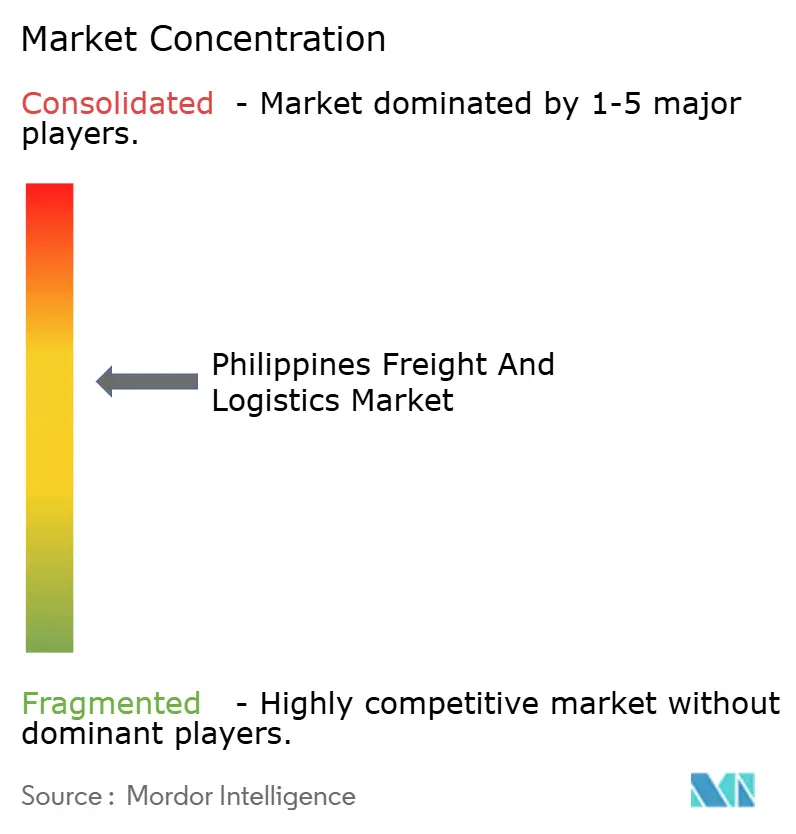
| Market Concentration | Medium |
Major Players *Disclaimer: Major Players sorted in no particular order Image © Mordor Intelligence. Reuse requires attribution under CC BY 4.0. | |
Philippines Freight And Logistics Market Analysis by Mordor Intelligence
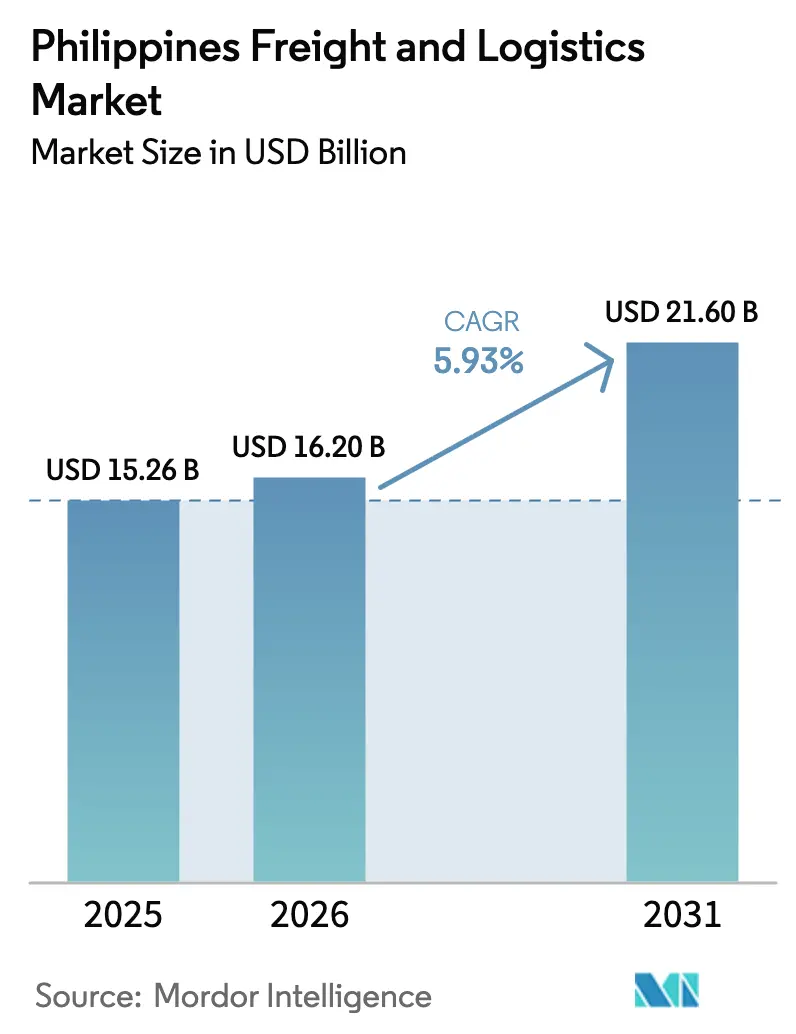
The Philippines Freight And Logistics Market size was valued at USD 15.26 billion in 2025 and is estimated to grow from USD 16.20 billion in 2026 to reach USD 21.60 billion by 2031, at a CAGR of 5.93% during the forecast period (2026-2031).
E-commerce adoption, flagship infrastructure spending, and resurgent export manufacturing are expanding shipment volumes across every transport mode, while digital platforms compress fulfillment lead times and lower search costs for shippers. Temperature-controlled capacity is moving up the investment queue as food and pharmaceutical flows require tighter environmental controls. Global integrators are scaling air-cargo hubs in Clark to capture high-value cargo, even as domestic truckers and coastal shippers leverage the Build Better More corridors to unlock underserved provincial lanes. At the same time, chronic Metro Manila congestion, high inter-island freight rates, and recurring typhoon disruptions shave cost competitiveness and push operators toward alternative gateways and risk-mitigation technologies.
Key Report Takeaways
- By logistics function, courier, express, and parcel services posted the fastest 6.82% CAGR between 2026-2031, while freight transport retained a 63.27% Philippines freight and logistics market share in 2025.
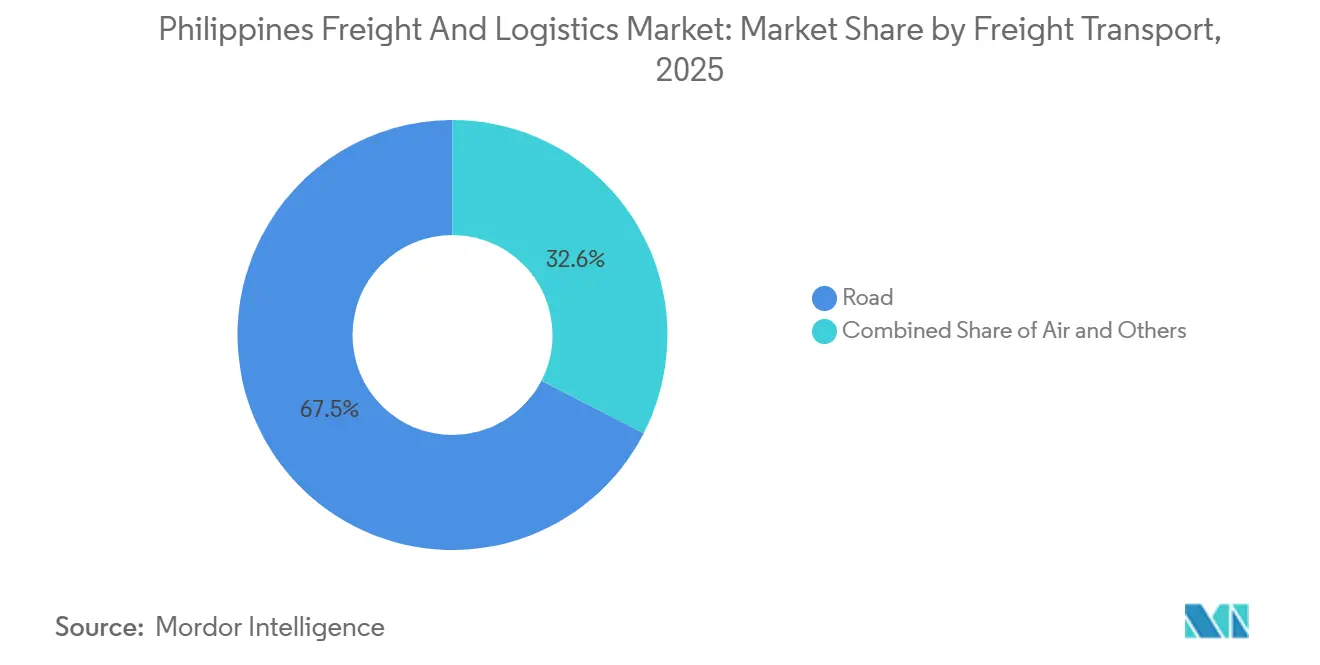
- By freight transport mode, road freight handled 67.45% of 2025 revenue, but air freight advanced at a leading 7.55% CAGR between 2026-2031, narrowing the gap with sea lanes.
- By CEP destination, domestic parcels held 64.98% of revenue in 2025; international parcels accelerated at 7.07% CAGR and will outpace domestic growth between 2026-2031.
- By warehousing temperature control, temperature-controlled capacity captured 8.41% of 2025 space and is set to grow at a 6.69% CAGR between 2026-2031, outstripping ambient facilities.
- By freight forwarding mode, sea and inland waterways controlled 58.20% of 2025 values, but air forwarding rose at a 6.76% CAGR between 2026-2031 on the strength of electronics and pharma traffic.
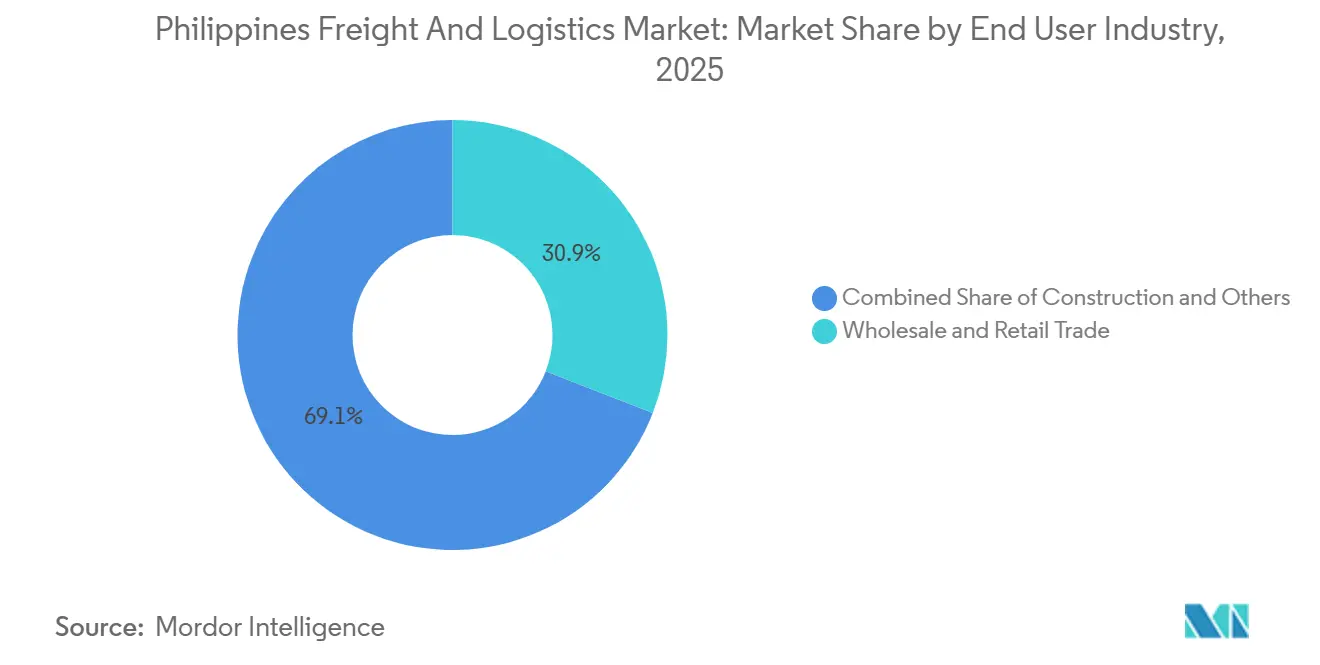
- By end-user industry, wholesale and retail trade led with 30.91% of the Philippines freight and logistics market size in 2025, expanding at a sector-high 6.52% CAGR between 2026-2031, as modern trade penetrated Visayas and Mindanao.
Note: Market size and forecast figures in this report are generated using Mordor Intelligence’s proprietary estimation framework, updated with the latest available data and insights as of January 2026.
Philippines Freight And Logistics Market Trends and Insights
Drivers Impact Analysis*
| Driver | (~) % Impact on CAGR Forecast | Geographic Relevance | Impact Timeline |
|---|---|---|---|
| Surge in B2C e-commerce parcel volumes | +1.2% | National, with concentration in Metro Manila, Calabarzon, Central Luzon | Short term (≤ 2 years) |
| Build Better More infrastructure pipeline | +1.4% | National, prioritizing Luzon connectivity, Mindanao road networks | Long term (≥ 4 years) |
| Manufacturing re-shoring within ASEAN | +0.9% | Calabarzon, Central Luzon, Cebu | Medium term (2-4 years) |
| Growth in temperature-controlled food and pharma flows | +1.1% | National, early gains in Metro Manila, Cebu, Davao | Medium term (2-4 years) |
| Expansion of digital freight-matching platforms | +0.6% | National, urban adoption in Metro Manila, Cebu | Short term (≤ 2 years) |
| Nickel-ore exports for EV battery supply chains | +0.8% | Mindanao (Surigao, Palawan), reverse logistics to mining zones | Long term (≥ 4 years) |
| Source: Mordor Intelligence | |||


Surge in B2C E-Commerce Parcel Volumes
E-commerce gross merchandise value climbed to USD 21 billion in 2025 as 73% of adult Filipinos shopped online, generating a step-change in last-mile activity. Ninja Van’s 2025 tie-up with Universal Robina embeds scan-to-print fulfillment inside fast-moving consumer-goods channels, cutting South Luzon order cycles to under 24 hours. Domestic CEP held 64.98% of 2025 parcels, yet cross-border flows are expanding faster because Clark and Manila gateways now clear most ASEAN parcels within a single day under the National Single Window. Integrated operators that combine warehouse management, sortation, and delivery on a unified software stack capture price premiums and higher asset turns. Pure-play couriers without warehousing depth face commoditization as shippers demand bundled solutions[1]“E-Commerce and Retail Trade Statistics,” Department of Trade and Industry, dti.gov.ph .
Build Better More Infrastructure Pipeline
The PHP 8.3 trillion (USD 143.23 billion) Build Better More program has locked in infrastructure spending near 6% of GDP, with 83% of its 194 flagship projects targeting roads, bridges, ports, and airports. The New Manila International Airport, due in 2028, will handle up to 5 million tons of freight a year, creating a multimodal node that rivals Bangkok and Ho Chi Minh City. Subic Bay’s berth expansion and the Mindanao Railway ring will divert cargo away from Metro Manila choke points, reducing long-haul domestic ton-kilometer costs by up to 18%. These corridors improve equipment utilization for trucking fleets and unlock backhaul opportunities for domestic forwarders, while coastal shippers must lower tariffs to remain competitive[2]“Build Better More Infrastructure Program,” Department of Budget and Management, dbm.gov.ph.
Growth in Temperature-Controlled Food and Pharma Flows
The Department of Agriculture placed PHP 3 billion (USD 51.77 million) in 2024 for 99 provincial cold stores aimed at trimming post-harvest waste by one-third. Maersk’s Optimus Distribution Center opened in late 2024 with 76,000 pallet positions and LEED credentials, signaling multinational demand for sustainable temperature-controlled warehousing. Frabelle’s Navotas blast-freezing hub and Royale Cold Storage’s 2025 Bulacan mega-site expand provincial capacity, while ASEAN pharma harmonization lets a single Philippine hub distribute vaccines to 10 member states. Cold-chain capacity is slated to grow at a CAGR of 6.69% from 2026-2031, outpacing ambient space and raising service expectations across seafood, meat, and biologics lanes.
Nickel-Ore Exports for EV Battery Supply Chains
With 23.3 million wet metric tons shipped in 2024, the Philippines ranked second in global nickel-ore output, earning USD 1.2 billion in export receipts. Every outbound ton triggers up to 2.2 tons of inbound machinery and reagent freight into Surigao and Palawan mine sites, lifting Mindanao’s freight volumes above historical norms. As producers shift to high-pressure acid leach processing, chemical-grade temperature control becomes mandatory, blending bulk commodities with cold-chain requirements. Forwarders packaging ore exports, reagent imports, and equipment reverse-logistics under long-term contracts will lock in predictable revenue, while pure vessel brokers absorb rate volatility.
Restraints Impact Analysis*
| Restraint | (~) % Impact on CAGR Forecast | Geographic Relevance | Impact Timeline |
|---|---|---|---|
| Chronic road congestion in Metro Manila | -0.7% | Metro Manila, Calabarzon spillover | Short term (≤ 2 years) |
| High domestic shipping costs across islands | -0.5% | Visayas, Mindanao, island provinces | Medium term (2-4 years) |
| Typhoon-induced supply-chain disruptions | -0.6% | Bicol, Eastern Visayas, Northern Luzon | Short term (≤ 2 years) |
| Limited uptake of cargo insurance among SMEs | -0.3% | National, acute in provincial routes | Medium term (2-4 years) |
| Source: Mordor Intelligence | |||
Chronic Road Congestion in Metro Manila
Peak-hour speeds of 12–15 kilometers per hour in 2024 impose PHP 3.5 billion (USD 60.39 million) in daily economic losses, with cold-chain breaches costing pharma distributors up to PHP 200,000 (USD 3,451) per incident. Operators are repositioning hubs to Clark and Laguna, lowering land costs by as much as 60% and raising average speeds to 60 kilometers per hour. Cabotage relaxation aims to divert 15% of inter-regional freight to coastal shipping, yet domestic shipowner resistance has delayed full roll-out. Until the Metro Manila Subway becomes operational post-2028, the congestion premium on urban deliveries will persist[3]“Traffic and Congestion Statistics,” Metropolitan Manila Development Authority, mmda.gov.ph .
Typhoon-Induced Supply-Chain Disruptions
Typhoon Kristine in October 2024 caused USD 126.5 million in crop losses and halted 2GO sailings for three days, stranding 18,000 tons of perishables. With 20 cyclones on average each year, cargo insurance uptake below 15% leaves SMEs self-insured and vulnerable. Although larger carriers deploy weather-routing analytics that cut storm delays by 18%, 600-plus small vessel operators lack the capital for such tools. The absence of a national catastrophe pool shifts risk to retailers and farmers, eroding thin margins and prolonging recovery times[4]“Typhoon Kristine Damage Assessment,” National Disaster Risk Reduction and Management Council, ndrrmc.gov.ph.
*Our forecasts treat driver/restraint impacts as directional, not additive. The impact forecasts reflect baseline growth, mix effects, and variable interactions.
Segment Analysis
By End-User Industry: Retail Leads, Mining Surges
Wholesale and Retail Trade generated 30.91% of 2025 demand and grew at a 6.52% CAGR (2026-2031), lifted by modern grocery chains spreading into Visayas and Mindanao. Manufacturing follows, buoyed by a PMI above 53 since 2024 and USD 42 billion in electronics exports.
Oil, gas, and mining carry outsize logistics intensity, particularly nickel-ore lanes that require inbound reagents and spare parts. Construction demand remains stable, keyed to USD-indexed steel and cement inflows for 194 flagship projects. Agriculture freight will climb as cold-chain coverage lowers spoilage on high-value perishables.


By Logistics Function: CEP Gains Momentum
Courier, Express, and Parcel activity is expected to rise at 6.82% CAGR between 2026-2031, while Freight Transport still commanded a 63.27% Philippines freight and logistics market share in 2025. The Philippines freight and logistics market size for CEP will climb as integrated sortation-fulfillment models truncate delivery windows and bundle value-added services. Partnerships like Ninja Restock demonstrate that embedding logistics inside consumer-goods distribution compresses the delivery curve and raises parcel density. Non-temperature-controlled warehousing still hosts 91.59% of inventory, yet cold-chain nodes capture outsized capital because food spoilage and pharma compliance impose hard cost ceilings on service lapses. Digital freight platforms are steering customs brokerage and freight insurance toward single-click transactions, lowering administrative overheads and giving SMEs direct access to multicarrier networks.
Temperature-controlled warehousing capacity, while representing a modest 8.41% share, is expanding at 6.69% as the Department of Agriculture backs 99 new cold rooms and private investors add pallet positions in Navotas, Bulacan, and Cebu. The Philippines freight and logistics market size devoted to cold chain is therefore widening its share faster than ambient space, supported by pharmaceutical supply chains aligned under ASEAN regulations. Freight Forwarding volumes reflect the archipelago’s reliance on sea channels, but the fastest lane growth now flows through air as electronics and biologics shippers buy speed to protect value.
By CEP Destination: Cross-Border Parcels Accelerate
Domestic parcels held 64.98% of 2025 values, but international traffic is scaling faster at 7.07% CAGR between 2026-2031 as regional e-commerce sellers leverage four-hour flight radii to reach 60% of ASEAN consumers. The National Single Window condenses 14 clearances into a one-day digital process, trimming border dwell time and raising shipment visibility. Ninja Van’s Cabuyao automation center sorts half a million parcels daily, embedding customs clearance workflows to sustain same-day handoffs to airlines. For domestic flows, organized retail’s expansion in Visayas and Mindanao pushes CEP operators into provinces historically overlooked, creating greenfield capacity for high-growth lanes.
Mindanao’s growth trajectory exceeds the national average due to reverse-logistics loops tied to nickel-ore exports. Every ore ton exported requires inbound equipment and reagents, elevating parcel movements in mining districts. The Philippines freight and logistics industry, therefore, finds new revenue streams at the intersection of minerals and e-commerce, rewarding carriers that mesh bulk, parcel, and spare-parts flows on a unified network.
By Warehousing Temperature Control: Cold Chain Scales
Non-temperature-controlled facilities still host 91.59% of revenue in 2025, but the cold-chain segment is growing at 6.69% CAGR (2026-2031), nearly matching the overall 5.93% market CAGR (2026-2031) as retailers and manufacturers tighten quality requirements. The Philippines freight and logistics market size for temperature-controlled warehousing will climb in step with government and private investments.
Department of Agriculture funding lowered entry barriers for provincial stores, while private projects in Bulacan and Cebu added thousands of sub-zero pallet slots. ASEAN pharma harmonization lets a single compliant hub reach 10 economies, creating economies of scale and justifying premium rents. Ambient warehouses remain vital for fast-moving consumer goods, but cross-docking and micro-fulfillment layouts are emerging as e-commerce players chase two-day nationwide delivery.
By Freight Transport Mode: Air Narrows the Gap
Road freight still lifted 67.45% of 2025 revenue, yet air values are compounding at 7.55% CAGR (2026-2031), propelled by USD 42 billion in electronics exports and strict time-temperature profiles on biologics. FedEx’s 34,000-square-meter Clark ramp and UPS’s incoming facility will sharpen air-cargo service reliability, allowing shippers to bypass Manila’s saturation. Sea and inland waterways, at 25% of tonnage, remain critical for bulk and inter-island trades, although high tariff structures tied to limited vessel competition drag on modal shift. Pending cabotage reforms promise 10–15% rate relief if fully executed. Rail still accounts for under 1% of freight, but the Mindanao Railway’s 2028 debut will provide a land bridge across commodity corridors, introducing competition to coastal routes.
In the short term, road remains the backbone of the Philippines freight and logistics market, but the Build Better More highway grid is reshaping route economics, handing cost advantages to carriers able to stage inventory outside Metro Manila. The Philippines freight and logistics market share of air cargo is set to creep upward as customs digitalization trims dwell times, improving aircraft utilization and lowering per-kilo costs for shippers of semiconductors, perishables, and relief goods.
By Freight Forwarding Mode: Air Chases Sea
Sea forwarding retains a 58.20% revenue share in 2025, but air forwarding, advancing at 6.76% CAGR (2026-2031), edges closer as shippers of electronics and pharma pay four-fold rate premiums to guarantee 48-hour transit. FedEx and UPS expansions in Clark anchor capacity, while 2GO’s ship re-fleet raises roll-on/roll-off capacity 35%, tightening domestic competition. Pending foreign-flagged vessel access promises to shave coastal rates, yet union and owner lobbying has delayed rollout.
Rail and multimodal chains gain traction once the Mindanao line opens, delivering a land alternative that erodes the sea’s dominance on specific corridors. For now, the Philippines freight and logistics market relies on sea for heavy and bulk cargo, but air and multimodal solutions will skim higher-margin traffic.
Geography Analysis
Metro Manila and Calabarzon processed 70% of 2025 container traffic, but congestion-induced logistics costs plus limited developable land push operators to Clark, Laguna, and Subic. Clark’s tax-free zone and 24/7 runway attract air-cargo specialists, while Subic’s deepwater berths capture shippers willing to truck 120 kilometers to skip Manila port queues. The Build Better More corridors allocate the majority of road capex to Luzon, yet Mindanao wins share through the railway and strategic mining exports. Visayas leverages Cebu’s port-airport complex, and new cold stores in Consolacion help pharma distributors reach central islands with two-day service.
Inter-island shipping costs remain 30-40% above ASEAN norms due to limited foreign vessel competition, but targeted cabotage relaxation could trim tariffs by 15% if fully enacted. Temperature-controlled warehousing outside Metro Manila and Cebu sits below 12% of national capacity, yet 99 new cold rooms will redistribute space across Central Luzon, Ilocos, and Cagayan Valley. The New Manila International Airport will give shippers a multimodal platform with five-million-ton capability, slashing relay times and rebalancing traffic away from the port.
Mindanao’s freight flows will outpace the national rate as nickel exports and agro-industrial investments deepen, creating premium volume for trucking and air cargo. Typhoon corridors across Bicol and Eastern Visayas inject volatility into routing plans, sending carriers to secondary ports in dry months and driving investment in weather analytics.
Regulatory Landscape
The Philippines freight and logistics regulatory framework spans multiple agencies overseeing ports, aviation, toll roads, and land transport. Key bodies include the Philippine Ports Authority (port operations and policies), the Civil Aeronautics Board (air cargo and related economic regulation), the Toll Regulatory Board (expressway tolling), and the Land Transportation Franchising and Regulatory Board (franchising and regulation for public land transport), while the Department of Trade and Industry (DTI) runs an accreditation scheme for seafreight forwarders with service-standard and capitalization requirements.
In 2026, policy attention sharpened on trade-facilitation and port-cost transparency. A proposed Joint Administrative Order (JAO) being advanced by the Departments of Finance, Transportation, and Trade and Industry targets mandatory disclosure and justification of destination charges to improve pricing transparency and support congestion management, while global trade reform dialogue has also emphasized completing the National Single Window rollout and reviving the Unified Logistics Pass for cargo trucks to reduce administrative friction in domestic and cross-border movements. In parallel, DTI programs under Logistics Services Philippines (LSPH), including streamlining and automation initiatives, continue to push compliance simplification across trucking, warehousing (including cold storage), customs brokerage, domestic shipping, and freight forwarding.
Value Chain Analysis
The Philippines freight and logistics value chain begins with demand generation from wholesale and retail, manufacturing (notably electronics), agriculture, and mining, then flows through shipper and trader planning, freight forwarding and customs brokerage, line-haul by road/sea/air, and warehousing (ambient and temperature-controlled) into distribution, last-mile delivery, and reverse logistics. Core enabling nodes include ports, airports, expressways, and inter-island Ro-Ro links, with operational dependencies on container yards, empty-container returns, access roads, and cargo manifest and clearance processes that can add dwell time and cost.
Ongoing network rebalancing is pushing volume away from Manila-centric chokepoints toward regional gateways and upgraded inter-island links. Examples include the February 2025 groundbreaking of the PHP 16.93 billion New Cebu International Container Port in Tayud, Consolacion to address Cebu Base Port capacity constraints, and the July 2026 inauguration of the modernized Port of Benoni (with added Light Craft Landing Station and centralized Port Operations Building) to reduce delays on the Central Nautical Highway. Public-private and advisory-led modernization is also expanding the investable pipeline, such as the July 2026 selection of PwC as transaction advisor for the Poro Point Seaport Modernisation Project (San Fernando, La Union), alongside the Department of Transportation signing a contract under the USD 25 million Philippine Maritime, Transport, Logistics, and Connectivity Project to strengthen planning and connectivity execution across maritime and logistics corridors.
Competitive Landscape
The top five operators capture roughly 35-40% of 2025 revenues, making the Philippines freight and logistics market moderately fragmented. FedEx doubled its Clark footprint to 34,000 square meters, and UPS will open a new hub in late 2026 as part of a USD 250 million Asia-Pacific investment. Maersk’s PHP 4.8 billion (USD 82.83 million) Optimus Center in Calamba targets pharma and electronics, integrating WMS tech that cuts pick errors 35%.
Ayala Corporation’s PHP 1.5 billion (USD 25.88 million) exit from Air21 highlights last-mile density challenges beyond Metro Manila. Ninja Van’s B2B pivot with Universal Robina embeds fulfillment in FMCG distribution, squeezing traditional wholesalers.
Digital startups such as Locad raised USD 9 million in late 2024, scaling six fulfillment nodes that promise one-to-two-day nationwide delivery. White-space opportunities concentrate in Visayas and Mindanao cold chain, where capacity shortages run 25–30%. Compliance demands under ISO 9001 and new cabotage rules will accelerate consolidation among undercapitalized mid-tier forwarders.
Philippines Freight And Logistics Industry Leaders
SM Investments Corp. (including 2GO Group)
LBC Express Holdings, Inc.
DHL Group
Royal Cargo
DSV A/S (including DB Schenker)
- *Disclaimer: Major Players sorted in no particular order

Market Opportunities and Future Outlook
Opportunities center on reducing port and inland frictions through digitalization, congestion management, and regional gateway build-out, where regulatory and investment actions are already visible. The pending Joint Administrative Order (JAO) (eyeing signature by August 2026) targets standardized terminology and mandatory disclosure of destination charges, paired with congestion triggers such as a provisional 75% yard utilization threshold to activate decongestion measures. This creates whitespace for operators that can productize transparent surcharges, appointment-based trucking, yard and gate visibility, and integrated brokerage-forwarding offerings aligned to the National Single Window and related streamlining programs.
Capacity and service differentiation opportunities are also emerging around major gateway and hub investments and the shift toward lower-emission operations. ICTSI secured a USD 300 million Asian Infrastructure Investment Bank loan in May 2026 for terminal upgrades across Manila International Container Terminal, South Luzon Container Terminal, and Mindanao Container Terminal, supporting equipment modernization and throughput improvements that ripple into drayage, forwarding, and warehousing demand near these nodes. In air cargo, the announced 30-hectare integrated cargo and logistics ecosystem at Clark International Airport (July 2026, via Luzon International Premiere Airport Development Corp.) reinforces Clark as a high-value cargo alternative to Manila, favoring time-sensitive electronics and pharma flows and encouraging co-located cold chain, express sortation, and bonded handling capabilities. Public sector transport allocations, including the DOTr 2026 flagship project budget, further widen the execution pipeline for multimodal connectivity, supporting providers that invest in corridor-based networks across Luzon and into Visayas and Mindanao rather than concentrating solely in Metro Manila.
Recent Industry Developments
- July 2026: Luzon International Premiere Airport Development (LIPAD) Corp announced the design for a 30-hectare integrated cargo and logistics ecosystem at Clark International Airport. The planned cargo city strengthens Central Luzon as an international air freight and distribution node, supporting faster export-import flows and encouraging co-located forwarding, bonded handling, and cold-chain services.
- May 2026: International Container Terminal Services, Inc. (ICTSI) secured a USD 300 million loan from the Asian Infrastructure Investment Bank to fund terminal upgrades across Manila International Container Terminal, South Luzon Container Terminal, and Mindanao Container Terminal. The financing supports capacity and equipment modernization that can reduce port-side bottlenecks and lift productivity for trucking, forwarding, and warehouse networks linked to these gateways.
- February 2024: The Department of Agriculture allocated PHP 3 billion for 99 provincial cold stores to cut post-harvest losses and expand temperature-controlled coverage beyond major urban centers. The program lowers entry barriers for regional cold-chain buildouts and raises service requirements for food and pharma logistics providers serving provincial lanes.


Research Methodology Framework and Report Scope
Market Definition and Coverage
This market is defined as the revenue earned from moving, handling, and storing goods within the Philippines, and for import and export flows tied to the country, across key transport modes and logistics services. Revenue is counted at contractual rates, net of normal discounts.
Scope exclusions: Passenger transportation, purely captive in-house logistics activities, and standalone warehouse real estate rents are excluded from this sizing.
Segmentation Overview
- By End-User Industry
- Agriculture, Fishing, and Forestry
- Construction
- Manufacturing
- Oil and Gas, Mining, and Quarrying
- Wholesale and Retail Trade
- Others
- By Logistics Function
- Courier, Express, and Parcel (CEP)
- By Destination Type
- Domestic
- International
- By Destination Type
- Freight Forwarding
- By Mode of Transport
- Air
- Sea and Inland Waterways
- Others
- By Mode of Transport
- Freight Transport
- By Mode of Transport
- Air
- Pipelines
- Rail
- Road
- Sea and Inland Waterways
- By Mode of Transport
- Warehousing and Storage
- By Temperature Control
- Non-Temperature-Controlled
- Temperature-Controlled
- By Temperature Control
- Other Services
- Courier, Express, and Parcel (CEP)
Data Sources, Market Sizing, and Validation
Desk Research
Desk work starts with building a fact base for freight demand, trade intensity, and logistics capacity, and then translating those signals into service revenue pools for the Philippines. We refer to public sources such as the Philippine Statistics Authority for freight-related economic indicators, the Bangko Sentral ng Pilipinas for macro series and exchange-rate context, and the Department of Trade and Industry for industry direction and policy signals.
For trade and port related checks, we also use sources such as Bureau of Customs releases, Philippine Ports Authority updates, and airport and aviation statistics from official operators and regulators where available. Company annual reports, audited financial statements, and investor presentations are used to anchor service mix logic and typical margin and pricing movement (where it is disclosed). In addition, paid subscriptions supporting company financials and intelligence, news and financials, and an import and export shipment-level database are used selectively to cross-check volume direction and large-account exposure. These desk research sources are illustrative, and many other public references were used during data collection, validation, and clarification.
Primary Interviews and Surveys
Primary work is used to pressure test what desk signals cannot fully explain, especially the split between transport, forwarding, CEP, and warehousing revenue, and how pricing moves with fuel, congestion, and service level in the Philippines. We spoke with a mix of logistics service providers, freight intermediaries, shippers, and industry specialists across the Philippines so that assumptions on utilization, rates, and mix could be checked and corrected where needed.
Distribution of primary research fieldwork respondents
| Company type | Respondent position |
|---|---|
| Top tier: 38% | CXOs: 13% |
| Mid tier: 46% | Functional/Unit leaders: 32% |
| Smaller Players: 16% | Managers: 55% |
Market-Sizing & Forecasting
Our model is built using a top-down approach where national output and trade activity are translated into logistics service demand, and then converted into revenue using mode and service level pricing in the Philippines. Results are then corroborated with selective bottom-up approximations, such as roll-ups from a sampled set of provider revenues and channel checks on typical price per shipment, per ton, or per container, before totals are adjusted.
Inputs are chosen to match how freight actually moves in the Philippines, so we lean on indicators such as import and export values and volumes, port throughput and container handling activity, air cargo tonnage trends, road freight intensity tied to domestic consumption, and warehousing occupancy and build-out signals in key corridors. When the market is partially opaque, gaps are handled by using ranges from primary discussions, applying conservative penetration assumptions, and keeping the implied revenue per unit within realistic bounds.
For forecasting, scenario analysis is used so that changes in trade momentum, fuel and transport cost pass-through, infrastructure execution pace, and service mix shifts can be reflected without overfitting the data. The final outlook is shaped by expert consensus on how fast pricing normalizes and how quickly capacity additions translate into usable throughput.
Data Validation & Update Cycle
Validation is done by triangulating the model outputs against independent signals, such as trade direction, throughput trends, and disclosed revenue movement from listed and major private operators in the Philippines. Variance checks are run across years so sharp jumps are questioned, and assumptions are revisited until the movement can be explained by a clear demand or pricing driver.
Before sign-off, the work goes through multi-step analyst reviews, and respondents are re-contacted when a key assumption changes materially or a new data point creates a mismatch with earlier inputs. Reports are refreshed annually, with interim updates when major policy shifts, shocks to trade and fuel, or large capacity changes occur. Right before delivery, we complete a fresh data pass so the final numbers reflect the most current market context.
Mordor Intelligence's Philippines Freight and Logistics Market Size Compared With Other Published Estimates
Published market values for Philippines freight and logistics do not always match because groups make different choices on what revenue streams count, which price basis is used, and whether domestic handling is separated from international forwarding. Timing also matters, since base year selection and currency conversion windows can shift the same demand picture into different USD totals.
By tracking service revenues at contractual prices net of normal discounts and excluding captive in-house operations, Mordor Intelligence lands at a lower 2025 total than estimates that fold in broader logistics-adjacent income or treat warehousing more like a real estate pool. Differences are also created when one model leans heavily on a long-horizon growth scenario, while another keeps short-cycle checks like throughput and shipment direction more tightly linked to the revenue build.
Benchmark comparison
| Source | Market Size | Gaps in Research Methodology |
|---|---|---|
| Mordor Intelligence | USD 15.26 B (2025) | |
| Industry Publisher A | USD 20.71 B (2025) | Uses a broader revenue perimeter across logistics functions and end uses, and may capture adjacent service income where boundaries between transport, handling, and facility monetization are not kept separate. |
| Industry Publisher B | USD 19.10 B (2025) | Includes a wider set of freight transport modes and may apply different rate progressions and currency timing, which can lift the USD total even when underlying volume trends are similar. |
The comparison shows that the spread is mostly explained by scope and pricing basis, rather than one single demand indicator. When the revenue pool is tied back to clear activity drivers like trade movement, throughput, and service pricing, the final number becomes easier to replicate and monitor year after year, which is what we aim for in this study.


Key Questions Answered in the Report
What is the 2026 value of the Philippines freight and logistics market?
The Philippines freight and logistics market size is USD 16.20 billion in 2026.
How fast will the sector grow through 2031?
The market is forecast to post a 5.93% CAGR (2026-2031), reaching USD 21.60 billion by 2031.
Which logistics function shows the highest growth?
Courier, Express, and Parcel services lead with a 6.82% CAGR between 2026-2031.
Why are cold-chain facilities attracting investment?
Government grants and rising food and pharma flows are pushing temperature-controlled warehousing to a 6.69% CAGR (2026-2031).
How will cabotage reform affect inter-island shipping costs?
Full implementation could lower domestic sea freight tariffs by 10–15% by expanding foreign vessel access.
Which region is emerging as an air-cargo hub?
Clark Freeport is hosting expanded FedEx and UPS facilities, positioning Central Luzon as the country’s primary international air-cargo gateway.
Page last updated on:


 Your data is secure and never sold or shared.


