Market Overview
| Study Period | 2017 - 2030 |
|---|---|
| Base Year For Estimation | 2024 |
| Forecast Data Period | 2025 - 2030 |
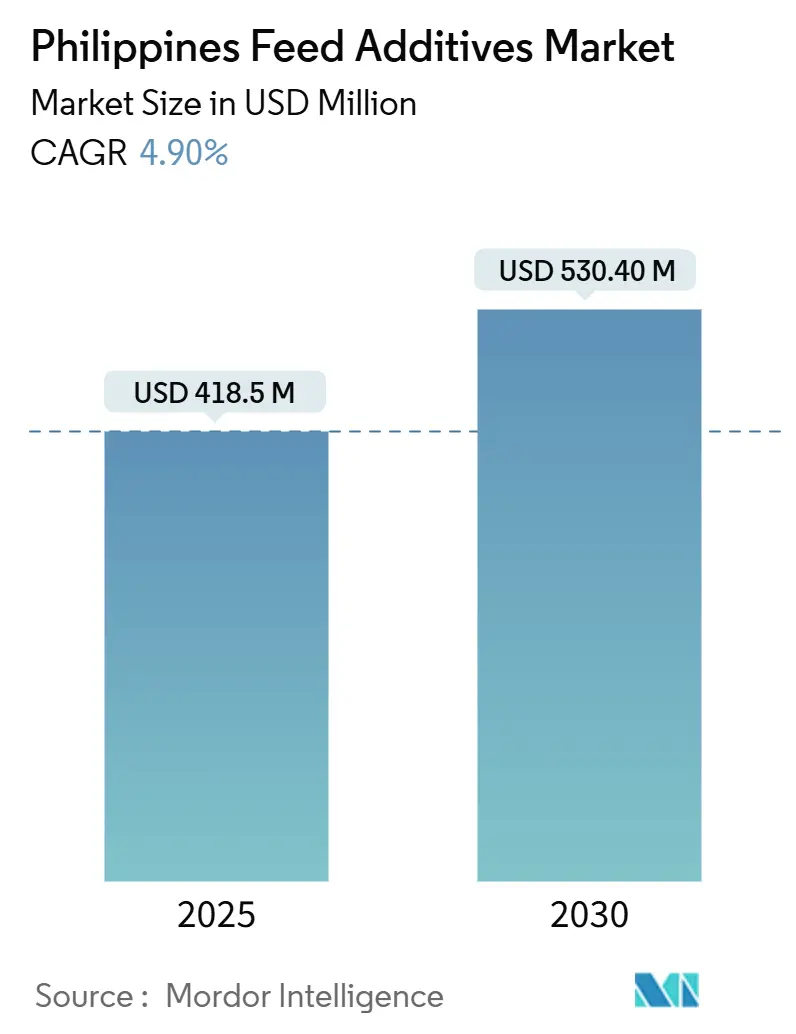
| Market Size (2025) | USD 418.5 Million |
| Market Size (2030) | USD 530.40 Million |
| Growth Rate (2025 - 2030) | 4.90% CAGR |
| Market Concentration | Low |
Major Players *Disclaimer: Major Players sorted in no particular order Image © Mordor Intelligence. Reuse requires attribution under CC BY 4.0. | |
Philippines Feed Additives Market Analysis by Mordor Intelligence
The Philippines' feed additives market size reached USD 418.5 million in 2025 and is projected to climb to USD 530.4 million by 2030, reflecting a 4.9% CAGR over the forecast period. Consistent growth is underpinned by Department of Agriculture incentives that reimburse farms for feed-conversion upgrades and enzyme use. The rebound of commercial swine herds following African Swine Fever, together with 3-5% annual rises in per-capita poultry demand, sustains high-volume consumption of amino acids and vitamins[1]Source: Office of Agricultural Affairs, “Poultry and Products Annual,” fas.usda.gov. Export-oriented shrimp producers are adopting functional probiotics to satisfy stringent European Union residue limits, adding another pull factor for value-added solutions. Meanwhile, fresh cold-storage capacity coming online in Central Luzon and Mindanao lowers spoilage risk and supports temperature-sensitive liquid enzymes, helping specialized suppliers expand beyond Metro Manila.
Key Report Takeaways
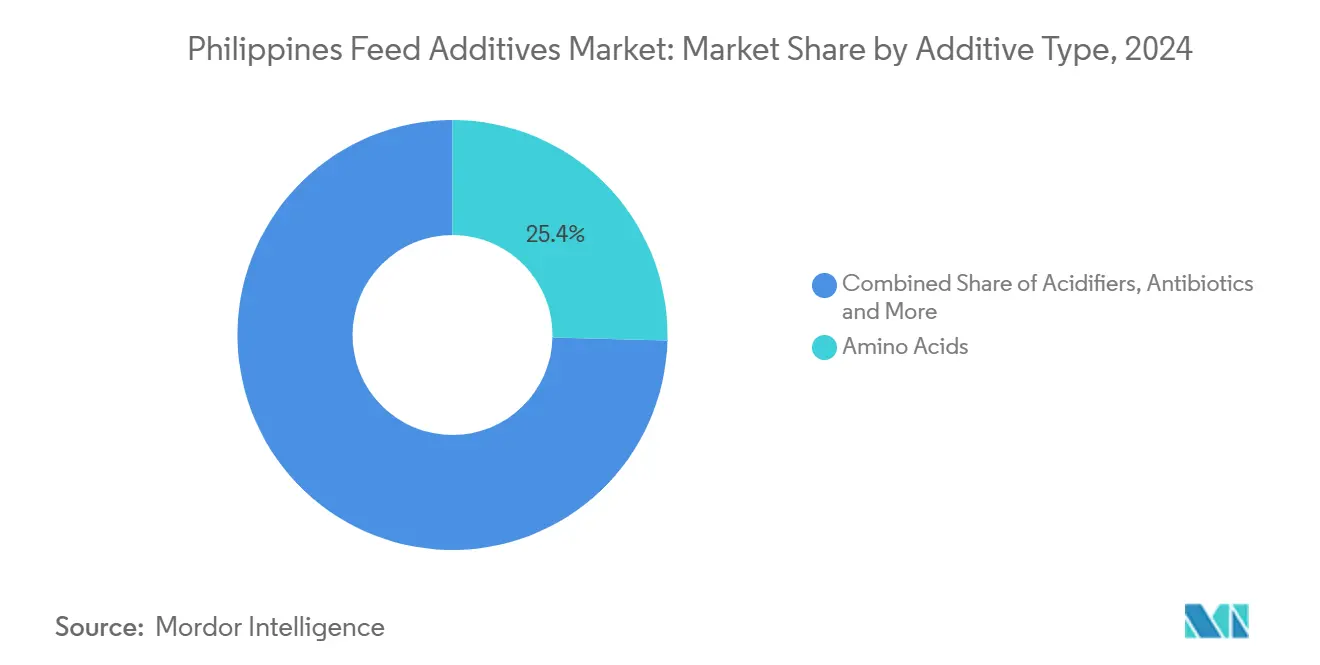
- By additive, amino acids led with a 25.4% share of the Philippines feed additives market size in 2024, while pigments are projected to post a 5.5% CAGR through 2030.
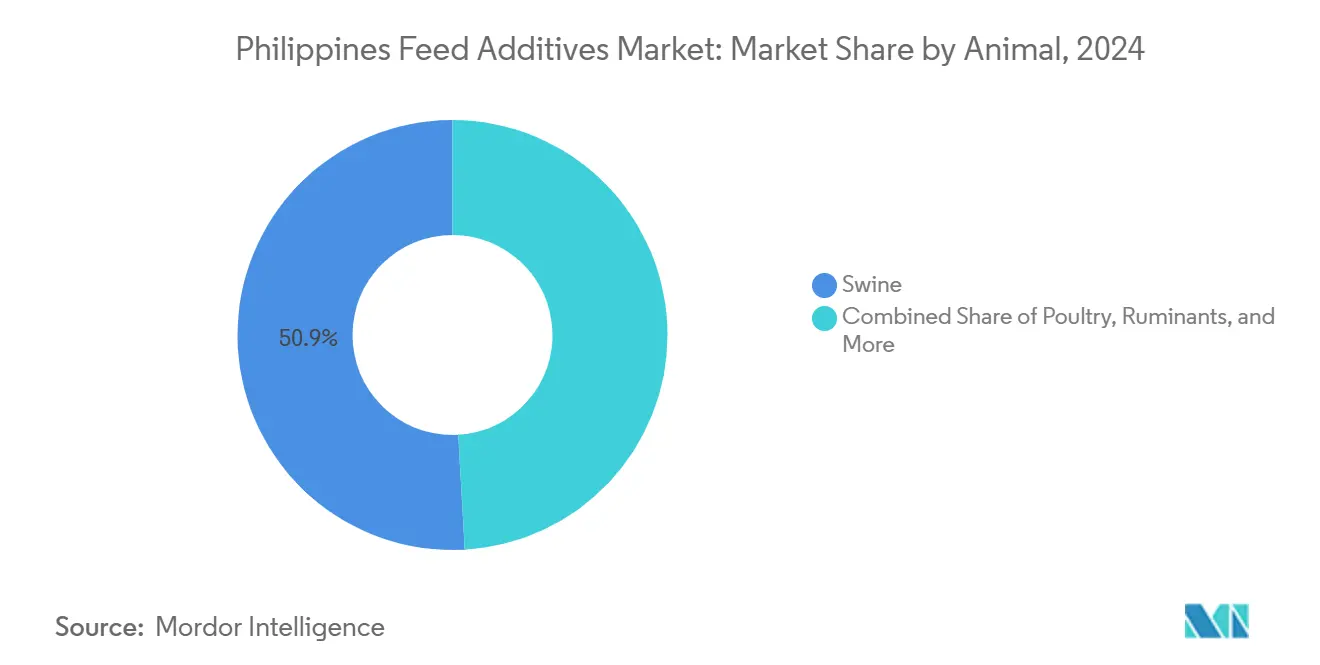
- By animal, swine accounted for 50.9% of the Philippines' feed additives market size in 2024, and poultry is advancing at a 6.4% CAGR through 2030.
Philippines Feed Additives Market Trends and Insights
Drivers Impact Analysis
| Driver | (~) % Impact on CAGR Forecast | Geographic Relevance | Impact Timeline |
|---|---|---|---|
| Government incentives to raise feed-conversion efficiency | +0.80% | Luzon and Mindanao | Medium term (2–4 years) |
| Surging meat consumption and switch to compound feed | +1.20% | Urban centers nationwide | Long term (≥ 4 years) |
| Bio-security upgrades after ASF and avian-flu outbreaks | +0.90% | Central Luzon and Calabarzon | Short term (≤ 2 years) |
| Export-oriented shrimp sector demanding functional additives | +0.60% | Coastal Mindanao and Palawan | Medium term (2–4 years) |
| Emergence of antibiotic-free premium poultry brands | +0.40% | Metro Manila and key cities | Long term (≥ 4 years) |
| Digital B2B platforms shortening additive supply chains | +0.30% | National | Short term (≤ 2 years) |
| Source: Mordor Intelligence | |||
Understand The Key Trends Shaping This Market
Download PDF
Government incentives to raise feed-conversion efficiency
The Department of Agriculture earmarked PHP 300 million (USD 5.5 million) for livestock modernization, reimbursing backyard producers who adopt enzyme-enriched compound feeds[2]Source: Philippine News Agency, “2 cold storage depots to be built to cut post-harvest losses,” pna.gov.ph. Co-financing from a USD 24.9 million World Bank program channels additional capital toward bio-security, elevating demand for acidifiers, binders, and probiotics. Mandatory Bureau of Animal Industry registration ensures compliant suppliers gain early access to voucher-funded demand, strengthening the Philippines' feed additives market pipeline. The institutional push links farm profitability to feed-conversion metrics, signaling multi-year potential for performance additives.
Surging meat consumption and switch to compound feed
Philippine poultry intake is forecast to hit 2.11 million metric tons in 2025, expanding faster than population growth and spurring compound-feed uptake. San Miguel Foods lifted cassava purchases 44% to 90,000 metric tons in H1 2024, underlining integrator moves toward alternative carbohydrates that still require amino-acid supplementation. Each percentage-point rise in compound-feed market share boosts the Philippines' feed additives market by a proportional margin, embedding an organic growth loop.
Bio-security upgrades after ASF and avian-flu outbreaks
HPAI outbreaks across 53 municipalities prompted facilities to overhaul hygiene protocols that prioritize gut health additives. Bounty Fresh became the first domestic producer to secure Raised Without Antibiotics status, proving enzyme and probiotic packages can sustain performance while meeting new retail claims. ASF recovery in swine runs parallel, driving acidifier and mycotoxin binder demand. These health events transform once-temporary purchases into routine line‐items across the Philippines feed additives market.
Export-oriented shrimp sector demanding functional additives
EU residue caps push shrimp growers to substitute traditional antibiotic regimes with certified probiotics and enzyme blends that raise feed efficiency and flesh quality. Cold-chain upgrades, such as AyalaLand Logistics’ 4,000-pallet Artico Mabalacat site, ensure temperature-sensitive biosolutions arrive potent in Mindanao grow-out ponds. The export premium encourages farms to pay for high-margin additives, adding value layers to the Philippines' feed additives market.
Restraints Impact Analysis
| Restraint | (~) % Impact on CAGR Forecast | Geographic Relevance | Impact Timeline |
|---|---|---|---|
| Peso volatility inflating imported vitamin and amino-acid costs | -0.7% | Import-dependent regions | Short term (≤ 2 years) |
| Stricter caps on in-feed antibiotic usage | -0.5% | National | Medium term (2–4 years) |
| Cold-chain gaps limiting liquid enzyme and probiotic adoption | -0.4% | Rural islands | Long term (≥ 4 years) |
| Distributor concentration driving up farm-gate additive prices | -0.3% | Remote provinces | Medium term (2–4 years) |
| Source: Mordor Intelligence | |||
Peso volatility inflating imported vitamin and amino-acid costs
Peso swings against the U.S. dollar raise landed prices for methionine, lysine, and vitamin E, prompting feed mills to down-speculate formulations during troughs. Commercial feed bags sold for PHP 1,490–1,675, versus cooperative equivalents at PHP 1,380–1,430, illustrate squeeze points that can slow premium additive uptake. Exchange rate sensitivity creates cyclical demand patterns for imported additives, as producers adjust formulations based on cost-benefit calculations that favor locally sourced alternatives during peso weakness periods.
Stricter caps on in-feed antibiotic usage
New Bureau of Animal Industry rules curtail routine antibiotic inclusion, forcing reformulation trials with essential oils, enzymes, and acidifiers[3]Source: Bureau of Animal Industry, “Livestock and Poultry Feeds Regulations,” bai.da.gov.ph. This regulatory transition creates short-term market disruption as producers evaluate enzyme, probiotic, and acidifier combinations to replace traditional antibiotic protocols. University of the Philippines Los Baños research demonstrates active evaluation of essential oils, probiotics, and enzyme blends as antibiotic alternatives, indicating institutional support for transition strategies. Compliance costs and performance-validation timelines create short-term uncertainty for nutritionists, delaying broad substitution in the Philippines feed additives market, while the long-term opportunity remains positive.
Segment Analysis
By Additive: Functional solutions outpace commodity products
Amino acids held the largest slice of the Philippines' feed additives market at 25.4% in 2024, reflecting high import dependency for methionine and lysine used in commercial broiler and nursery-pig rations. Vitamins occupy the next tier, aided by mandatory fortification requirements that counter oxidative stress in tropical barns. Enzymes have moved firmly into the mainstream as DSM-Firmenich and local integrators apply carbohydrase and phytase combinations to unlock cassava and rice-bran energy, safeguarding margins amid grain volatility. Probiotics and prebiotics gain momentum, catalyzed by Bounty Fresh’s antibiotic-free milestone that highlights commercial viability.
Pigments, though niche, represent the fastest expansion at a 5.5% CAGR as export egg producers and shrimp processors use color to command price premiums overseas. Acidifiers and antioxidants benefit from the same bio-security upgrades, lifting gut-health additives. Antibiotics now trend downward under tighter regulation, while phytogenic replacements such as oregano oil see incremental uptake. Binders, flavors, and yeast cultures cluster in targeted applications, with Alltech’s Yea-Sacc line leveraging tropical-climate data to defend its turf.
Note: Segment shares of all individual segments available upon report purchase
Get Detailed Market Forecasts at the Most Granular Levels
Download PDF
By Animal: Swine scale, poultry momentum
Swine accounted for 50.9% of the Philippines' feed additives market size in 2024, supported by a post-ASF rebuild that embeds higher bio-security norms. Intensive confinement drives sustained inclusion of mycotoxin binders, acidifiers, and amino acids. Poultry is on a steeper path, expanding at a 6.4% CAGR as household incomes fuel broiler and layer protein demand. Enzyme and probiotic packages show particularly quick traction in antibiotic-free brands now hitting urban grocery shelves.
Aquaculture holds a modest but strategic share, with export shrimp operations demanding probiotic and enzyme blends that achieve European tolerance thresholds. Ruminant demand remains subdued, given the dominance of smallholder systems that favor salt and mineral blocks over sophisticated premixes. However, government feed-credit programs could ease entry barriers and lift ruminant uptake in the out-years.
Note: Segment shares of all individual segments available upon report purchase
Get Detailed Market Forecasts at the Most Granular Levels
Download PDF
Geography Analysis
Luzon commands the lion’s share of the Philippines' feed additives market owing to dense feed-mill clusters in Central Luzon and Calabarzon. Cargill’s USD 12 million premix plant outside Bulacan anchors a network of integrators that source enzymes, vitamins, and yeast locally. Metro Manila, the principal import gateway, funnels containerized lysine and vitamin blends through the Port of Manila, ensuring steady pipeline flow to inland mills.
Mindanao represents the fastest-growing regional node, driven by export-oriented shrimp ponds and a resurgence in commercial swine barns. Cold-storage capacity worth PHP 800 million (USD 14.5 million) commissioned since 2024 improves enzyme viability in Davao and General Santos, enabling distributors to push liquid biosolutions deeper into the south PNA.GOV.PH.
Visayas remains smaller yet strategic, acting as an inter-island staging point. BFAR reports 25–40% fish spoilage tied to a limited cold chain, a gap that restricts liquid probiotic uptake in far-flung islands. Ongoing rollouts of modular reefer hubs—such as Glacier Megafridge’s PHP 50 million (USD 0.9 million) Calbayog depot—signal gradual infrastructure catch-up that will broaden market access.
Competitive Landscape
The Philippines' feed additives market is fragmented. Alltech leads, leveraging yeast cultures and a technical sales force embedded in integrator feed mills. Archer Daniels Midland places second by cross-selling premix solutions through its grain merchandising channels. DSM-Firmenich AG ranks third, relying on co-development agreements with poultry integrators to customize enzyme stacks.
Strategic emphasis falls on local technical partnerships over sheer volume. Cargill’s USD 12 million premix facility exemplifies localized production that circumvents peso volatility while meeting BAI compliance. Novonesis’s EUR 1.5 billion (USD 1.6 billion) acquisition of DSM-Firmenich’s share in the Feed Enzyme Alliance consolidates enzyme supply, giving Philippine distributors improved continuity.
Emerging disruptors like Cell Biotech enter through digital channels, bundling human and animal probiotics to gain network effects among younger farm operators. BAI registration acts as a gatekeeper, so incumbents wield an onboarding advantage that offsets limited scale economies.
Philippines Feed Additives Industry Leaders
Alltech, Inc.
Archer Daniel Midland Co.
Cargill Inc.
IFF(Danisco Animal Nutrition)
DSM-Firmenich AG
- *Disclaimer: Major Players sorted in no particular order

Need More Details on Market Players and Competitors?
Download PDF
Recent Industry Developments
- February 2025: Novonesis bought DSM-Firmenich’s Feed Enzyme Alliance stake for EUR 1.5 billion (USD 1.6 billion), consolidating regional enzyme supply.
- January 2024: Novozymes and Chr. Hansen merged to form Novonesis, creating a EUR 3.7 billion (USD 4.0 billion) biosolutions platform.
- December 2022: Adisseo Group had agreed to acquire Nor-Feed and its subsidiaries to develop and register botanical additives for use in animal feed.
- June 2022: Delacon and Cargill collaborated to establish a global plant-based phytogenic feed additives business for enhanced animal nutrition. The partnership has helped in extensive feed additives expertise as well as an increase in the global presence.
Philippines Feed Additives Market Report Scope
Acidifiers, Amino Acids, Antibiotics, Antioxidants, Binders, Enzymes, Flavors & Sweeteners, Minerals, Mycotoxin Detoxifiers, Phytogenics, Pigments, Prebiotics, Probiotics, Vitamins, Yeast are covered as segments by Additive. Aquaculture, Poultry, Ruminants, Swine are covered as segments by Animal.By Additive
| Acidifiers | By Sub Additive | Fumaric Acid |
| Lactic Acid | ||
| Propionic Acid | ||
| Other Acidifiers | ||
| Amino Acids | By Sub Additive | Lysine |
| Methionine | ||
| Threonine | ||
| Tryptophan | ||
| Other Amino Acids | ||
| Antibiotics | By Sub Additive | Bacitracin |
| Penicillins | ||
| Tetracyclines | ||
| Tylosin | ||
| Other Antibiotics | ||
| Antioxidants | By Sub Additive | Butylated Hydroxyanisole (BHA) |
| Butylated Hydroxytoluene (BHT) | ||
| Citric Acid | ||
| Ethoxyquin | ||
| Propyl Gallate | ||
| Tocopherols | ||
| Other Antioxidants | ||
| Binders | By Sub Additive | Natural Binders |
| Synthetic Binders | ||
| Enzymes | By Sub Additive | Carbohydrases |
| Phytases | ||
| Other Enzymes | ||
| Flavors and Sweeteners | By Sub Additive | Flavors |
| Sweeteners | ||
| Minerals | By Sub Additive | Macrominerals |
| Microminerals | ||
| Mycotoxin Detoxifiers | By Sub Additive | Binders |
| Biotransformers | ||
| Other Mycotoxin Detoxifiers | ||
| Phytogenics | By Sub Additive | Essential Oil |
| Herbs and Spices | ||
| Other Phytogenics | ||
| Pigments | By Sub Additive | Carotenoids |
| Curcumin and Spirulina | ||
| Prebiotics | By Sub Additive | Fructo-Oligosaccharides |
| Galacto-Oligosaccharides | ||
| Inulin | ||
| Lactulose | ||
| Mannan-Oligosaccharides | ||
| Xylo-Oligosaccharides | ||
| Other Prebiotics | ||
| Probiotics | By Sub Additive | Bifidobacteria |
| Enterococcus | ||
| Lactobacilli | ||
| Pediococcus | ||
| Streptococcus | ||
| Other Probiotics | ||
| Vitamins | By Sub Additive | Vitamin A |
| Vitamin B | ||
| Vitamin C | ||
| Vitamin E | ||
| Other Vitamins | ||
| Yeast | By Sub Additive | Live Yeast |
| Selenium Yeast | ||
| Spent Yeast | ||
| Torula Dried Yeast | ||
| Whey Yeast | ||
| Yeast Derivatives |
By Animal
| Aquaculture | By Sub Animal | Fish |
| Shrimp | ||
| Other Aquaculture Species | ||
| Poultry | By Sub Animal | Broiler |
| Layer | ||
| Other Poultry Birds | ||
| Ruminants | By Sub Animal | Beef Cattle |
| Dairy Cattle | ||
| Other Ruminants | ||
| Swine | ||
| Other Animals |
| By Additive | Acidifiers | By Sub Additive | Fumaric Acid |
| Lactic Acid | |||
| Propionic Acid | |||
| Other Acidifiers | |||
| Amino Acids | By Sub Additive | Lysine | |
| Methionine | |||
| Threonine | |||
| Tryptophan | |||
| Other Amino Acids | |||
| Antibiotics | By Sub Additive | Bacitracin | |
| Penicillins | |||
| Tetracyclines | |||
| Tylosin | |||
| Other Antibiotics | |||
| Antioxidants | By Sub Additive | Butylated Hydroxyanisole (BHA) | |
| Butylated Hydroxytoluene (BHT) | |||
| Citric Acid | |||
| Ethoxyquin | |||
| Propyl Gallate | |||
| Tocopherols | |||
| Other Antioxidants | |||
| Binders | By Sub Additive | Natural Binders | |
| Synthetic Binders | |||
| Enzymes | By Sub Additive | Carbohydrases | |
| Phytases | |||
| Other Enzymes | |||
| Flavors and Sweeteners | By Sub Additive | Flavors | |
| Sweeteners | |||
| Minerals | By Sub Additive | Macrominerals | |
| Microminerals | |||
| Mycotoxin Detoxifiers | By Sub Additive | Binders | |
| Biotransformers | |||
| Other Mycotoxin Detoxifiers | |||
| Phytogenics | By Sub Additive | Essential Oil | |
| Herbs and Spices | |||
| Other Phytogenics | |||
| Pigments | By Sub Additive | Carotenoids | |
| Curcumin and Spirulina | |||
| Prebiotics | By Sub Additive | Fructo-Oligosaccharides | |
| Galacto-Oligosaccharides | |||
| Inulin | |||
| Lactulose | |||
| Mannan-Oligosaccharides | |||
| Xylo-Oligosaccharides | |||
| Other Prebiotics | |||
| Probiotics | By Sub Additive | Bifidobacteria | |
| Enterococcus | |||
| Lactobacilli | |||
| Pediococcus | |||
| Streptococcus | |||
| Other Probiotics | |||
| Vitamins | By Sub Additive | Vitamin A | |
| Vitamin B | |||
| Vitamin C | |||
| Vitamin E | |||
| Other Vitamins | |||
| Yeast | By Sub Additive | Live Yeast | |
| Selenium Yeast | |||
| Spent Yeast | |||
| Torula Dried Yeast | |||
| Whey Yeast | |||
| Yeast Derivatives | |||
| By Animal | Aquaculture | By Sub Animal | Fish |
| Shrimp | |||
| Other Aquaculture Species | |||
| Poultry | By Sub Animal | Broiler | |
| Layer | |||
| Other Poultry Birds | |||
| Ruminants | By Sub Animal | Beef Cattle | |
| Dairy Cattle | |||
| Other Ruminants | |||
| Swine | |||
| Other Animals | |||
Need A Different Region or Segment?
Customize Now
Market Definition
- FUNCTIONS - For the study, feed additives are considered to be commercially manufactured products that are used to enhance characteristics such as weight gain, feed conversion ratio, and feed intake when fed in appropriate proportions.
- RESELLERS - Companies engaged in reselling feed additives without value addition have been excluded from the market scope, to avoid double counting.
- END CONSUMERS - Compound feed manufacturers are considered to be end-consumers in the market studied. The scope excludes farmers buying feed additives to be used directly as supplements or premixes.
- INTERNAL COMPANY CONSUMPTION - Companies engaged in the production of compound feed as well as the manufacturing of feed additives are part of the study. However, while estimating the market sizes, the internal consumption of feed additives by such companies has been excluded.
| Keyword | Definition |
|---|---|
| Feed additives | Feed additives are products used in animal nutrition for purposes of improving the quality of feed and the quality of food from animal origin, or to improve the animals’ performance and health. |
| Probiotics | Probiotics are microorganisms introduced into the body for their beneficial qualities. (It maintains or restores beneficial bacteria to the gut). |
| Antibiotics | Antibiotic is a drug that is specifically used to inhibit the growth of bacteria. |
| Prebiotics | A non-digestible food ingredient that promotes the growth of beneficial microorganisms in the intestines. |
| Antioxidants | Antioxidants are compounds that inhibit oxidation, a chemical reaction that produces free radicals. |
| Phytogenics | Phytogenics are a group of natural and non-antibiotic growth promoters derived from herbs, spices, essential oils, and oleoresins. |
| Vitamins | Vitamins are organic compounds, which are required for normal growth and maintenance of the body. |
| Metabolism | A chemical process that occurs within a living organism in order to maintain life. |
| Amino acids | Amino acids are the building blocks of proteins and play an important role in metabolic pathways. |
| Enzymes | Enzyme is a substance that acts as a catalyst to bring about a specific biochemical reaction. |
| Anti-microbial resistance | The ability of a microorganism to resist the effects of an antimicrobial agent. |
| Anti-microbial | Destroying or inhibiting the growth of microorganisms. |
| Osmotic balance | It is a process of maintaining salt and water balance across membranes within the body's fluids. |
| Bacteriocin | Bacteriocins are the toxins produced by bacteria to inhibit the growth of similar or closely related bacterial strains. |
| Biohydrogenation | It is a process that occurs in the rumen of an animal in which bacteria convert unsaturated fatty acids (USFA) to saturated fatty acids (SFA). |
| Oxidative rancidity | It is a reaction of fatty acids with oxygen, which generally causes unpleasant odors in animals. To prevent these, antioxidants were added. |
| Mycotoxicosis | Any condition or disease caused by fungal toxins, mainly due to contamination of animal feed with mycotoxins. |
| Mycotoxins | Mycotoxins are toxin compounds that are naturally produced by certain types of molds (fungi). |
| Feed Probiotics | Microbial feed supplements positively affect gastrointestinal microbial balance. |
| Probiotic yeast | Feed yeast (single-cell fungi) and other fungi used as probiotics. |
| Feed enzymes | They are used to supplement digestive enzymes in an animal’s stomach to break down food. Enzymes also ensure that meat and egg production is improved. |
| Mycotoxin detoxifiers | They are used to prevent fungal growth and to stop any harmful mold from being absorbed in the gut and blood. |
| Feed antibiotics | They are used both for the prevention and treatment of diseases but also for rapid growth and development. |
| Feed antioxidants | They are used to protect the deterioration of other feed nutrients in the feed such as fats, vitamins, pigments, and flavoring agents, thus providing nutrient security to the animals. |
| Feed phytogenics | Phytogenics are natural substances, added to livestock feed to promote growth, aid in digestion, and act as anti-microbial agents. |
| Feed vitamins | They are used to maintain the normal physiological function and normal growth and development of animals. |
| Feed flavors and sweetners | These flavors and sweeteners help to mask tastes and odors during changes in additives or medications and make them ideal for animal diets undergoing transition. |
| Feed acidifiers | Animal feed acidifiers are organic acids incorporated into the feed for nutritional or preservative purposes. Acidifiers enhance congestion and microbiological balance in the alimentary and digestive tracts of livestock. |
| Feed minerals | Feed minerals play an important role in the regular dietary requirements of animal feed. |
| Feed binders | Feed binders are the binding agents used in the manufacture of safe animal feed products. It enhances the taste of food and prolongs the storage period of the feed. |
| Key Terms | Abbreviation |
| LSDV | Lumpy Skin Disease Virus |
| ASF | African Swine Fever |
| GPA | Growth Promoter Antibiotics |
| NSP | Non-Starch Polysaccharides |
| PUFA | Polyunsaturated Fatty Acid |
| Afs | Aflatoxins |
| AGP | Antibiotic Growth Promoters |
| FAO | The Food And Agriculture Organization of the United Nations |
| USDA | The United States Department of Agriculture |
Need More Details on Market Definition?
Ask a Question
Research Methodology
Mordor Intelligence follows a four-step methodology in all our reports.
- Step-1: IDENTIFY KEY VARIABLES: In order to build a robust forecasting methodology, the variables and factors identified in Step-1 are tested against available historical market numbers. Through an iterative process, the variables required for market forecast are set and the model is built on the basis of these variables.
- Step-2: Build a Market Model: Market-size estimations for the forecast years are in nominal terms. Inflation is not a part of the pricing, and the average selling price (ASP) is kept constant throughout the forecast period.
- Step-3: Validate and Finalize: In this important step, all market numbers, variables and analyst calls are validated through an extensive network of primary research experts from the market studied. The respondents are selected across levels and functions to generate a holistic picture of the market studied.
- Step-4: Research Outputs: Syndicated Reports, Custom Consulting Assignments, Databases & Subscription Platforms

Get More Details On Research Methodology
Download PDF


