| Study Period | 2018 - 2030 |
| Base Year For Estimation | 2024 |
| Forecast Data Period | 2025 - 2030 |
| Market Volume (2025) | 0.56 Thousand MW |
| Market Volume (2030) | 1.3 Thousand MW |
| CAGR | 18.10 % |
| Market Concentration | Medium |
Major Players*Disclaimer: Major Players sorted in no particular order |

Philippines Data Center Market Analysis
The Philippines Data Center Market size is estimated at 0.56 thousand MW in 2025, and is expected to reach 1.3 thousand MW by 2030, growing at a CAGR of 18.10%. Further, the market is expected to generate colocation revenue of USD 392 Million in 2025 and is projected to reach USD 1,162 Million by 2030, growing at a CAGR of 24.27% during the forecast period (2025-2030).
The Philippines data center market is experiencing rapid transformation driven by increasing digital adoption across industries. The gaming and entertainment sector has emerged as a significant catalyst, with over 95% of the population actively engaging in gaming activities, making the Philippines one of the countries with the highest number of gamers globally. This digital engagement has led to substantial investments in data center infrastructure, with major operators focusing on developing facilities that can handle high-performance computing requirements. The convergence of gaming, streaming, and digital entertainment has created a robust ecosystem that demands sophisticated data center capabilities.
Enterprise cloud adoption has become a cornerstone of digital transformation in the Philippines, with approximately 88% of companies now utilizing cloud data center solutions. This shift has prompted data center operators to enhance their infrastructure to support hybrid and multi-cloud environments. The market is witnessing a significant trend toward automation and operational efficiency, with projections indicating that around 61% of work processes will be automated by 2029. This automation drive has led to increased investment in smart data center technologies, including AI-driven operations and predictive maintenance systems.
The market is undergoing substantial infrastructure modernization with several strategic developments. A notable example is the joint venture between Globe Telecom, ST Telemedia, and Ayala Corporation, which aims to strengthen data center capabilities in the region. The submarine cable infrastructure is also expanding, with 11 new cables expected to be operational by 2026, enhancing international connectivity and data transfer capabilities. These developments are complemented by improving rack space utilization, which is projected to reach 79% by 2029, indicating efficient resource management and growing demand.
The data center industry is witnessing a shift toward higher-tier data center facilities, with operators increasingly focusing on Tier 3 and Tier 4 certifications. This trend is exemplified by ePLDT's announcement of its eleventh data center in Santa Rosa, designed to meet Tier 4 standards and operate using renewable energy. The market is also seeing increased emphasis on sustainability initiatives, with operators implementing energy-efficient technologies and exploring renewable energy sources. This focus on sustainable operations is becoming a key differentiator as enterprises increasingly prioritize environmental considerations in their data center selection criteria.
Philippines Data Center Market Trends
Philippines consumers spends 10hr/day on smartphone, generating huge amount of data transfer daily, this would drive data center market
- The Philippines had around 101 million smartphone users in 2022, which is expected to reach 181 million by 2029 at a CAGR of 8.79%.
- Post-pandemic, the demand for smartphones has significantly increased as they turned out to be useful for browsing, financial transactions, online shopping, and others. People are adopting urban lifestyles and use these gadgets for automation functions in their homes, online gaming, streaming content, browsing news, and online shopping. The convenience of doing almost everything instantly has increased the number of users and is expected to increase with the increasing population.
- The Philippines is the only country in the world where users, on average, spend an average of 10 hours a day on the phone. As the telecom network developed and improved its facilities, users could attain good mobile data speeds on their smartphones which increased their functionality and experience. Online games on mobile have improved their quality, and the events organized by them have furthermore increased the demand for smartphones. As phones with higher processors, better displays, and batteries are available at a budget price. 74% of the users prefer mobile gaming over PC and console gaming.

Understand The Key Trends Shaping This Market
Download PDF
Expansion of 5G network by mobile operators such as DITO, Globe, and Smart boost the data center market
- Consumers in the Philippines currently use 4G and 3G services in greater proportion. 5G network services were launched at the end of 2021 and were increasingly adopted by customers in the first quarter of 2022.
- Facilities offering 5G services in the Philippines are DITO, Globe, and Smart. These companies are expanding their bases to strengthen their network connectivity.
- For instance, Smart increased the count of its 5G substations to 7300 in 2022 to strengthen its 5G networks.

OTHER KEY INDUSTRY TRENDS COVERED IN THE REPORT
- Increased data consumption on online platform drives the market demand
- Increasing fiber connectivity by player such as Globe, Converge ICT, Dito, and Infinivan to deepen the internal fiber conenections leads to increase in market demand
- Increasing FTTH users and fiber network is boosting the data speed leading to demand for data center
Segment Analysis: Data Center Size
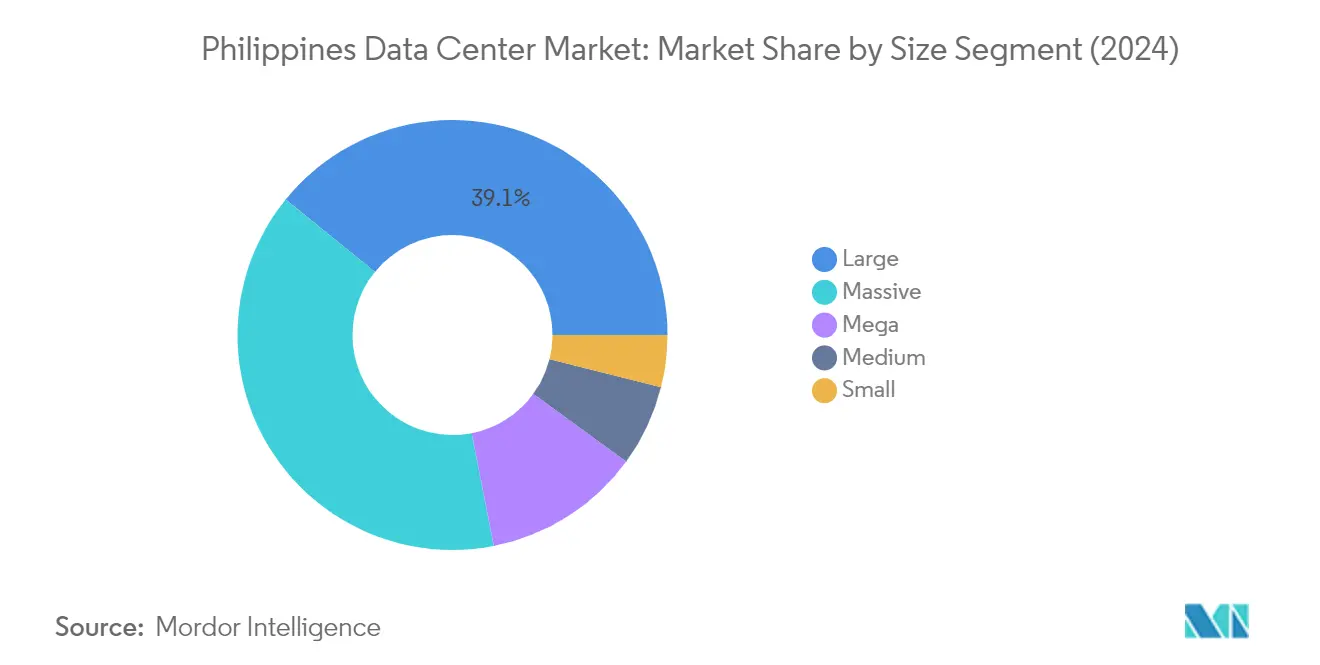
Large Segment in Philippines Data Center Market
The Large segment dominates the Philippines data center market, commanding approximately 39% market share in 2024. With 24 data center facilities identified as large data center facilities, these installations are primarily concentrated in the NCR region, holding about 36% of the total large data center capacity MW. Space DC (MNL1) maintains a significant presence in this segment, demonstrating the robust data center infrastructure capabilities of large-scale facilities. These data centers are strategically positioned to serve the growing demands of enterprises and cloud service providers, with facilities offering comprehensive colocation data center services and advanced infrastructure support. The segment's dominance reflects the market's preference for established, reliable data center operations that can support substantial IT workloads while maintaining operational efficiency.
Mega Segment in Philippines Data Center Market
The Mega segment emerges as the fastest-growing category in the Philippines data center market, projected to expand at an impressive rate of approximately 40% from 2024 to 2029. This remarkable growth trajectory is driven by five mega-sized data center facilities currently under construction, with major players like Globe+STT GDC+ Ayala Corporation (Karmanedge Inc.) and Diode Ventures + Endec Group + B&V leading the development. These facilities are designed to meet the escalating demands of hyperscale clients and large enterprises, incorporating advanced data center cooling technologies and data center power distribution systems. The segment's rapid expansion is further supported by the increasing adoption of cloud services, digital transformation initiatives, and the growing need for high-density computing environments in the Philippines.
Remaining Segments in Data Center Size
The market's diversity is further enhanced by the Massive, Medium, and Small segments, each serving distinct market needs. The Massive segment maintains a strong presence with facilities concentrated in key business districts, offering robust infrastructure for large-scale operations. Medium-sized data centers provide flexible solutions for growing businesses, particularly in regions like Central Visayas and NCR. The Small segment, while more modest in scale, continues to serve specific market niches, particularly supporting local businesses and regional operations. These segments collectively contribute to a well-rounded market ecosystem, ensuring that various customer requirements across different scales of operation are effectively addressed.
Segment Analysis: Tier Type
Tier 3 Segment in Philippines Data Center Market
The Tier 3 segment dominates the Philippines data center market, commanding approximately 54% market share in 2024. These data centers are highly preferred by large businesses due to their superior reliability and performance characteristics, offering an impressive uptime of 99.98% with N+1 redundancies and only about 1.6 hours of downtime annually. The segment's dominance is reinforced by multiple operators preferring to construct new facilities with Tier 3 certification, particularly in key regions like NCR, Davao, and Calabarzon. Major players like STT and Zenlayer have established a significant presence in this segment, with STT operating five Tier 3-certified facilities and Zenlayer managing four such facilities in the region.
Tier 4 Segment in Philippines Data Center Market
The Tier 4 segment is emerging as the fastest-growing tier type in the Philippines data center market, with a projected growth rate of approximately 33% during 2024-2029. This remarkable growth trajectory is driven by the segment's superior reliability features, offering the lowest downtime of around 26.3 minutes annually. The segment's expansion is further supported by major infrastructure developments, with about five new data center facilities planned for construction with Tier 4 standards. These upcoming facilities represent a significant capacity addition of over 200 MW to the market, with key players like ePLDT Vitro leading the development of these advanced facilities. The increasing demand for high-reliability data centers from critical sectors such as banking, healthcare, and government services is propelling this segment's rapid growth.
Remaining Segments in Tier Type
The Tier 1 and Tier 2 segments continue to serve specific market needs despite the industry's shift towards higher tier certifications. These facilities primarily cater to small businesses and organizations with less critical data storage needs, offering a balance between cost-effectiveness and basic reliability standards. While new construction of Tier 1 and 2 facilities has slowed, these data centers maintain their relevance in regions like Central Visayas, Central Luzon, and NCR, particularly for businesses with budget constraints or those requiring basic colocation services. However, the segment's role is gradually evolving as the market increasingly favors higher tier certifications for new deployments.
Segment Analysis: Absorption
Utilized Segment in Philippines Data Center Market
The utilized segment dominates the Philippines data center market, accounting for approximately 76% of the total IT load capacity in 2024. This segment has emerged as both the largest and fastest-growing segment, projected to grow at around 18% during 2024-2029. The growth is primarily driven by the increasing number of businesses and organizations migrating their data and critical information to the cloud as a result of continued work-from-home and hybrid work arrangements. The expansion of e-commerce, streaming and gaming services, and the rise in cashless transactions have further accelerated the demand for utilized data center capacity MW. The country's position as a prime destination for digital infrastructure deployments, supported by government incentives to attract large hyperscale internet companies, has strengthened the utilized segment's dominance. Additionally, the rising smart city trends and the government's push for digitalization have contributed to the continuous development and diversification of the data center ecosystem.
Non-Utilized Segment in Philippines Data Center Market
The non-utilized segment represents the available capacity in data centers that remains unused or reserved for future expansion. This segment plays a crucial role in the market by providing the necessary buffer capacity for sudden spikes in demand and future growth requirements. Data center operators maintain this unused capacity to ensure they can quickly respond to increasing customer demands without compromising service quality. The segment also serves as a strategic reserve for accommodating new clients and supporting the rapid deployment of additional data center services. The presence of non-utilized capacity demonstrates the market's preparedness for future growth and its ability to handle increasing digitalization demands across various sectors.
Philippines Data Center Industry Overview
Top Companies in Philippines Data Center Market
The Philippines data center market is characterized by continuous innovation and strategic expansion initiatives from major players. Companies are increasingly focusing on implementing sustainability measures, with several data center companies adopting renewable energy sources and energy-efficient cooling systems to reduce their carbon footprint. Operational excellence is being prioritized through enhanced connectivity solutions, improved redundancy systems, and advanced data center security protocols. Strategic partnerships, particularly with cloud service providers and telecommunications companies, have become a key trend to strengthen market presence. The industry is witnessing significant expansion through new facility constructions, with many operators announcing hyperscale data centers in the Philippines to meet growing demand. Players are also investing in upgrading existing facilities to higher tier certifications and implementing advanced technologies like AI-driven operations and monitoring systems.
Market Dominated by Global-Local Joint Ventures
The Philippines data center market exhibits a unique structure where global operators are forming strategic alliances with local telecommunications and real estate conglomerates to establish strong market positions. These partnerships combine international expertise in data center management with local market knowledge and existing infrastructure networks. The market shows moderate consolidation, with the top three players controlling a significant portion of the data center market share by company, while still maintaining healthy competition through various specialized operators focusing on specific market segments or geographical areas.
The market is experiencing a wave of consolidation through strategic partnerships and joint ventures rather than traditional mergers and acquisitions. Local telecommunications giants are partnering with international data center specialists to expand their capabilities and market reach. This trend is reshaping the competitive landscape, creating stronger entities that can better serve the growing demand for data center solutions while maintaining competitive pricing and service quality. The market structure is evolving from purely local or purely global operations to hybrid models that leverage both local presence and global expertise.
Innovation and Sustainability Drive Future Success
Success in the Philippines data center market increasingly depends on operators' ability to balance technological advancement with sustainability initiatives. Companies need to focus on developing energy-efficient facilities while maintaining high-performance standards to meet growing customer demands. The ability to offer flexible colocation solutions, ranging from retail to hyperscale deployments, will be crucial for capturing diverse customer segments. Operators must also invest in advanced security measures and maintain multiple tier certifications to address varying client requirements and regulatory compliance needs.
Market players need to develop strong relationships with cloud service providers and implement advanced connectivity solutions to remain competitive. The focus should be on building facilities in strategic locations with access to reliable power sources and robust fiber connectivity. Companies must also consider the growing importance of edge computing and prepare for increased demand in secondary markets outside Metro Manila. Success will depend on the ability to offer comprehensive solutions that include not just space and power, but also managed services, cloud connectivity, and disaster recovery options. Regulatory compliance, particularly regarding data sovereignty and environmental standards, will become increasingly important for maintaining market position.
Philippines Data Center Market Leaders
-
ePLDT Inc.
-
GTI Corporation
-
NTT Ltd
-
STT GDC Pte Ltd
-
Zenlayer Inc.
- *Disclaimer: Major Players sorted in no particular order

Need More Details on Market Players and Competiters?
Download PDF
Philippines Data Center Market News
- October 2022: Zenlayer entered a joint venture with Megaport to strengthen and expand its presence globally. The partnership is aimed at providing enhanced services such as improved network connectivity, real-time provisioning, and on-demand private connectivity for its global clients.
- August 2022: ePLDT partnered with Abra State Institute of Science and Technology (ASIST) to offer smart campus digitalization solutions and provide better learning experiences to students.
- June 2022: BNS was certified and included in the list of Cybersecurity Assessment Providers by DICT.
Free With This Report
We provide a complimentary and exhaustive set of data points on the country and regional level metrics that present the fundamental structure of the industry. Presented in the form of 50+ free charts, the sections cover difficult to find data on various countries on smartphone users, data traffic per smartphone, mobile and broadband data speed, fiber connectivity network, and submarine cables.


Philippines Data Center Market Report - Table of Contents
1. EXECUTIVE SUMMARY & KEY FINDINGS
2. REPORT OFFERS
3. INTRODUCTION
- 3.1 Study Assumptions & Market Definition
- 3.2 Scope of the Study
- 3.3 Research Methodology
4. MARKET OUTLOOK
- 4.1 It Load Capacity
- 4.2 Raised Floor Space
- 4.3 Colocation Revenue
- 4.4 Installed Racks
- 4.5 Rack Space Utilization
- 4.6 Submarine Cable
5. Key Industry Trends
- 5.1 Smartphone Users
- 5.2 Data Traffic Per Smartphone
- 5.3 Mobile Data Speed
- 5.4 Broadband Data Speed
- 5.5 Fiber Connectivity Network
-
5.6 Regulatory Framework
- 5.6.1 Philippines
- 5.7 Value Chain & Distribution Channel Analysis
6. MARKET SEGMENTATION (INCLUDES MARKET SIZE IN VOLUME, FORECASTS UP TO 2030 AND ANALYSIS OF GROWTH PROSPECTS)
-
6.1 Hotspot
- 6.1.1 NCR (Metro Manila)
- 6.1.2 Rest of Philippines
-
6.2 Data Center Size
- 6.2.1 Large
- 6.2.2 Massive
- 6.2.3 Medium
- 6.2.4 Mega
- 6.2.5 Small
-
6.3 Tier Type
- 6.3.1 Tier 1 and 2
- 6.3.2 Tier 3
- 6.3.3 Tier 4
-
6.4 Absorption
- 6.4.1 Non-Utilized
- 6.4.2 Utilized
- 6.4.2.1 By Colocation Type
- 6.4.2.1.1 Hyperscale
- 6.4.2.1.2 Retail
- 6.4.2.1.3 Wholesale
- 6.4.2.2 By End User
- 6.4.2.2.1 BFSI
- 6.4.2.2.2 Cloud
- 6.4.2.2.3 E-Commerce
- 6.4.2.2.4 Government
- 6.4.2.2.5 Manufacturing
- 6.4.2.2.6 Media & Entertainment
- 6.4.2.2.7 Telecom
- 6.4.2.2.8 Other End User
7. COMPETITIVE LANDSCAPE
- 7.1 Market Share Analysis
- 7.2 Company Landscape
-
7.3 Company Profiles (includes Global Level Overview, Market Level Overview, Core Business Segments, Financials, Headcount, Key Information, Market Rank, Market Share, Products and Services, and Analysis of Recent Developments).
- 7.3.1 Bitstop
- 7.3.2 Dataone
- 7.3.3 ePLDT Inc.
- 7.3.4 GTI Corporation
- 7.3.5 NTT Ltd
- 7.3.6 Space DC Pte Ltd
- 7.3.7 STT GDC Pte Ltd
- 7.3.8 VSTECS Phils Inc.
- 7.3.9 Zenlayer Inc.
- 7.4 LIST OF COMPANIES STUDIED
8. KEY STRATEGIC QUESTIONS FOR DATA CENTER CEOS
9. APPENDIX
-
9.1 Global Overview
- 9.1.1 Overview
- 9.1.2 Porter’s Five Forces Framework
- 9.1.3 Global Value Chain Analysis
- 9.1.4 Global Market Size and DROs
- 9.2 Sources & References
- 9.3 List of Tables & Figures
- 9.4 Primary Insights
- 9.5 Data Pack
- 9.6 Glossary of Terms
You Can Purchase Parts Of This Report. Check Out Prices For Specific Sections
Get Price Break-up Now
List of Tables & Figures
- Figure 1:
- VOLUME OF IT LOAD CAPACITY, MW, PHILIPPINES, 2018 - 2030
- Figure 2:
- VOLUME OF RAISED FLOOR AREA, SQ.FT. ('000), PHILIPPINES, 2018 - 2030
- Figure 3:
- VALUE OF COLOCATION REVENUE, USD MILLION, PHILIPPINES, 2018 - 2030
- Figure 4:
- VOLUME OF INSTALLED RACKS, NUMBER, PHILIPPINES, 2018 - 2030
- Figure 5:
- RACK SPACE UTILIZATION, %, PHILIPPINES, 2018 - 2030
- Figure 6:
- COUNT OF SMARTPHONE USERS, IN MILLION, PHILIPPINES, 2018 - 2030
- Figure 7:
- DATA TRAFFIC PER SMARTPHONE, GB, PHILIPPINES, 2018 - 2030
- Figure 8:
- AVERAGE MOBILE DATA SPEED, MBPS, PHILIPPINES, 2018 - 2030
- Figure 9:
- AVERAGE BROADBAND SPEED, MBPS, PHILIPPINES, 2018 - 2030
- Figure 10:
- LENGTH OF FIBER CONNECTIVITY NETWORK, KILOMETER, PHILIPPINES, 2018 - 2030
- Figure 11:
- VOLUME OF IT LOAD CAPACITY, MW, PHILIPPINES, 2018 - 2030
- Figure 12:
- VOLUME OF HOTSPOT, MW, PHILIPPINES, 2018 - 2030
- Figure 13:
- VOLUME SHARE OF HOTSPOT, %, PHILIPPINES, 2018 - 2030
- Figure 14:
- VOLUME SIZE OF NCR (METRO MANILA), MW, PHILIPPINES, 2018 - 2030
- Figure 15:
- VOLUME SHARE OF NCR (METRO MANILA), MW, HOTSPOT, %, PHILIPPINES, 2018 - 2030
- Figure 16:
- VOLUME SIZE OF REST OF PHILIPPINES, MW, PHILIPPINES, 2018 - 2030
- Figure 17:
- VOLUME SHARE OF REST OF PHILIPPINES, MW, HOTSPOT, %, PHILIPPINES, 2018 - 2030
- Figure 18:
- VOLUME OF DATA CENTER SIZE, MW, PHILIPPINES, 2018 - 2030
- Figure 19:
- VOLUME SHARE OF DATA CENTER SIZE, %, PHILIPPINES, 2018 - 2030
- Figure 20:
- VOLUME SIZE OF LARGE, MW, PHILIPPINES, 2018 - 2030
- Figure 21:
- VOLUME SIZE OF MASSIVE, MW, PHILIPPINES, 2018 - 2030
- Figure 22:
- VOLUME SIZE OF MEDIUM, MW, PHILIPPINES, 2018 - 2030
- Figure 23:
- VOLUME SIZE OF MEGA, MW, PHILIPPINES, 2018 - 2030
- Figure 24:
- VOLUME SIZE OF SMALL, MW, PHILIPPINES, 2018 - 2030
- Figure 25:
- VOLUME OF TIER TYPE, MW, PHILIPPINES, 2018 - 2030
- Figure 26:
- VOLUME SHARE OF TIER TYPE, %, PHILIPPINES, 2018 - 2030
- Figure 27:
- VOLUME SIZE OF TIER 1 AND 2, MW, PHILIPPINES, 2018 - 2030
- Figure 28:
- VOLUME SIZE OF TIER 3, MW, PHILIPPINES, 2018 - 2030
- Figure 29:
- VOLUME SIZE OF TIER 4, MW, PHILIPPINES, 2018 - 2030
- Figure 30:
- VOLUME OF ABSORPTION, MW, PHILIPPINES, 2018 - 2030
- Figure 31:
- VOLUME SHARE OF ABSORPTION, %, PHILIPPINES, 2018 - 2030
- Figure 32:
- VOLUME SIZE OF NON-UTILIZED, MW, PHILIPPINES, 2018 - 2030
- Figure 33:
- VOLUME OF COLOCATION TYPE, MW, PHILIPPINES, 2018 - 2030
- Figure 34:
- VOLUME SHARE OF COLOCATION TYPE, %, PHILIPPINES, 2018 - 2030
- Figure 35:
- VOLUME SIZE OF HYPERSCALE, MW, PHILIPPINES, 2018 - 2030
- Figure 36:
- VOLUME SIZE OF RETAIL, MW, PHILIPPINES, 2018 - 2030
- Figure 37:
- VOLUME SIZE OF WHOLESALE, MW, PHILIPPINES, 2018 - 2030
- Figure 38:
- VOLUME OF END USER, MW, PHILIPPINES, 2018 - 2030
- Figure 39:
- VOLUME SHARE OF END USER, %, PHILIPPINES, 2018 - 2030
- Figure 40:
- VOLUME SIZE OF BFSI, MW, PHILIPPINES, 2018 - 2030
- Figure 41:
- VOLUME SIZE OF CLOUD, MW, PHILIPPINES, 2018 - 2030
- Figure 42:
- VOLUME SIZE OF E-COMMERCE, MW, PHILIPPINES, 2018 - 2030
- Figure 43:
- VOLUME SIZE OF GOVERNMENT, MW, PHILIPPINES, 2018 - 2030
- Figure 44:
- VOLUME SIZE OF MANUFACTURING, MW, PHILIPPINES, 2018 - 2030
- Figure 45:
- VOLUME SIZE OF MEDIA & ENTERTAINMENT, MW, PHILIPPINES, 2018 - 2030
- Figure 46:
- VOLUME SIZE OF TELECOM, MW, PHILIPPINES, 2018 - 2030
- Figure 47:
- VOLUME SIZE OF OTHER END USER, MW, PHILIPPINES, 2018 - 2030
- Figure 48:
- VOLUME SHARE OF MAJOR PLAYERS, %, PHILIPPINES
Philippines Data Center Industry Segmentation
NCR (Metro Manila) are covered as segments by Hotspot. Large, Massive, Medium, Mega, Small are covered as segments by Data Center Size. Tier 1 and 2, Tier 3, Tier 4 are covered as segments by Tier Type. Non-Utilized, Utilized are covered as segments by Absorption.| Hotspot | NCR (Metro Manila) | |||
| Rest of Philippines | ||||
| Data Center Size | Large | |||
| Massive | ||||
| Medium | ||||
| Mega | ||||
| Small | ||||
| Tier Type | Tier 1 and 2 | |||
| Tier 3 | ||||
| Tier 4 | ||||
| Absorption | Non-Utilized | |||
| Utilized | By Colocation Type | Hyperscale | ||
| Retail | ||||
| Wholesale | ||||
| By End User | BFSI | |||
| Cloud | ||||
| E-Commerce | ||||
| Government | ||||
| Manufacturing | ||||
| Media & Entertainment | ||||
| Telecom | ||||
| Other End User | ||||
Need A Different Region or Segment?
Customize Now
Market Definition
- IT LOAD CAPACITY - The IT load capacity or installed capacity, refers to the amount of energy consumed by servers and network equipments placed in a rack installed. It is measured in megawatt (MW).
- ABSORPTION RATE - It denotes the extend to which the data center capacity has been leased out. For instance, a 100 MW DC has leased out 75 MW, then absorption rate would be 75%. It is also referred as utilization rate and leased-out capacity.
- RAISED FLOOR SPACE - It is an elevated space build over the floor. This gap between the original floor and the elevated floor is used to accommodate wiring, cooling, and other data center equipment. This arrangement assist in having proper wiring and cooling infrastructure. It is measured in square feet (ft^2).
- DATA CENTER SIZE - Data Center Size is segmented based on the raised floor space allocated to the data center facilities. Mega DC - # of Racks must be more than 9000 or RFS (raised floor space) must be more than 225001 Sq. ft; Massive DC - # of Racks must be in between 9000 and 3001 or RFS must be in between 225000 Sq. ft and 75001 Sq. ft; Large DC - # of Racks must be in between 3000 and 801 or RFS must be in between 75000 Sq. ft and 20001 Sq. ft; Medium DC # of Racks must be in between 800 and 201 or RFS must be in between 20000 Sq. ft and 5001 Sq. ft; Small DC - # of Racks must be less than 200 or RFS must be less than 5000 Sq. ft.
- TIER TYPE - According to Uptime Institute the data centers are classified into four tiers based on the proficiencies of redundant equipment of the data center infrastructure. In this segment the data center are segmented as Tier 1,Tier 2, Tier 3 and Tier 4.
- COLOCATION TYPE - The segment is segregated into 3 categories namely Retail, Wholesale and Hyperscale Colocation service. The categorization is done based on the amount of IT load leased out to potential customers. Retail colocation service has leased capacity less than 250 kW; Wholesale colocation services has leased capacity between 251 kW and 4 MW and Hyperscale colocation services has leased capacity more than 4 MW.
- END CONSUMERS - The Data Center Market operates on a B2B basis. BFSI, Government, Cloud Operators, Media and Entertainment, E-Commerce, Telecom and Manufacturing are the major end-consumers in the market studied. The scope only includes colocation service operators catering to the increasing digitalization of the end-user industries.
| Keyword | Definition |
|---|---|
| Rack Unit | Generally referred as U or RU, it is the unit of measurement for the server unit housed in the racks in the data center. 1U is equal to 1.75 inches. |
| Rack Density | It defines the amount of power consumed by the equipment and server housed in a rack. It is measured in kilowatt (kW). This factor plays a critical role in data center design and, cooling and power planning. |
| IT Load Capacity | The IT load capacity or installed capacity, refers to the amount of energy consumed by servers and network equipment placed in a rack installed. It is measured in megawatt (MW). |
| Absorption Rate | It denotes how much of the data center capacity has been leased out. For instance, if a 100 MW DC has leased out 75 MW, then the absorption rate would be 75%. It is also referred to as utilization rate and leased-out capacity. |
| Raised Floor Space | It is an elevated space built over the floor. This gap between the original floor and the elevated floor is used to accommodate wiring, cooling, and other data center equipment. This arrangement assists in having proper wiring and cooling infrastructure. It is measured in square feet/meter. |
| Computer Room Air Conditioner (CRAC) | It is a device used to monitor and maintain the temperature, air circulation, and humidity inside the server room in the data center. |
| Aisle | It is the open space between the rows of racks. This open space is critical for maintaining the optimal temperature (20-25 °C) in the server room. There are primarily two aisles inside the server room, a hot aisle and a cold aisle. |
| Cold Aisle | It is the aisle wherein the front of the rack faces the aisle. Here, chilled air is directed into the aisle so that it can enter the front of the racks and maintain the temperature. |
| Hot Aisle | It is the aisle where the back of the racks faces the aisle. Here, the heat dissipated from the equipment’s in the rack is directed to the outlet vent of the CRAC. |
| Critical Load | It includes the servers and other computer equipment whose uptime is critical for data center operation. |
| Power Usage Effectiveness (PUE) | It is a metric which defines the efficiency of a data center. It is calculated by: (𝑇𝑜𝑡𝑎𝑙 𝐷𝑎𝑡𝑎 𝐶𝑒𝑛𝑡𝑒𝑟 𝐸𝑛𝑒𝑟𝑔𝑦 𝐶𝑜𝑛𝑠𝑢𝑚𝑝𝑡𝑖𝑜𝑛)/(𝑇𝑜𝑡𝑎𝑙 𝐼𝑇 𝐸𝑞𝑢𝑖𝑝𝑚𝑒𝑛𝑡 𝐸𝑛𝑒𝑟𝑔𝑦 𝐶𝑜𝑛𝑠𝑢𝑚𝑝𝑡𝑖𝑜𝑛). Further, a data center with a PUE of 1.2-1.5 is considered highly efficient, whereas, a data center with a PUE >2 is considered highly inefficient. |
| Redundancy | It is defined as a system design wherein additional component (UPS, generators, CRAC) is added so that in case of power outage, equipment failure, the IT equipment should not be affected. |
| Uninterruptible Power Supply (UPS) | It is a device that is connected in series with the utility power supply, storing energy in batteries such that the supply from UPS is continuous to IT equipment even during utility power is snapped. The UPS primarily supports the IT equipment only. |
| Generators | Just like UPS, generators are placed in the data center to ensure an uninterrupted power supply, avoiding downtime. Data center facilities have diesel generators and commonly, 48-hour diesel is stored in the facility to prevent disruption. |
| N | It denotes the tools and equipment required for a data center to function at full load. Only "N" indicates that there is no backup to the equipment in the event of any failure. |
| N+1 | Referred to as 'Need plus one', it denotes the additional equipment setup available to avoid downtime in case of failure. A data center is considered N+1 when there is one additional unit for every 4 components. For instance, if a data center has 4 UPS systems, then for to achieve N+1, an additional UPS system would be required. |
| 2N | It refers to fully redundant design wherein two independent power distribution system is deployed. Therefore, in the event of a complete failure of one distribution system, the other system will still supply power to the data center. |
| In-Row Cooling | It is the cooling design system installed between racks in a row where it draws warm air from the hot aisle and supplies cool air to the cold aisle, thereby maintaining the temperature. |
| Tier 1 | Tier classification determines the preparedness of a data center facility to sustain data center operation. A data center is classified as Tier 1 data center when it has a non-redundant (N) power component (UPS, generators), cooling components, and power distribution system (from utility power grids). The Tier 1 data center has an uptime of 99.67% and an annual downtime of <28.8 hours. |
| Tier 2 | A data center is classified as Tier 2 data center when it has a redundant power and cooling components (N+1) and a single non-redundant distribution system. Redundant components include extra generators, UPS, chillers, heat rejection equipment, and fuel tanks. The Tier 2 data center has an uptime of 99.74% and an annual downtime of <22 hours. |
| Tier 3 | A data center having redundant power and cooling components and multiple power distribution systems is referred to as a Tier 3 data center. The facility is resistant to planned (facility maintenance) and unplanned (power outage, cooling failure) disruption. The Tier 3 data center has an uptime of 99.98% and an annual downtime of <1.6 hours. |
| Tier 4 | It is the most tolerant type of data center. A Tier 4 data center has multiple, independent redundant power and cooling components and multiple power distribution paths. All IT equipment are dual powered, making them fault tolerant in case of any disruption, thereby ensuring interrupted operation. The Tier 4 data center has an uptime of 99.74% and an annual downtime of <26.3 minutes. |
| Small Data Center | Data center that has floor space area of ≤ 5,000 Sq. ft or the number of racks that can be installed is ≤ 200 is classified as a small data center. |
| Medium Data Center | Data center which has floor space area between 5,001-20,000 Sq. ft, or the number of racks that can be installed is between 201-800, is classified as a medium data center. |
| Large Data Center | Data center which has floor space area between 20,001-75,000 Sq. ft, or the number of racks that can be installed is between 801-3,000, is classified as a large data center. |
| Massive Data Center | Data center which has floor space area between 75,001-225,000 Sq. ft, or the number of racks that can be installed is between 3001-9,000, is classified as a massive data center. |
| Mega Data Center | Data center that has a floor space area of ≥ 225,001 Sq. ft or the number of racks that can be installed is ≥ 9001 is classified as a mega data center. |
| Retail Colocation | It refers to those customers who have a capacity requirement of 250 kW or less. These services are majorly opted by small and medium enterprises (SMEs). |
| Wholesale Colocation | It refers to those customers who have a capacity requirement between 250 kW to 4 MW. These services are majorly opted by medium to large enterprises. |
| Hyperscale Colocation | It refers to those customers who have a capacity requirement greater than 4 MW. The hyperscale demand primarily originates from large-scale cloud players, IT companies, BFSI, and OTT players (like Netflix, Hulu, and HBO+). |
| Mobile Data Speed | It is the mobile internet speed a user experiences via their smartphones. This speed is primarily dependent on the carrier technology being used in the smartphone. The carrier technologies available in the market are 2G, 3G, 4G, and 5G, where 2G provides the slowest speed while 5G is the fastest. |
| Fiber Connectivity Network | It is a network of optical fiber cables deployed across the country, connecting rural and urban regions with high-speed internet connection. It is measured in kilometer (km). |
| Data Traffic per Smartphone | It is a measure of average data consumption by a smartphone user in a month. It is measured in gigabyte (GB). |
| Broadband Data Speed | It is the internet speed that is supplied over the fixed cable connection. Commonly, copper cable and optic fiber cable are used in both residential and commercial use. Here, optic cable fiber provides faster internet speed than copper cable. |
| Submarine Cable | A submarine cable is a fiber optic cable laid down at two or more landing points. Through this cable, communication and internet connectivity between countries across the globe is established. These cables can transmit 100-200 terabits per second (Tbps) from one point to another. |
| Carbon Footprint | It is the measure of carbon dioxide generated during the regular operation of a data center. Since, coal, and oil & gas are the primary source of power generation, consumption of this power contributes to carbon emissions. Data center operators are incorporating renewable energy sources to curb the carbon footprint emerging in their facilities. |
Need More Details on Market Definition?
Ask a Question
Research Methodology
Mordor Intelligence follows a four-step methodology in all our reports.
- Step-1: Identify Key Variables: In order to build a robust forecasting methodology, the variables and factors identified in Step-1 are tested against available historical market numbers. Through an iterative process, the variables required for market forecast are set and the model is built on the basis of these variables.
- Step-2: Build a Market Model: Market-size estimations for the forecast years are in nominal terms. Inflation is not a part of the pricing, and the average selling price (ASP) is kept constant throughout the forecast period for each country.
- Step-3: Validate and Finalize: In this important step, all market numbers, variables and analyst calls are validated through an extensive network of primary research experts from the market studied. The respondents are selected across levels and functions to generate a holistic picture of the market studied.
- Step-4: Research Outputs: Syndicated Reports, Custom Consulting Assignments, Databases & Subscription Platforms

Get More Details On Research Methodology
Download PDF


