
Phenol Market Size and Share
Market Overview
| Study Period | 2020 - 2031 |
|---|---|
| Market Volume (2026) | 12.85 Million tons |
| Market Volume (2031) | 15.01 Million tons |
| Growth Rate (2026 - 2031) | 3.16 % |
| Fastest Growing Market | Middle East and Africa |
| Largest Market | Asia Pacific |
| Market Concentration | Medium |
Major Players *Disclaimer: Major Players sorted in no particular order Image © Mordor Intelligence. Reuse requires attribution under CC BY 4.0. | |
Phenol Market Analysis by Mordor Intelligence
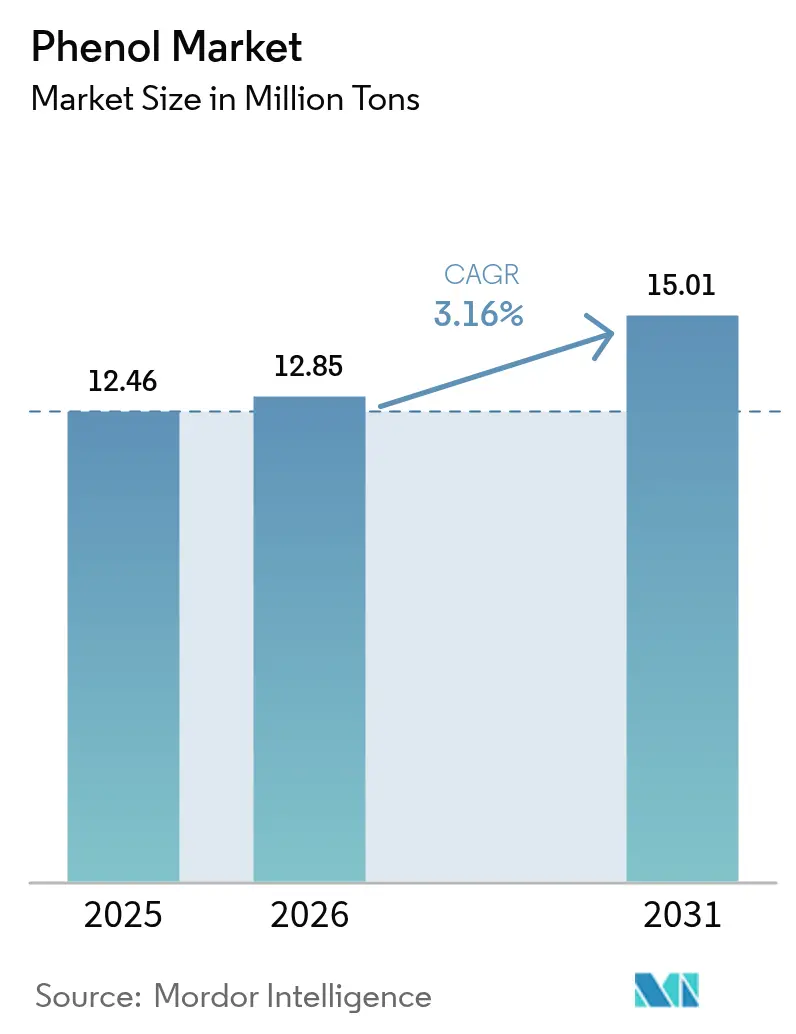
The Phenol market size is expected to grow from 12.46 Million tons in 2025 to 12.85 Million tons in 2026 and is forecast to reach 15.01 Million tons by 2031 at 3.16% CAGR over 2026-2031. This measured expansion reflects maturation in long-established applications, heavier regulatory oversight, and the steady rollout of sustainable production technologies. Increasing polycarbonate demand in electronics, expanding automotive lightweighting programs, and infrastructure investments that favor thermally efficient insulation are expected to keep incremental volume growth positive. Capacity additions in Asia-Pacific, particularly China, will continue to reshape global trade flows even as European producers rationalize higher-cost assets. At the same time, bio-based routes to cumene and lignin-derived phenolics are creating a dual-track innovation race that may compress traditional producer margins while allowing first movers to command specialty premiums. Competitive strategies therefore hinge on integration across the phenol–acetone–derivatives chain, feedstock flexibility, and rapid commercialization of low-carbon pathways.
Key Report Takeaways
- By product type, bisphenol-A held 44.35% of the phenol market share in 2025, while caprolactam recorded the highest projected CAGR at 4.86% through 2031.
- By end-user industry, the automotive segment led with 21.21% revenue share in 2025; pharmaceuticals are forecast to advance at a 5.18% CAGR to 2031.
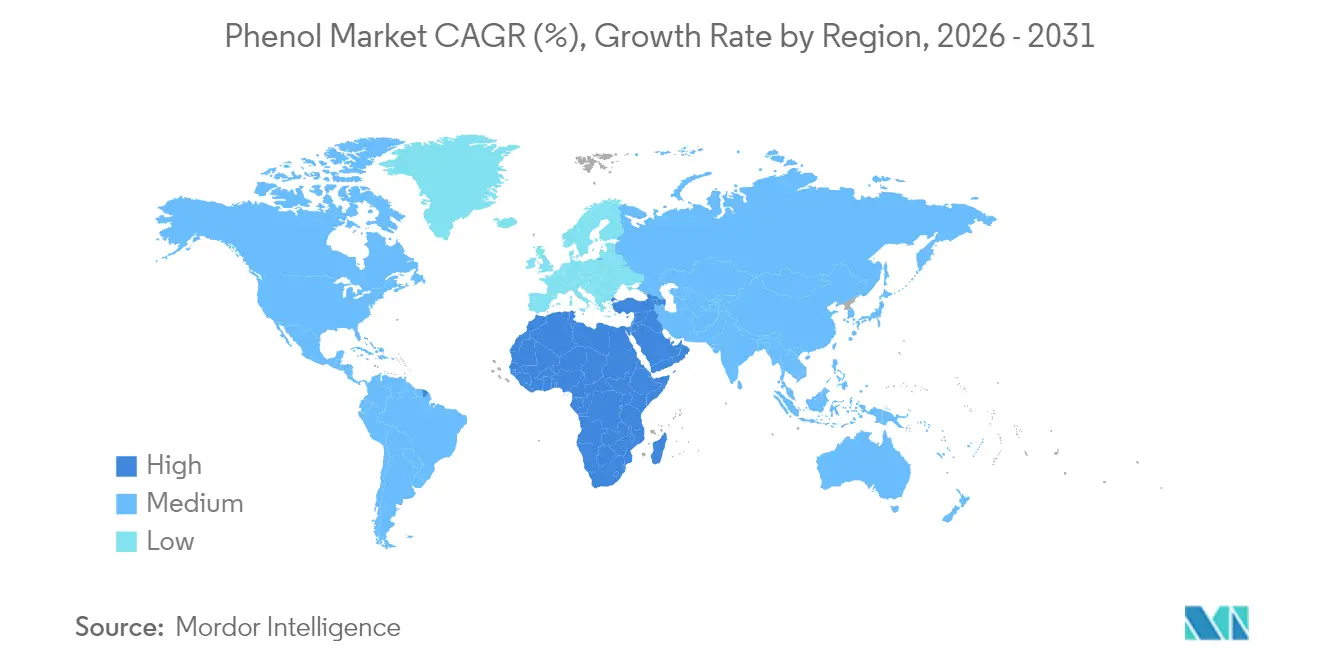
- By geography, Asia-Pacific commanded 53.94% of the phenol market size in 2025; the Middle East and Africa region is set to expand at a 5.42% CAGR between 2026 and 2031.
Note: Market size and forecast figures in this report are generated using Mordor Intelligence’s proprietary estimation framework, updated with the latest available data and insights as of 2026.
Market Trends and Insights
Drivers Impact Analysis of Phenol Market*
| Driver | (~) % Impact on CAGR Forecast | Geographic Relevance | Impact Timeline |
|---|---|---|---|
| High Demand for Bisphenol-A in Polycarbonates and Epoxy Resins | +0.8% | Global, with concentration in Asia-Pacific and North America | Medium term (2-4 years) |
| Growth in Lightweight Automotive Phenolic Composites | +0.6% | Global, led by North America and Europe | Long term (≥ 4 years) |
| Construction-Sector Uptake of Phenolic Insulation Boards | +0.4% | Europe and North America, expanding to Asia-Pacific | Medium term (2-4 years) |
| Sustainable Cumene Routes Using Bio/Green Propylene | +0.3% | Europe and North America initially, global expansion | Long term (≥ 4 years) |
| Integration of Phenol Units with On-Purpose PO/SM Complexes | +0.5% | Asia-Pacific and Middle East | Medium term (2-4 years) |
| Source: Mordor Intelligence | |||
High Demand for Bisphenol-A in Polycarbonates and Epoxy Resins
Bisphenol-A continues to be the backbone monomer for polycarbonate and epoxy resins used in electronics housings, automotive glazing, and medical devices where clarity and impact strength are non-negotiable[1]. Battery enclosures in electric vehicles now specify flame-retardant polycarbonate blends, further lifting BPA volumes even after Europe’s recent bans in food packaging. China and India are offsetting those European losses through aggressive electronics manufacturing and infrastructure projects that deploy large polycarbonate sheet volumes. Producers are maintaining capacity utilization by diverting cargoes to Southeast Asian converters and North American contract molders. Over the medium term, incremental BPA growth should keep operating rates near 85%, supporting the broader phenol market despite localized restrictions.
Growth in Lightweight Automotive Phenolic Composites
Automakers are validating phenolic composites beyond brake boosters and clutch plates, with structural intake manifolds and air-management components already proven at BMW’s series plants. The material’s ability to maintain dimensional stability at 140 °C while reducing mass by nearly 20% aligns with stringent emissions and range targets. Electric-vehicle platforms add another pull on phenol derivatives for battery module housings where flame-spread performance and mechanical integrity under thermal runaway are critical. Original equipment suppliers (OES) report 15-year durability cycles and consistent crash-resistance metrics, prompting tier-one composite processors in Europe and the United States to enter long-term offtake contracts. These developments elevate the phenol market by shifting demand toward high-value engineering applications with price-inelastic characteristics.
Construction-Sector Uptake of Phenolic Insulation Boards
Phenolic foam delivers thermal conductivities of 0.020–0.025 W/m·K, roughly 30% lower than conventional PUR foams, allowing thinner wall assemblies and higher usable floor space. European fire codes now prioritize insulation that withstands 1 300 °C flashover with minimal smoke toxicity, a standard phenolic boards comfortably meet. Developers of multi-family towers in the United Kingdom and Germany are specifying phenolic panels to comply with post-Grenfell façade requirements. North American builders increasingly cite life-cycle savings from reduced HVAC loads, while humidity-prone ASEAN markets value the closed-cell water resistance that delays mold growth. Collectively, these factors underpin stable growth in construction-related phenolic resin pull-through.
Sustainable Cumene Routes Using Bio/Green Propylene
Sumitomo Chemical’s ethanol-to-propylene pilot demonstrated 50% conversion efficiency, positioning bio-propylene as a direct drop-in to existing cumene units. Life-cycle assessments show carbon-intensity cuts of 60-80% relative to naphtha-sourced feedstock, appealing to brands committed to science-based targets. Early adopters forecast certificate-backed premiums of USD 120–150 per ton for low-carbon phenol, equalizing economics once carbon taxes exceed USD 55 per ton of CO₂. Producers already leveraging renewable power at integrated sites in Belgium and Texas can bolt on bio-propylene supply with modest debottlenecking, fast-tracking commercialization and supporting the phenol market transition toward greener chemistry.
Restraints Impact Analysis of Phenol Market*
| Restraint | (~) % Impact on CAGR Forecast | Geographic Relevance | Impact Timeline |
|---|---|---|---|
| BPA Restrictions in Food-Contact Applications | -0.7% | Europe immediately, potential global expansion | Short term (≤ 2 years) |
| Feedstock (Benzene and Propylene) Price Volatility | -0.4% | Global, with higher impact in naphtha-dependent regions | Short term (≤ 2 years) |
| Rise of Bio-Based Phenolic Alternatives | -0.2% | Europe and North America initially | Long term (≥ 4 years) |
| Source: Mordor Intelligence | |||
BPA Restrictions in Food-Contact Applications
The European Commission’s 2024 regulation eliminated BPA from can coatings and reusable food containers, removing nearly one-fifth of regional demand. Allowed transition windows force packagers to requalify materials inside 18 months, disrupting procurement pipelines and triggering inventory run-downs at epoxy resin producers. Similar draft proposals in Canada and several U.S. states add downside risk through 2027. Although industrial uses remain intact, the public-health spotlight on endocrine disruptors may dampen investor confidence, compelling phenol market participants to diversify toward less contentious derivative portfolios.
Feedstock (Benzene and Propylene) Price Volatility
North American styrene plant closures are curtailing benzene by-product output, tightening supply and lifting contract prices that feed directly into cumene cash costs. Concurrently, LyondellBasell’s Houston refinery shutdown removed 136 000 tons of propylene capacity, while new polypropylene plants hoover up incremental barrels. Each 10% rise in either feedstock strips 6-8% off integrated phenol margins, pressuring swing producers to idle units or seek tolling agreements. Asian refiners, buoyed by cheaper condensate, will likely backfill any Western shortfall, but shipping differentials can erode arbitrage opportunities, injecting further uncertainty into the phenol market.
*Our forecasts treat driver/restraint impacts as directional, not additive. The impact forecasts reflect baseline growth, mix effects, and variable interactions.
Phenol Market Segment Analysis
By Product Type:
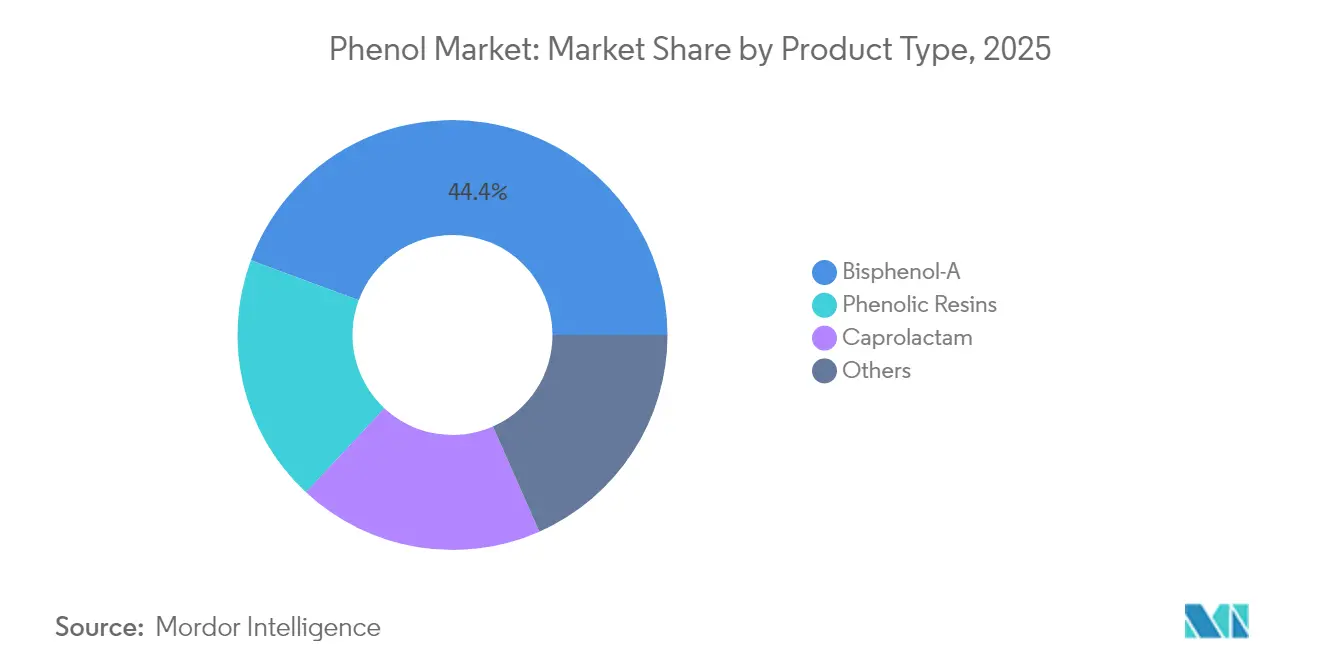
BPA Dominance Faces Regulatory HeadwindsBisphenol-A retained a 44.35% phenol market share in 2025, underpinned by entrenched polycarbonate volumes despite Europe’s food-contact ban . The phenol market size attached to BPA is now projected to grow at just 2.22% annually through 2031, compared with 4.86% for caprolactam. Producers with Chinese or Middle-Eastern assets are lifting utilization to offset Western demand erosion, driving new supply chains that circumvent regulatory bottlenecks. Phenolic resins, the second-largest application, benefit from rebounding construction activity, especially in commercial retrofits that favor low-smoke insulation boards. The caprolactam segment’s 4.86% CAGR rests on nylon 6 fiber expansion for technical textiles and lightweight automotive parts. Specialty intermediates such as alkylphenols serve surfactants, while xylenols feed disinfectant markets that expanded after recent public health crises. Advances in alkaline hydrolysis enable nylon recycling at industrial scale, looping waste back into caprolactam synthesis and potentially supporting a circular phenol market.
Shifting product mix now prioritizes higher-margin derivatives as commodity phenol contracts face margin compression from oversupply and volatile benzene pricing. As such, investment flows favor debottlenecking caprolactam and high-purity phenolic resin lines rather than greenfield BPA in Europe. Over the forecast horizon, technology licensors expect 1.5% energy-efficiency gains per retrofit cycle, unlocking incremental cost reductions. Environmental, social and governance (ESG) metrics are influencing customer procurement decisions, nudging producers toward bio-based phenol streams and recycled phenolic resins that command price premiums when accompanied by verified carbon intensity data.

By End-User Industry:
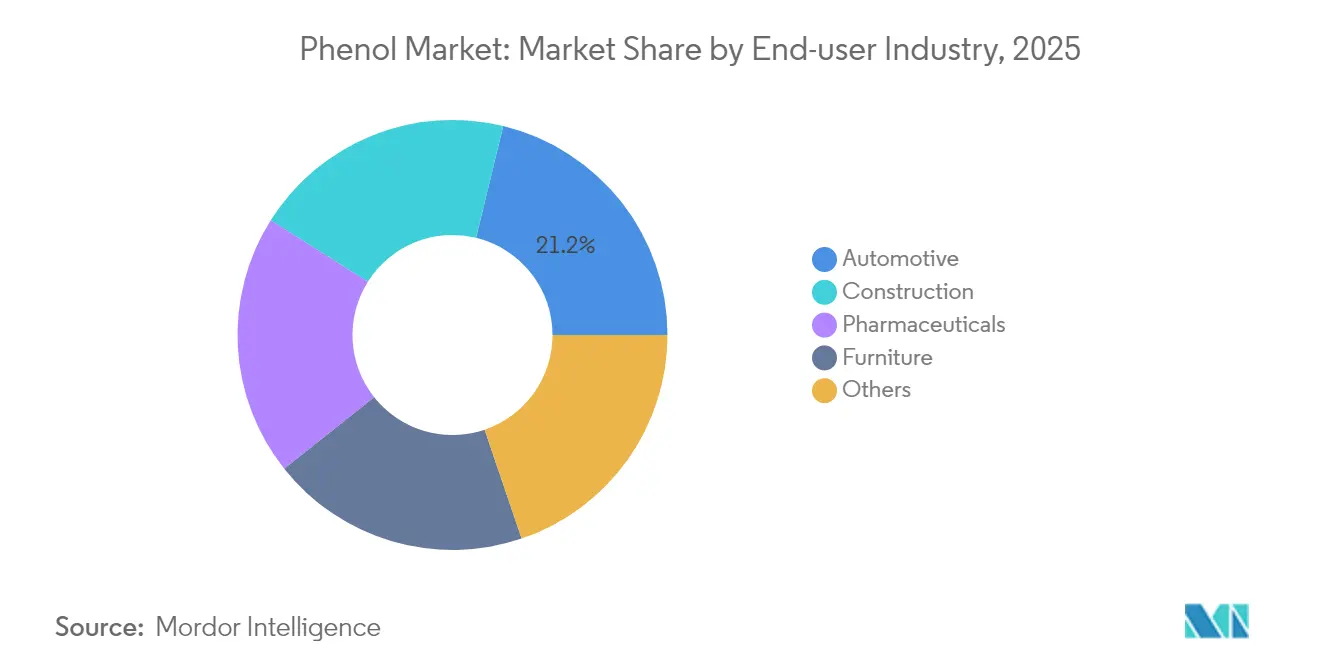
Automotive Leadership Amid Pharma AccelerationThe automotive sector consumed 21.21% of phenol in 2025, a share that is likely to hold steady as electric-vehicle architectures intensify use of phenolic composites in battery casings and under-floor protection panels. The phenol market size tied to automotive applications is forecast to rise 3.32% annually through 2031, driven by Asian vehicle output and North American electrification mandates. Construction remains the second-largest consumer, anchored by phenolic insulation boards that meet stringent fire and energy codes in Europe and increasingly in U.S. states adopting the International Building Code 2025 edition. Pharmaceutical uses, while smaller, clock the fastest 5.18% CAGR as antiseptic demand sustains post-pandemic healthcare spending. Purified phenol also serves as a key intermediate in analgesic and derivate synthesis, drawing premium pricing.
Furniture makers deploy phenolic resins in engineered wood and decorative laminates, with demand linked to residential renovation cycles and the rise of multipurpose home-office spaces. Electronics, adhesive formulations, and specialty chemical blends fall under “Others,” reflecting diverse outlets that grant producers a hedge against cyclical slowdowns in any single sector. Regulatory agencies such as the FDA and European Medicines Agency dictate pharmaceutical-grade phenol purity, prompting investment in dedicated separation trains that bolster value capture. Overall, end-user diversification softens volatility in the phenol market and supports steady consumption growth across the forecast period.
Geography Analysis
APAC Phenol Market
Asia-Pacific retained 53.94% of phenol market size in 2025, buoyed by China’s massive oil-to-chemicals complexes that achieve 40% chemical yield versus traditional 15-20% refinery lines. India’s USD 1.1 billion Gujarat project will add phenol, acetone, and BPA capacity by 2027, aligning with the country’s “Make in India” strategy for chemical self-sufficiency. Japan and South Korea supply high-end downstream derivatives, especially optical-grade polycarbonate and high-heat phenolic compounds for electronics, while ASEAN nations feed rising construction and furniture sectors. These market dynamics ensure Asia-Pacific remains the principal demand and supply node.
North America Phenol Market
North America faces feedstock-induced volatility yet benefits from abundant shale gas that supports competitive acetone co-product pricing. However, refinery shutdowns have tightened propylene supply, compressing margins and prompting talks of tolling arrangements for split-feed cumene units. U.S. tariff policies and anti-dumping duties could offer temporary relief against surging Asian imports, although sustained competitiveness will depend on energy-efficiency investments and potential bio-propylene partnerships.
EMEA and South America Phenol Market
Europe’s phenol producers grapple with high energy costs and environmental regulations, prompting consolidation efforts such as LyondellBasell’s review of six assets. The continent’s demand outlook is further clouded by BPA restrictions and aggressive climate targets that favor bio-based alternatives. Middle East and Africa represent the fastest-growing region at a 5.42% CAGR, anchored by integrated refinery-petrochemical complexes in Saudi Arabia and the UAE that exploit favorable feedstock economics and proximity to Asian import hubs. South America is comparatively small but stable, with Brazil absorbing most phenol for automotive brake components and construction insulation boards. Economic reforms in Argentina could unlock modest upside, yet currency volatility remains a near-term risk. Collectively, geographic rebalancing underpins diverse growth vectors that reinforce a global phenol market.
Regulatory Landscape
Phenol production and downstream uses are shaped by chemical safety and hazard-communication regimes that affect labeling, workplace handling, and market access. In the European Union, phenol is managed under REACH registration obligations (via ECHA) and classified through the CLP framework (Regulation (EC) No 1272/2008). The revised CLP Regulation entered into force in December 2024, tightening hazard classification, labeling, and packaging expectations for hazardous substances and mixtures across the supply chain.
In the United States, TSCA requirements influence phenol-adjacent chemistries used in flame retardants and plastic additives. EPA finalized revisions in November 2024 to the TSCA PBT rules for Phenol, Isopropylated Phosphate (3:1) (PIP (3:1)) (40 CFR Part 751), with the revision effective in early 2025. This reinforces compliance expectations for manufacturers, importers, and downstream users of covered phenolic phosphate chemistries.
Value Chain Analysis
The phenol value chain begins with upstream petrochemical feedstocks, primarily benzene and propylene, which are converted through cumene manufacture into phenol. The dominant manufacturing route is the cumene (Hock) process, where benzene alkylation with propylene forms cumene, followed by oxidation to cumene hydroperoxide and cleavage to produce phenol with acetone as the main co-product. As a result, acetone availability and placement are important commercial levers.
Midstream activities include phenol purification and logistics (tank storage and bulk transport), while downstream conversion captures most value. Key downstream streams include bisphenol-A (for polycarbonates and epoxy resins), phenolic resins (construction, wood products, insulation), and caprolactam/nylon intermediates. Integrated producers with advantaged feedstock positions and co-product optimization typically hold cost leadership; INEOS Phenol is a major global supplier with facilities in Antwerp (Belgium), Gladbeck/Marl (Germany), and Mobile (USA), illustrating how multi-site production networks support regional supply reliability and customer qualification requirements.
Competitive Landscape
The phenol market is moderately concentrated, with the top five producers accounting for roughly 55% of installed capacity. Integrated players such as SABIC, INEOS, and Mitsubishi Chemical leverage captive benzene and propylene supplies to operate at lower unit costs, while Chang Chun, LG Chem, and Kumho P&B focus on regional downstream integration. SABIC’s Fujian complex showcases the shift toward Asian mega-sites with energy-efficient architectures based on KBR technology that recycles 99% of process water and reduces CO₂ by 400 kg per ton of phenol[2]. LyondellBasell’s planned asset divestitures in Europe highlight margin pressures in high-cost jurisdictions and signal a potential eastward shift of production capacity.
Strategic moves in 2024–2025 include Deepak Nitrite’s investment in Gujarat and Stora Enso advancing NeoLigno® binder commercialization, each demonstrating divergent pathways—scale integration versus specialty innovation—for value creation in the phenol market. Technology licensors emphasize high-selectivity oxidation catalysts and advanced heat-integration schemes capable of 12% power consumption cuts compared with 2018-vintage lines. ESG compliance and customer carbon audits increasingly influence contract awards, favoring operators with renewable-powered plants or life-cycle-assessed low-carbon phenol. Suppliers that can certify chain-of-custody integrity through blockchain platforms are likely to secure premium long-term offtake agreements with multinational OEMs. Overall competitive intensity will remain elevated, particularly in Asia-Pacific, where new entrants backed by state-owned energy firms benefit from low interest rates and subsidized infrastructure.
Phenol Industry Leaders
-
INEOS Group
-
Moeve
-
Mitsubishi Chemical Group Corporation
-
Kumho P&B Chemicals Inc.
-
LG Chem
- *Disclaimer: Major Players sorted in no particular order

Phenol Market Companies Covered in this Report
- AdvanSix Inc.
- Altivia
- Chang Chun Group
- Deepak Nitrite Ltd
- Domo Chemicals GmbH
- Formosa Chemicals and Fibre Corp.
- INEOS Group
- Kumho P&B Chemicals Inc.
- LG Chem
- LyondellBasell Industries N.V.
- Mitsubishi Chemical Group Corporation
- Mitsui Chemicals Inc.
- Moeve
- PTT Phenol Company Limited
- SABIC
- Solvay
Market Opportunities and Future Outlook
Opportunities are strongest where integrated phenolics projects reduce exposure to external propylene availability and improve co-product economics. India is a specific example: Haldia Petrochemicals has advanced an approximately INR 6,000 crore phenol and acetone complex in West Bengal, including an on-purpose propylene unit (OCT). The company expanded the project scope via a license amendment, lifting planned phenol capacity from 300 KTPA to 345 KTPA, with targeted completion in Q1 2026. This integration directly addresses the feedstock volatility constraint highlighted by refinery and propylene capacity changes in multiple regions.
A second opportunity area is lower-carbon and circular phenol supply for customers that apply carbon audits to polymers and resins. Market participants have started offering renewable, ISCC-certified phenol and are evaluating new oxidation pathways, including academic work assessing the use of recovered N2O as an oxidant for phenol production. Alongside established energy-reduction retrofits in conventional cumene units, these moves create room for differentiated grades and contract structures tied to chain-of-custody and verified carbon intensity, particularly for BPA/polycarbonate and phenolic resin converters serving electronics, automotive, and building materials specifications.
Recent Industry Developments in Phenol Market
- June 2026: INEOS Phenol announced that the restart of its Doel (Antwerp) phenol plant has been postponed indefinitely, citing continued volatility in European and global market conditions. The change delays a previously communicated late-2027 restart timeline and reinforces a more cautious approach to capacity returns in high-cost regions.
- January 2025: Mitsui Chemicals and Mitsubishi Chemical Group launched a joint study focused on improving stable supply of phenol-related products in Japan, including measures around maintenance and logistics rationalization. The collaboration points to coordinated supply resilience in a mature market facing operational and cost pressures.
- April 2024: Mitsui Chemicals decided to close its 190,000-ton phenol plant at Ichihara Works by fiscal year 2026. The planned shutdown tightens domestic capacity and increases the importance of supply planning, imports, and inter-company arrangements for phenol and derivative chains in Japan.
Phenol Market Report Scope and Research Methodology
Market Definition and Coverage
This market covers the sale of phenol as a chemical commodity, counted as the value of phenol supplied to downstream users across major producing and consuming regions, with trade flows reflected where they change regional availability.
Scope exclusions: Excludes the value of downstream derivatives and finished products (such as BPA, phenolic resins, caprolactam, and polycarbonates) so the totals do not double count conversion steps.
Segments Covered in This Report
- By Product Type
- Bisphenol-A
- Phenolic Resins
- Caprolactam
- Others
- By End-user Industry
- Automotive
- Construction
- Pharmaceuticals
- Furniture
- Others
- By Geography
- Asia-Pacific
- China
- India
- Japan
- South Korea
- ASEAN Countries
- Rest of Asia-Pacific
- North America
- United States
- Canada
- Mexico
- Europe
- Germany
- United Kingdom
- France
- Italy
- Russia
- NORDIC Countries
- Rest of Europe
- South America
- Brazil
- Argentina
- Rest of South America
- Middle East and Africa
- Saudi Arabia
- South Africa
- Rest of Middle East and Africa
- Asia-Pacific
Data Sources, Market Sizing, and Validation
Desk Research
For desk work, we start by mapping supply and demand signals that can be checked outside of paid content. Public sources such as national customs and trade statistics portals, UN Comtrade, and chemical trade association releases help us understand import-export direction, key hubs, and typical grade movements.
To anchor the operating environment, we also refer to sources such as the USGS where relevant, government environment and safety publications (for example, OSHA and EPA materials on handling and reporting), and peer reviewed chemistry and process journals that clarify production routes and typical yields. Company annual reports, investor presentations, and reputable press are then used to validate capacity additions, turnarounds, and regional operating rates, and we also use a paid subscription for company financials and intelligence plus an import-export shipment level database where it improves consistency checks. These desk research sources are illustrative only, and many other public documents were also used for data collection, clarification, and cross verification.
Primary Interviews and Surveys
Primary work was used to pressure test the desk assumptions on regional pricing behavior, plant utilization patterns, and how contract versus spot mix shifts during tight or long markets. Interviews and structured surveys were conducted with producers, distributors, and procurement teams at downstream users, along with industry specialists across APAC, EMEA, and the Americas, so gaps in trade data, capacity timing, and margin pass through could be closed.
Distribution of primary research fieldwork respondents
| Company type | Respondent position | Region |
|---|---|---|
| Top tier: 30% | CXOs: 19% | APAC: 42% |
| Mid tier: 49% | Functional/Unit leaders: 21% | EMEA: 33% |
| Smaller Players: 21% | Managers: 60% | Americas: 25% |
Market-Sizing & Forecasting
Sizing is built using a top-down model where regional phenol demand is reconstructed from derivative production linkages, adjusted for net trade and typical conversion yields, and then translated into market value using region specific price series. To keep the result realistic, we corroborate totals with selective bottom-up checks, including sample supplier and distributor revenue patterns, capacity and utilization roll ups, and ASP times volume sense checks in key countries.
Inputs are kept simple and repeatable. They include installed phenol capacity and announced start ups, operating rate ranges by region, import-export balances, phenol contract and spot price direction, and major downstream pull indicators like BPA and phenolic resin run rates (used as demand drivers, not as revenue counted inside the market). Forecasts were formed using scenario analysis supported by short cycle price and operating rate expectations from primary experts, followed by a smoothing step so abnormal spikes do not distort the forward curve. When a local data point is missing, we fill the gap using nearest hub pricing, trade parity logic, and conservative utilization assumptions, and then the impact is rechecked in validation.
Data Validation & Update Cycle
Validation is done through multiple passes that compare modeled consumption and value totals against independent signals such as capacity utilization ranges, trade intensity, and known commissioning or outage timelines. Large variances are flagged, and the assumptions behind prices, yields, and net trade are reworked before sign off, with targeted re contacts triggered when a new plant startup, shutdown, or policy event materially shifts supply or demand.
Before release, an analyst review is completed to ensure the numbers reconcile across regions and do not create impossible supply-demand balances. Reports are refreshed annually, and interim updates are made when major events occur, followed by a final pre delivery pass so clients receive the latest updated view.
Mordor Intelligence's Phenol Market Size Compared Against Other Published Estimates
Published phenol market values can look far apart because firms do not always count the same thing, and they also use different price decks, currency timing, and base years. In this study, we keep the build traceable to supply-demand signals that can be checked, and then we validate the outputs with industry feedback.
Downstream derivatives and finished products (such as BPA and phenolic resins) sit outside Mordor Intelligence's scope, which is why value based estimates that bundle derivative revenue can look much larger even when the underlying phenol tonnage trend is similar. Gaps also come from how prices are formed, since some sources apply a single global ASP, while our model uses regional pricing and trade parity checks to avoid overstating value in lower priced hubs.
Benchmark comparison
| Source | Market Size | Gaps in Research Methodology |
|---|---|---|
| Mordor Intelligence | USD 12.46 M (2025) | |
| Trade Journal A | USD 12.75 B (2024) | Uses a value definition that is not clearly separated from downstream value capture, and the base year and currency conversion timing differ, which can inflate the reported total versus a phenol-only revenue view. |
| Regional Consultancy B | USD 28.60 B (2024) | Appears to include a wider pool of product and application revenue around phenol derivatives, and applies broad segmentation with limited visibility on yield, trade adjustments, and regional price differences. |
The spread across the three figures is mainly explained by whether the estimate stays at phenol revenue only or extends into derivative value, followed by how regional prices and trade are treated. By tying demand to derivative run rates but not counting derivative revenue, and then aligning value to regional price signals with cross checks, the final market number stays balanced and easier to replicate.
Key Questions Answered in the Report
What is the projected volume demand for phenol by 2031?
Global consumption is expected to reach 15.01 million tons by 2031, reflecting a 3.16% CAGR from 2026.
Which region will contribute the most incremental phenol demand through 2031?
Asia-Pacific, led by China and India, will supply the bulk of new demand due to integrated petrochemical expansions and downstream manufacturing growth.
How will Europe’s BPA food-contact ban affect phenol producers?
The regulation removes nearly 20% of regional BPA demand, compelling producers to redirect volumes to Asia or pivot toward non-food applications.
What role do bio-based routes play in future phenol supply?
Bio-propylene and lignin-derived phenolics could cut product carbon intensity up to 80%, and early adopters may secure price premiums as ESG standards tighten.