
Pharmacy Benefit Management Market Size and Share
Market Overview
| Study Period | 2020 - 2031 |
|---|---|
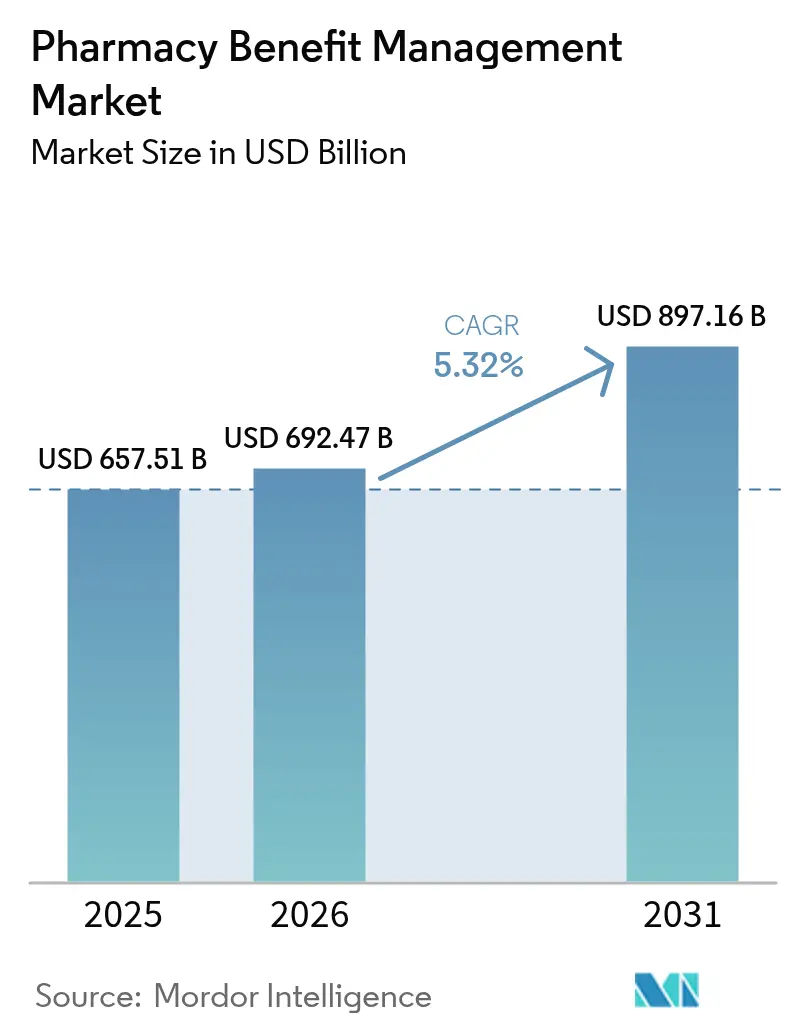
| Market Size (2026) | USD 692.47 Billion |
| Market Size (2031) | USD 897.16 Billion |
| Growth Rate (2026 - 2031) | 5.32 % |
| Fastest Growing Market | Asia-Pacific |
| Largest Market | North America |
| Market Concentration | High |
Major Players *Disclaimer: Major Players sorted in no particular order Image © Mordor Intelligence. Reuse requires attribution under CC BY 4.0. | |
Pharmacy Benefit Management Market Analysis by Mordor Intelligence
The pharmacy benefit management market size is expected to grow from USD 657.51 billion in 2025 to USD 692.47 billion in 2026 and is forecast to reach USD 897.16 billion by 2031 at 5.32% CAGR over 2026-2031. Rising prescription-drug spending—now 27.0% of employer medical outlays—underscores the growing reliance on PBMs for cost control. The upswing also reflects surging specialty-drug utilization, accelerated employer scrutiny of benefit contracts, and technology investments that streamline claims and prior authorization workflows. North America leads the Pharmacy Benefit Management market with 46.3% revenue share, while Asia Pacific records the fastest growth as coverage expands in China and India. Competitive intensity remains high as vertically integrated PBMs consolidate buying power, even as transparent newcomers chip away at rebate-driven models.
Key Report Takeaways
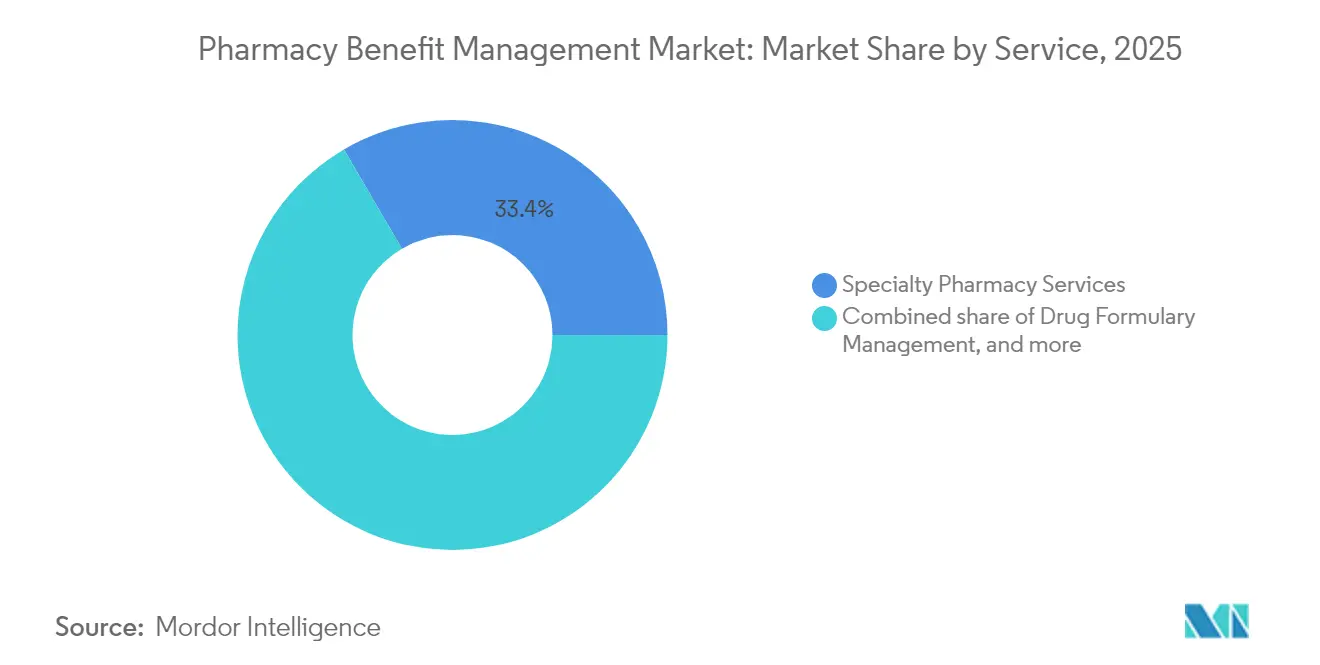
- By service, specialty pharmacy services led with 33.42% revenue share in 2025, whereas claims processing & adjudication is poised for a 7.12% CAGR through 2031.
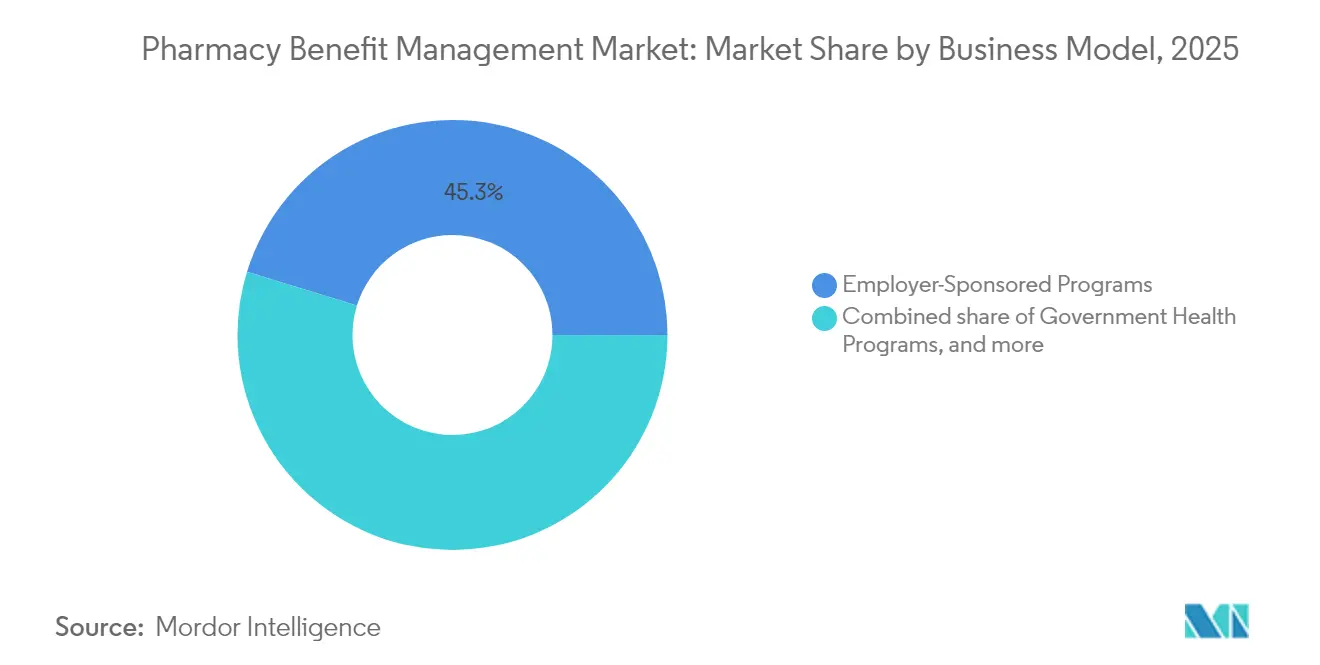
- By business model, employer-sponsored programs controlled 45.25% of the pharmacy benefit management market share in 2025; government health programs show the quickest rise at a 6.45% CAGR to 2031.
- By end user, PBM organizations and retail pharmacies jointly held 75.00% share in 2025; Mail-order pharmacies are projected to expand at an 7.78% CAGR through 2031.
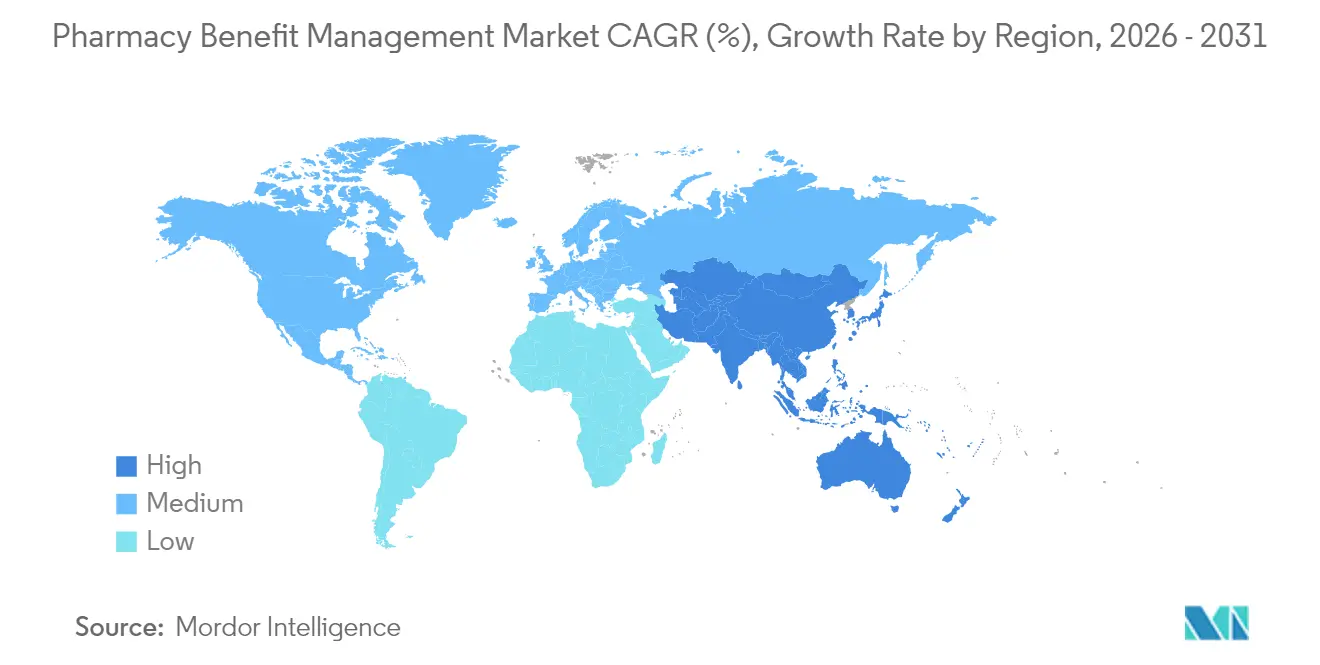
- By region, North America dominated with 45.88% in 2025, whereas Asia Pacific is expected to log a 7.29% CAGR, lifting the region to USD 159.86 billion by 2031.
Note: Market size and forecast figures in this report are generated using Mordor Intelligence’s proprietary estimation framework, updated with the latest available data and insights as of 2026.
Market Trends and Insights
Drivers Impact Analysis of Pharmacy Benefit Management Market*
| Drivers Impact Analysis | (~) % Impact on CAGR Forecast | Geographic Relevance | Impact Timeline |
|---|---|---|---|
| Escalating specialty-drug costs | +1.9% | Global | Long term (≥ 4 years) |
| Expansion of public & private coverage pools | +1.3% | North America, Asia Pacific | Medium term (2-4 years) |
| Shift to value-based pharmacy benefits | +1.1% | North America, Europe | Medium term (2-4 years) |
| Digital transformation & workflow automation | +0.9% | Global | Short term (≤ 2 years) |
| Rising demand for cost transparency & pass-through pricing models | +1.0% | North America, Europe | Short term (≤ 2 years) |
| Consolidation & vertical integration across the drug-supply chain | +0.8% | North America | Long term (≥ 4 years) |
| Source: Mordor Intelligence | |||
Escalating Prescription-Drug Expenditure & Therapeutic Complexity
Specialty medicines accounted for 54% of hospital drug spend in 2025, pressuring payers to adopt PBM models that integrate clinical expertise with utilization controls. The popularity of GLP-1 agonists for diabetes and obesity may lift that therapeutic class toward USD 100 billion within five years, requiring tighter formulary rules and step-therapy edits. Oncology pipelines and orphan drugs compound complexity, while multimorbidity drives polypharmacy across age cohorts. PBMs deploying advanced analytics can coordinate regimens, flag duplication, and negotiate indication-based contracting that balances outcomes with affordability. These pressures support sustained demand for Pharmacy Benefit Management market solutions through 2030.
Expansion of Public & Private Health-Coverage Pools
Medicare Part D is forecast to reach 36% of U.S. drug spending by 2032, up from 2024 levels. The Inflation Reduction Act caps out-of-pocket Part D costs at USD 2,000 for 18.7 million members beginning in 2025. Commercial employers are simultaneously re-bidding contracts, with 52% exploring new PBM partners within three years. As coverage pools widen, PBMs that master disparate formulary rules, vaccine mandates, and reporting obligations gain scale advantages. Ongoing enrollment growth in India’s Ayushman Bharat and China’s urban employee insurance adds regional tailwinds, enhancing the Pharmacy Benefit Management market outlook.
Shift Toward Value-Based & Outcome-Linked Pharmacy Benefits
Performance-based reimbursement models are moving beyond pilots, with 54% of executives expecting at least a 50% jump in outcome-based contracts by 2025. PBMs apply predictive analytics to risk-stratify members, trigger adherence interventions, and quantify avoided downstream costs. Real-world evidence supplements RCT data in drug evaluations, informing indication-based pricing and shared-savings mechanisms. Transparent metrics improve employer trust and may temper legislative calls for stricter PBM oversight. Value-based designs also encourage manufacturers to back clinical promises with refund or replacement guarantees, reinforcing Pharmacy Benefit Management market innovation.
Digital Transformation & Workflow Automation in PBM Operations
Seventy-seven percent of health leaders rank artificial intelligence as a top technology priority for 2025. Cloud-native claim engines speed prior authorization approvals, flag fraud, and cut average adjudication costs per script. Capital Rx’s Judi Health platform unites medical and pharmacy claims, breaking data silos that inflate total cost of care. Automation frees pharmacists for clinical counseling, raises throughput in mail facilities, and supplies employers near real-time spend dashboards. These advances support the 7.5% CAGR forecast for Claims Processing services and deepen the digital moat of the Pharmacy Benefit Management market.
Restraints Impact Analysis of Pharmacy Benefit Management Market*
| Restraints Impact Analysis | (~) % Impact on CAGR Forecast | Geographic Relevance | Impact Timeline |
|---|---|---|---|
| Intensifying legislative & regulatory scrutiny | −1.4% | North America, Europe | Short term (≤ 2 years) |
| Erosion of rebate economics from biosimilar & generic competition | −1.1% | Global | Long term (≥ 4 years) |
| Litigation & margin pressure from independent-pharmacy/DIR reform | −1.0% | North America | Short term (≤ 2 years) |
| Data-privacy & interoperability barriers limiting advanced analytics | −0.8% | Global | Medium term (2-4 years) |
| Source: Mordor Intelligence | |||
Intensifying Legislative & Regulatory Scrutiny of PBM Practices
State legislatures introduced 34 targeted PBM bills for the 2025 session, covering spread pricing bans and audit rights. The FTC’s January 2025 interim report claimed the Big Three captured USD 7.3 billion in excess specialty generic markups between 2017 and 2022. Federal proposals, such as the Patients Before Monopolies Act, would separate PBMs from insurer and pharmacy affiliates, raising structural risk for vertically integrated firms. Compliance costs and contract renegotiations may trim margins and slow acquisition pipelines, tempering Pharmacy Benefit Management market expansion in the near term.
Erosion of Rebate Economics from Biosimilar & Generic Competition
Humira biosimilars flooded formularies in 2025, eroding rebate pools that underpinned PBM revenue streams. The gross-to-net gap for branded drugs hit USD 334 billion in 2023 but is narrowing as payers redirect rebates to premium relief. Medicare price-negotiation authority limits rebate leverage on high-spend therapies, while employers push for pass-through models like CVS Health’s CostVantage that surrender 100% of rebates by 2028. PBMs must cultivate alternative revenue—clinical programs, data analytics, and optional administrative fees—reducing reliance on rebates and reshaping long-term Pharmacy Benefit Management market economics.
*Our forecasts treat driver/restraint impacts as directional, not additive. The impact forecasts reflect baseline growth, mix effects, and variable interactions.
Pharmacy Benefit Management Market Segment Analysis
By Service:
Claims Processing Drives Digital TransformationSpecialty Pharmacy Services captured 33.42% of 2025 revenue as complex biologics proliferated in oncology and rare-disease care. Unified care teams, cold-chain logistics, and adherence coaching define this high-touch service line, anchoring the Pharmacy Benefit Management market size leadership among service categories. Claims Processing & Adjudication is projected to grow at 7.12% CAGR to 2031, powered by AI-enabled claim engines that curtail error rates and flag wasteful spending. Capital Rx’s February 2025 launch of Judi Health™ exemplifies the shift to integrated, cloud-native platforms that reconcile medical and pharmacy claims in real time.
Drug Formulary Management continues to pivot from price-tier grids to outcome-centric scorecards that weight real-world evidence and patient-reported metrics. Benefit Plan Design & Consultation helps employers evaluate copay maximizer programs and GLP-1 coverage carve-outs as that class gains weight-management indications. Together, these advisory services supplement transaction-based revenue and support wider adoption of transparent pass-through arrangements across the Pharmacy Benefit Management market.


By Business Model:
Government Programs Reshape Market DynamicsEmployer-Sponsored Programs retained 45.25% market share in 2025, mirroring the central role of job-based insurance in U.S. healthcare. Heightened C-suite focus on drug inflation steers demand toward pass-through pricing, formulary exclusions, and value-based guarantees that limit budget surprises. The Pharmacy Benefit Management market size for Government Health Programs is forecast to advance at a 6.45% CAGR, aided by Medicaid expansion and the out-of-pocket cap in Medicare Part D.
Commercial Health-Insurance Management blends provider-sponsored plans and exchange products, requiring PBMs to synchronize benefit rules across metallic tiers. Direct-to-Consumer Discount-Card Programs proliferate through digital apps that post NADAC-based prices and offer mail-delivery perks. Mark Cuban’s Cost Plus movement underscores consumer appetite for transparent cash pricing, nudging incumbents to modernize benefit designs within the broader Pharmacy Benefit Management market.
By End User:
Mail-Order Pharmacies Accelerate GrowthPBM Organizations and Retail Pharmacies together controlled 75.00% of dispensing revenue in 2025, reflecting durable store networks and vertically integrated ownership. The Pharmacy Benefit Management market share of Mail-Order Pharmacies is on track to expand fastest, at an 7.78% CAGR, as home delivery aligns with chronic-care adherence programs and Medicare’s 90-day supply incentives. FTC analysis shows PBM-owned mail pharmacies received reimbursements up to 200-times higher than independents for select oncology products, intensifying policy debate.
Hospital systems pursue specialty-pharmacy accreditation to capture infusion margins and coordinate value-based bundles. Telehealth entrants pair virtual prescribing with automated dispensing centers, widening access and reinforcing the omnichannel direction of the Pharmacy Benefit Management market.
Geography Analysis
North America Pharmacy Benefit Management Market
North America led with 45.88% of 2025 revenue, anchored by U.S. drug-spend intensity and deep PBM penetration. The region’s oligopolistic PBM triad prompts policy activism, evident in 170 state bills introduced in 2024 to curb spread pricing and clawbacks Bloomberg Law. Inflation Reduction Act provisions that start in 2025 reshape formulary math, prompting contract rewrites and shifting rebate flows within the Pharmacy Benefit Management market.
EMEA and South America Pharmacy Benefit Management Market
Asia Pacific registers a 7.29% CAGR outlook, the fastest globally. China alone is projected to hit USD 159.86 billion by 2031 on rising chronic-disease prevalence and policy moves to centralize bulk-drug procurement. India’s growth stems from the Production-Linked Incentive scheme and expansion of Jan Aushadhi generic outlets to 10,500 by March 2025. Japan’s focus on biopharmaceutical R&D and value-based reimbursement may lift specialty-drug uptake, extending scope for PBM-like services despite demographic headwinds. Europe maintains sizable volume under reference-pricing rules and HTA frameworks. Germany’s AMNOG negotiations and the UK’s Voluntary Scheme for Branded Medicines Pricing push PBMs to demonstrate cost-offsets beyond list-price concessions. Middle East & Africa and South America contribute modest shares but display accelerating demand as mandatory health-insurance models roll out. Brazil’s unified procurement of high-cost drugs underscores the region’s appetite for centralized benefit management within the global Pharmacy Benefit Management market.

Regulatory Landscape
PBMs face heightened oversight in the United States, with federal agencies and lawmakers focusing on pricing and vertical integration practices that shape employer and government drug spend. In January 2025, the Federal Trade Commission (FTC) issued an interim staff report alleging the three largest PBMs generated USD 7.3 billion in specialty generic dispensing markups between 2017 and 2022, adding momentum behind transparency measures, audit-rights, and spread-pricing restrictions.
On the Medicare side, CMS finalized Contract Year 2026 policy and technical changes, effective June 3, 2025, to operationalize Part D updates, including the Medicare Prescription Payment Plan that lets beneficiaries smooth out-of-pocket costs across monthly installments. In February 2026, the Consolidated Appropriations Act, 2026 introduced federal PBM reforms that delink Medicare Part D PBM compensation from drug prices or rebates, while pushing commercial arrangements toward fuller rebate pass-through, tightening compliance and reporting expectations for PBMs and plan sponsors.
Value Chain Analysis
The PBM value chain starts with plan sponsors and payers, including employers, Medicare Part D plan sponsors, Medicaid managed-care organizations, and commercial health insurers, who set benefit goals and delegate administration to PBMs. In that operating model, PBMs manage formulary and rebate contracting with manufacturers, network contracting with retail and specialty pharmacies, and clinical programs such as utilization management and adherence interventions, supported by claims processing and adjudication infrastructure; dispensing occurs through retail, mail-order, and specialty-pharmacy channels, increasingly within vertically integrated groups linked to insurers and pharmacy assets.
Monetization and cash flow depend on administrative fees, spread and/or pass-through pricing, and manufacturer rebates and other remuneration, while data and analytics support prior authorization, fraud detection, and outcome-linked programs. Regulatory actions are changing incentives and handoffs across the chain: the Consolidated Appropriations Act, 2026 targets compensation delinking and rebate pass-through, while the U.S. Department of Labor proposed ERISA-focused PBM fee-disclosure requirements in January 2026, increasing the need for more standardized reporting to employer fiduciaries. FTC scrutiny and related actions involving large PBM-affiliated entities also raise transparency expectations, influencing contracting terms among PBMs, pharmacies, and plan sponsors.
Competitive Landscape
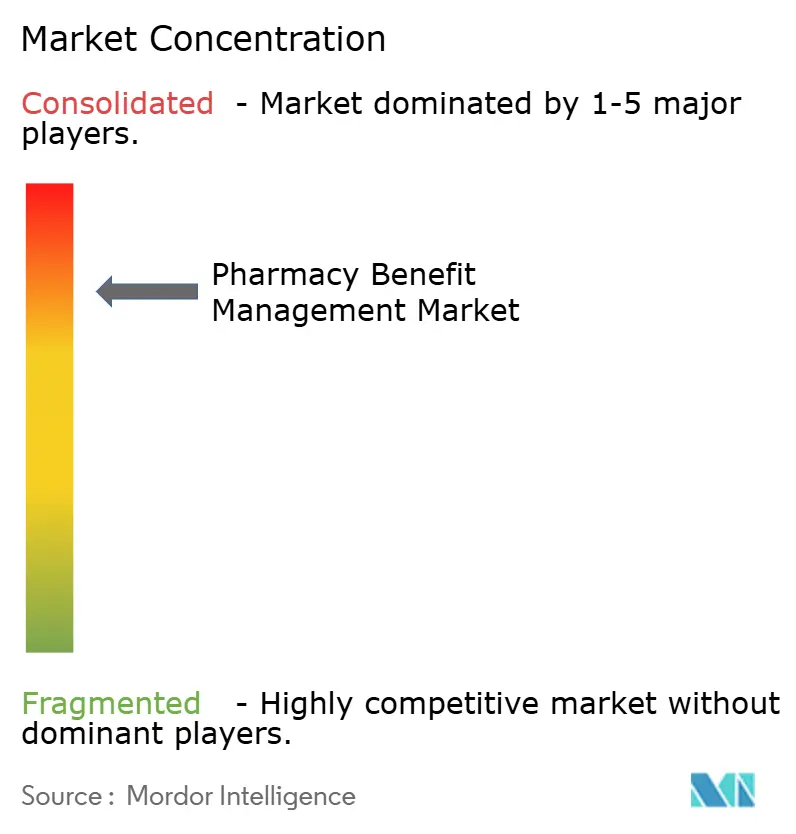
The Pharmacy Benefit Management market remains highly concentrated: CVS Caremark, Express Scripts, and OptumRx processed about 80% of U.S. claims in 2024. Vertical integration binds these PBMs to insurers and retail or mail pharmacies, bolstering negotiating leverage yet raising conflict-of-interest concerns. The American Medical Association flagged potential anticompetitive risk in markets where the top two PBMs handle 80-90% of scripts[3]American Medical Association, “New AMA Analysis of Consolidation in PBM Markets,” ama-assn.org.
Strategic priorities emphasize scale economics, specialty-drug network control, and data lake investments that fuel predictive adherence interventions. CVS reported that 75% of commercial members adopted two or more features of its TrueCost suite by late 2024, signaling traction for fee-based, pass-through models. Express Scripts advances digital pharmacy channels, while OptumRx integrates behavioral-health datasets to improve medication safety.
Challenger PBMs—Capital Rx, SmithRx, Navitus—win share through transparent network pricing and low fixed fees. Capital Rx’s National Average Drug Acquisition Cost index feeds a clearinghouse model that aligns acquisition costs with client invoices, drawing interest from regional Blues plans. Start-ups test AI-driven prior-auth bots and consumer coupon engines, widening the innovation funnel for the Pharmacy Benefit Management market.
Regulatory scrutiny sharpens competitive risk. The FTC’s January 2025 report could spur structural remedies, while congressional hearings examine mail-pharmacy reimbursement disparities. Incumbents are diversifying into home-infusion, digital therapeutics, and primary-care alignment to offset margin compression, signaling an era of adaptive repositioning.
Pharmacy Benefit Management Industry Leaders
Optum Inc.
CVS Health (Caremark)
Express Scripts (Cigna Evernorth)
Humana Pharmacy Solutions
Prime Therapeutics LLC
- *Disclaimer: Major Players sorted in no particular order
Pharmacy Benefit Management Market Companies Covered in this Report
- Optum
- CVS Health (Caremark)
- Express Scripts (Cigna Evernorth)
- Humana Pharmacy Solutions
- Prime Therapeutics LLC
- Elevance Health (CarelonRx)
- Centene Corp. (Envolve Health)
- MedImpact Healthcare Systems
- Magellan Rx Management
- SS&C Technologies Inc.
- Elixir Rx Solutions LLC
- Abarca Health
- Navitus Health Solutions
- Benecard Services LLC
- ProCare Rx
- CaptureRx
- ClearScript (Fairview)
- Change Healthcare (Optum Insight)
- Kroger Prescription Plans

Market Opportunities and Future Outlook
Transparency-first contracting is a current whitespace as plan sponsors respond to federal reforms and enforcement scrutiny that limit rebate- and spread-driven economics. The Consolidated Appropriations Act, 2026 lays out a compliance pathway toward rebate, fee, and alternative-remuneration pass-through for contracts entered into or renewed on or after August 3, 2028, and the U.S. Department of Labor proposed ERISA fee-disclosure rules in January 2026, increasing demand for auditable PBM reporting to self-insured employer fiduciaries. In parallel, large incumbents are moving toward fee-based models, including Optum Rx introducing a transparent, fee-based pharmacy care model in May 2026, which creates openings for PBMs and platform providers that can operationalize delinked pricing, standardized disclosures, and real-time client dashboards.
Technology modernization is also a near-term commercial opportunity, as PBMs and payers invest in cloud-native claims engines and tighter integration of medical and pharmacy data to reduce administrative friction and support value-based pharmacy benefits. Capital Rxs Judi Health launch in February 2025 reflects demand for unified medical and pharmacy claims processing, and combinations such as Abarca Health and LucyRx (announced June 2026) point to buyer appetite for modern PBM platforms that can scale across commercial and government programs. With specialty drugs representing 54% of hospital drug spend in 2025 and employers reporting prescription drugs at 27.0% of medical outlays, PBMs that combine specialty-pharmacy services with outcome-linked contracting, interoperable data exchange, and auditable pricing structures have clearer differentiation under the current policy trajectory.
Recent Industry Developments in Pharmacy Benefit Management Market
- July 2026: CVS Caremark announced an agreement with the U.S. Federal Trade Commission to resolve ongoing matters tied to transparency and affordability in PBM practices. The commitments increased emphasis on reporting and clearer economics in rebate and network-contracting practices, reinforcing the market shift toward auditable PBM contracting models.
- May 2026: Optum Rx introduced a transparent, fee-based pharmacy care model that moved away from approaches linked to drug list prices or prescription volume. The program also outlined a transition of group purchasing to flat service fees by the end of 2027, supporting broader adoption of pass-through and delinked pricing constructs across client segments.
- March 2024: Prime Therapeutics and Capital Rx formed a strategic alliance aimed at improving claims-processing efficiency and increasing transparency. The partnership strengthened competitive positioning for modern, cloud-native PBM platforms by pairing payer-facing scale with newer adjudication and data capabilities.


Pharmacy Benefit Management Market Report Scope and Research Methodology
Market Definition and Coverage
This market covers the value of services provided to manage prescription drug benefits for plan sponsors, including benefit design support, claims processing, network management, and medication access programs (such as mail order and specialty pharmacy support).
Scope exclusions: stand-alone drug discount cards that do not manage a full prescription benefit are excluded from this market size.
Segments Covered in This Report
- By Service
- Specialty Pharmacy Services
- Drug Formulary Management
- Benefit Plan Design & Consultation
- Other Services
- By Business Model
- Government Health Programs
- Employer-Sponsored Programs
- Commercial Health-Insurance Management
- Direct-to-Consumer Discount-Card Programs
- By End User
- PBM Organizations (In-house & External)
- Mail-Order Pharmacies
- Retail Pharmacies
- Other End Users
- Geography
- North America
- United States
- Canada
- Mexico
- Europe
- Germany
- United Kingdom
- France
- Italy
- Spain
- Rest of Europe
- Asia-Pacific
- China
- Japan
- India
- South Korea
- Australia
- Rest of Asia-Pacific
- Middle-East and Africa
- GCC
- South Africa
- Rest of Middle East and Africa
- South America
- Brazil
- Argentina
- Rest of South America
- North America
Data Sources, Market Sizing, and Validation
Desk Research
We start by mapping how prescription benefits are administered and paid for across major health systems, since PBM revenues can be counted differently across payer types and countries. For the demand environment, we refer to public healthcare and prescription indicators from sources such as the OECD Health Statistics, the US Centers for Medicare and Medicaid Services (CMS), the US FDA (drug approvals and related public dashboards), and the World Bank (macro and health spend context). We also use policy and market structure signals from sources such as the US Federal Register and public materials from pharmacy and payer associations to understand benefit design trends and utilization management practices.
On the supply and commercial side, we review company filings, annual reports, earnings call transcripts, and investor presentations to capture service mix shifts (specialty, mail, rebates, and admin fees) and geographic exposure. A paid subscription for company financials and intelligence is used selectively to standardize reported revenue lines, and a patent database is used to track technology themes linked to claims adjudication and pharmacy network tools. The desk sources named above are illustrative and not exhaustive, and we also reviewed other public documents and datasets during data collection, validation, and research clarification.
Primary Interviews and Surveys
Primary work is used to pressure test how revenues are recognized and what is bundled into PBM contracts, since the same contract can include administration, spread, rebates, and pharmacy services in different ways. We speak with a mix of plan sponsor stakeholders, payer-side benefit leaders, PBM operations roles, and pharmacy channel participants across key regions, so our assumptions on penetration, pricing logic, and service boundaries can be validated and then tightened.
Distribution of primary research fieldwork respondents
| Company type | Respondent position | Region |
|---|---|---|
| Top tier: 36% | CXOs: 14% | APAC: 49% |
| Mid tier: 48% | Functional/Unit leaders: 41% | EMEA: 30% |
| Smaller Players: 16% | Managers: 45% | Americas: 21% |
Market-Sizing & Forecasting
Sizing is built mainly using a top-down structure where healthcare and prescription spending signals are reconstructed into an addressable prescription benefit administration pool, then adjusted for how much activity is managed through PBM-style contracting by region. We corroborate the totals with selective bottom-up approximations, such as sampled price-and-volume checks for core service buckets and cross-checks against public revenue disclosures where reporting is comparable.
A few practical variables are used as model inputs and treated as directional drivers rather than perfect measures. These include prescription volume growth and mix shifts toward specialty drugs, the share of insured lives under managed pharmacy benefits, rebate and discount behavior proxies reflected in payer commentary, mail-order and specialty fulfillment penetration, and policy changes that affect reimbursement and transparency requirements. Where country-level data is patchy, we fill gaps with regionally similar benchmarks that are validated through interviews, and we apply conservative ranges so the model does not overreact to one-time spikes.
For forecasting, we rely on scenario analysis supported by exponential smoothing on the underlying drivers, since the market is sensitive to regulation, contracting changes, and specialty adoption waves. The forward view is anchored on expected utilization, benefit design tightening, and the pace of specialty growth, then reviewed with primary respondents to confirm that the direction and magnitude are realistic.
Data Validation & Update Cycle
We validate outputs by triangulating the model against independent signals, including region-level healthcare spend movement, prescription utilization direction, and the implied service intensity discussed in public payer and channel updates. Outliers are flagged, and the drivers are rechecked so currency timing, double counting risk, and unusual one-time items do not flow into the final totals.
Before sign-off, the work is reviewed in steps by another analyst, followed by a final consistency check across assumptions and growth rates.
Reports are refreshed annually, and interim updates are triggered when there are material events such as major policy changes, large contract moves, or shifts in specialty drug pipeline expectations. Right before delivery, we run a quick data pass to ensure the latest public information is reflected in the narrative and the market numbers.
Mordor Intelligence's Pharmacy Benefit Management Market Estimate Compared With Other Published Estimates
Published PBM market values can look far apart because some sources treat the market as mostly a US revenue pool, while others try to express a global value where contracting structures and reporting conventions differ. Differences also come from whether the estimate counts only benefit administration fees or also includes pharmacy economics inside integrated models.
Covered lives signals, prescription utilization direction, and public payer spending totals are used as boundary checks, and these checks are what link Mordor Intelligence's estimate to a defined global PBM activity pool where stand-alone discount cards are not counted and contract bundles are normalized before totaling.
Benchmark comparison
| Source | Market Size | Gaps in Research Methodology |
|---|---|---|
| Mordor Intelligence | USD 692.47 B (2026) | |
| Industry Journal A | USD 680.00 B (2029) | This figure is framed for the United States and uses a later forecast year, so it reflects a different geographic boundary and timing than a global 2026 estimate. |
| Academic Preprint B | USD 600.00 B (2024) | This number is described as exceeding a threshold and does not clearly separate what is counted inside PBM contracting bundles, which can shift totals depending on inclusions. |
Taken together, the spread is mainly explained by geography and what parts of the contract bundle are treated as PBM value. By anchoring the model on observable utilization and spending signals, then normalizing what is in scope before forecasting, the estimate stays easier to trace back to a repeatable set of inputs.


Key Questions Answered in the Report
What is the current size of the Pharmacy Benefit Management market?
The market reached USD 692.47 billion in 2026 and is projected to grow to USD 897.16 billion by 2031 at a 5.32% CAGR.
Why are specialty drugs so important to PBMs?
Specialty medicines represent 54.0% of hospital drug spend in 2025, so payers rely on PBMs for tailored clinical management and price negotiation .
How concentrated is the U.S. PBM sector?
CVS Caremark, Express Scripts, and OptumRx processed about 80% of U.S. prescription claims in 2024
What impact will the Inflation Reduction Act have on PBMs?
Beginning in 2025, Part D out-of-pocket costs are capped at USD 2,000, and price negotiations for selected drugs will alter rebate structures, reshaping PBM revenue models
Which service segment is expanding the fastest?
Claims Processing & Adjudication is forecast to grow 7.12% annually through 2031 as AI platforms streamline real-time decision making
Which region will see the quickest PBM growth?
Asia Pacific is projected to post a 7.29% CAGR, with China alone on track to reach USD 159.86 billion by 2031
Page last updated on:


 Your data is secure and never sold or shared.


