
Pharmacovigilance And Drug Safety Software Market Size and Share
Market Overview
| Study Period | 2020 - 2031 |
|---|---|
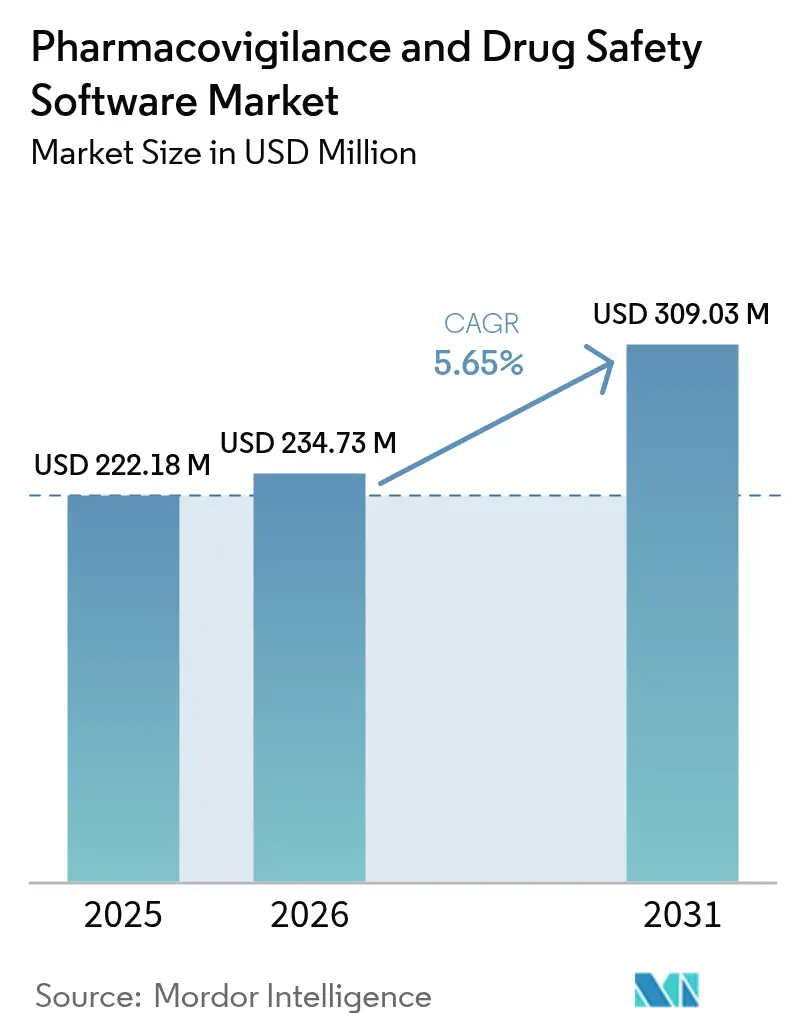
| Market Size (2026) | USD 234.73 Million |
| Market Size (2031) | USD 309.03 Million |
| Growth Rate (2026 - 2031) | 5.65 % |
| Fastest Growing Market | Asia Pacific |
| Largest Market | North America |
| Market Concentration | Medium |
Major Players *Disclaimer: Major Players sorted in no particular order Image © Mordor Intelligence. Reuse requires attribution under CC BY 4.0. | |
Pharmacovigilance And Drug Safety Software Market Analysis by Mordor Intelligence
The pharmacovigilance software market size in 2026 is estimated at USD 234.73 million, growing from 2025 value of USD 222.18 million with 2031 projections showing USD 309.03 million, growing at 5.65% CAGR over 2026-2031. Growth pivots on the transition from basic compliance systems to AI-enabled safety intelligence platforms that help sponsors evaluate real-world evidence in near-real time. Intensifying harmonization of global reporting rules, spearheaded by the FDA’s E2B(R3) mandate and the European Health Data Space Regulation, converts regulatory deadlines into non-discretionary IT spending.[1]Cloud adoption crosses 80% penetration among life-science firms, creating a preferred deployment backbone for modern safety databases. Meanwhile, explainable-AI modules that automate case triage lower processing costs by as much as 50%, giving early adopters an economic edge. Geopolitical stability in Asia Pacific, coupled with streamlined ethics approvals, is relocating a rising share of clinical trials eastward and lifting regional demand for advanced surveillance tools.
Key Report Takeaways
- By functionality, adverse event reporting led the pharmacovigilance software market with 40.22% of the share in 2025, while signal detection and risk management tools are poised to expand at an 17.5% CAGR through 2031.
- By mode of delivery, cloud and SaaS deployments captured 66.55% revenue share in 2025; the segment is growing at a 21.3% CAGR over the forecast period.
- By end user, pharmaceutical and biotechnology companies held 54.10% of the pharmacovigilance software market size in 2025, whereas business process outsourcing firms registered the fastest 17.2% CAGR.
- By geography, North America commanded 35.55% revenue share in 2025; Asia Pacific is forecast to post a 13.9% CAGR to 2031.
Note: Market size and forecast figures in this report are generated using Mordor Intelligence’s proprietary estimation framework, updated with the latest available data and insights as of 2026.
Market Trends and Insights
Drivers Impact Analysis of Pharmacovigilance And Drug Safety Software Market*
| Driver | (~) % Impact on CAGR Forecast | Geographic Relevance | Impact Timeline |
|---|---|---|---|
| Rising Incidence Of Adverse Drug Reactions (ADRs) | +0.70% | Global, with higher impact in aging populations of North America & Europe | Medium term (2-4 years) |
| Stringent Global E2B(R3)/IDMP Compliance Deadlines | +1.10% | Global, with immediate impact in US & EU regulatory jurisdictions | Short term (≤ 2 years) |
| Cloud-First Migration Of Safety Databases | +0.90% | North America & EU leading, APAC following rapidly | Medium term (2-4 years) |
| Explainable-AI Modules Slash Case-Processing Costs | +0.50% | Developed markets initially, expanding to emerging markets | Long term (≥ 4 years) |
| Real-World-Evidence (RWE) Integration For Early Signals | +0.60% | North America & EU pioneering, APAC adoption accelerating | Medium term (2-4 years) |
| Low-Code Localisation For Emerging-Market Forms | +0.40% | APAC core, spill-over to MEA and Latin America | Long term (≥ 4 years) |
| Source: Mordor Intelligence | |||
Rising Incidence of Adverse Drug Reactions (ADRs)
Escalating ADR prevalence reshapes demand for advanced monitoring as new molecular entities enter wider use. Cureus Journal data show the 21-40 age group now reports the highest ADR frequencies, reflecting greater polypharmacy and increased hospital interactions. With the FDA approving 50 new molecular entities in 2024, sponsors must surveil diverse patient sub-populations for previously unseen safety signals.[2] Biologics and gene therapies add complexity because reactions can vary across genetic backgrounds. Accordingly, the pharmacovigilance software market shifts from static report repositories toward real-world evidence engines capable of analyzing heterogeneous longitudinal datasets. Vendors that embed AI-powered pattern recognition into reporting workflows gain relevance because manual methods cannot keep pace with volume and complexity.
Stringent Global E2B(R3)/IDMP Compliance Deadlines
April 2026 marks the FDA’s cut-off for E2B(R3) submissions, forcing sponsors to abandon legacy R2 formats and invest in upgraded platforms.[3] Simultaneously, the European Medicines Agency’s IDMP roll-out tightens medicinal-product data requirements, compelling software to manage both event and product identifiers in one schema. Dual-system maintenance inflates risk and overhead, so firms accelerate migration ahead of statute. This regulatory synchrony turns spending on compliance upgrades into a certainty rather than a discretionary budget item, underpinning predictable growth for the pharmacovigilance software market.
Cloud-First Migration of Safety Databases
Eighty-three percent of pharmaceutical organizations now use cloud infrastructure for at least one critical workload, reflecting recognition that on-premises servers lack scalability for AI-heavy analytics. Pfizer’s AWS-backed case-processing engine and Moderna’s Google Cloud data lake show how cloud makes global collaboration routine while preserving audit trails. As GDPR and emerging digital-sovereignty laws push for local data residency, vendors respond with multi-region architectures that segment storage while unifying analytics layers. This hybrid evolution sustains double-digit growth for cloud sub-segments within the pharmacovigilance software market.
Explainable-AI Modules Slash Case-Processing Costs
Industry pilots confirm that machine learning trims expenses and accelerates throughput. IQVIA quantifies a 50% cost reduction from automated intake, with accuracy meeting or exceeding human benchmarks. TransPerfect Life Sciences reports 70% faster review times following AI-enabled triage. Regulatory openness is growing: the FDA’s Emerging Drug Safety Technology Meetings program lets sponsors pre-align AI validation plans with reviewers, shortening time to deployment. Explainability features that generate audit-ready reasoning logs quell historical concerns about “black-box” algorithms, unlocking broader uptake.
Restraints Impact Analysis of Pharmacovigilance And Drug Safety Software Market*
| Restraint | (~) % Impact on CAGR Forecast | Geographic Relevance | Impact Timeline |
|---|---|---|---|
| Data-Sovereignty & Cross-Border-Transfer Restrictions | -0.40% | EU leading with GDPR, expanding globally with digital sovereignty laws | Medium term (2-4 years) |
| Shortage Of PV Data-Science Talent | -0.30% | Global, with acute shortages in developed markets | Long term (≥ 4 years) |
| Algorithmic-Bias Scrutiny Delaying AI Approvals | -0.30% | North America & EU regulatory focus, expanding globally | Short term (≤ 2 years) |
| Escalating API Pricing From Dominant DB Vendors | -0.20% | Global, with higher impact on smaller pharmaceutical companies | Medium term (2-4 years) |
| Source: Mordor Intelligence | |||
Data-Sovereignty & Cross-Border-Transfer Restrictions
The European Health Data Space Regulation, effective May 2025, sets new standards for secondary health-data use and introduces consent layers that software must honor. GDPR already limits external processing, and similar frameworks are emerging in Asia and Latin America. Vendors must therefore design federated models that keep data in the country while sharing de-identified signals globally. This architecture raises costs and elongates deployment cycles, damping part of the pharmacovigilance software market’s expansion.
Shortage of PV Data-Science Talent
The industry needs an extra 5,000 professionals per year to execute AI-driven safety programs, yet few practitioners combine pharmacology, coding, and regulatory skills. Premium wages pull experts toward large multinationals, leaving small and mid-sized sponsors exposed. Automation helps, but AI still requires human oversight. Consequently, adoption of sophisticated modules may lag in organizations unable to recruit or retain specialists.
*Our forecasts treat driver/restraint impacts as directional, not additive. The impact forecasts reflect baseline growth, mix effects, and variable interactions.
Pharmacovigilance And Drug Safety Software Market Segment Analysis
By Functionality:
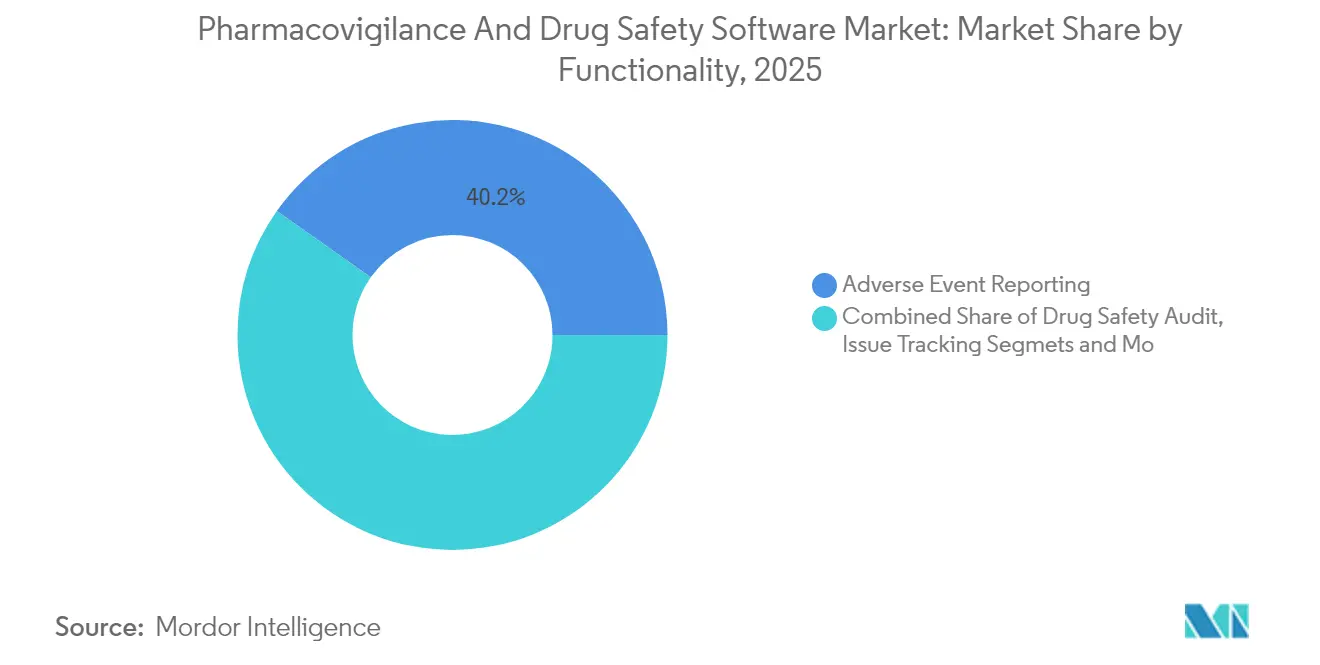
Predictive Analytics Surges AheadAdverse events reporting software retained a commanding 40.22% share of the pharmacovigilance software market in 2025, underscoring its status as a non-negotiable compliance pillar. Yet signal detection and risk-management modules are forecast to grow at an 17.5% CAGR, demonstrating the pivot toward preventive analytics that flag anomalies before regulators intervene. Many sponsors now favor unified platforms that merge intake, triage, analytics, and submission into one workflow. Oracle added AI-powered conditional touchless processing to Argus in 2024, illustrating how embedded intelligence elevates legacy solutions. Continuous rise in biological approvals coupled with diverse real-world data feeds widens the opportunity for platforms that draw correlations across ethnic, genomic, and social determinants of health datasets.
Integrated suites also reduce validation overhead because a single quality-management system covers multiple modules. As a result, vendors capable of harmonizing point solutions into end-to-end architecture are expanding their installed bases faster than niche competitors. Signal detection units may ultimately outpace event-reporting revenue, yet both modules remain symbiotic because regulatory filings still stem from source case data. The pharmacovigilance software market size attributable to advanced analytics is therefore set to climb more rapidly than the aggregate market, even as reporting retains foundational relevance.

By Mode of Delivery:
Cloud-Native Platforms Set the PaceCloud deployments accounted for 66.55% of the pharmacovigilance software market in 2025 and are advancing at a 21.3% CAGR, accelerating digital transformation across sponsors of all sizes. Many firms embrace software-as-a-service because quarterly updates keep pace with shifting regulations without the downtime typical of on-premises patches. Hybrid models act as an interim bridge: sensitive identifiable data stay on local servers while anonymized datasets feed cloud-based AI models. Pfizer’s AWS architecture and Moderna’s Google Cloud approach validate the scalability and compliance of multi-tenant environments.
Security certifications such as ISO 27001 and SOC 2 have become table stakes for vendors, addressing lingering apprehension over confidential patient data. Nonetheless, data-sovereignty rules compel providers to offer regionally partitioned environments, adding complexity and incremental cost. As hyperscale cloud providers open additional life-science compliance zones in Europe and Asia, barriers recede, and the pharmacovigilance software market size under cloud deployment continues expanding at a rate far above on-premises installation.
By End User:
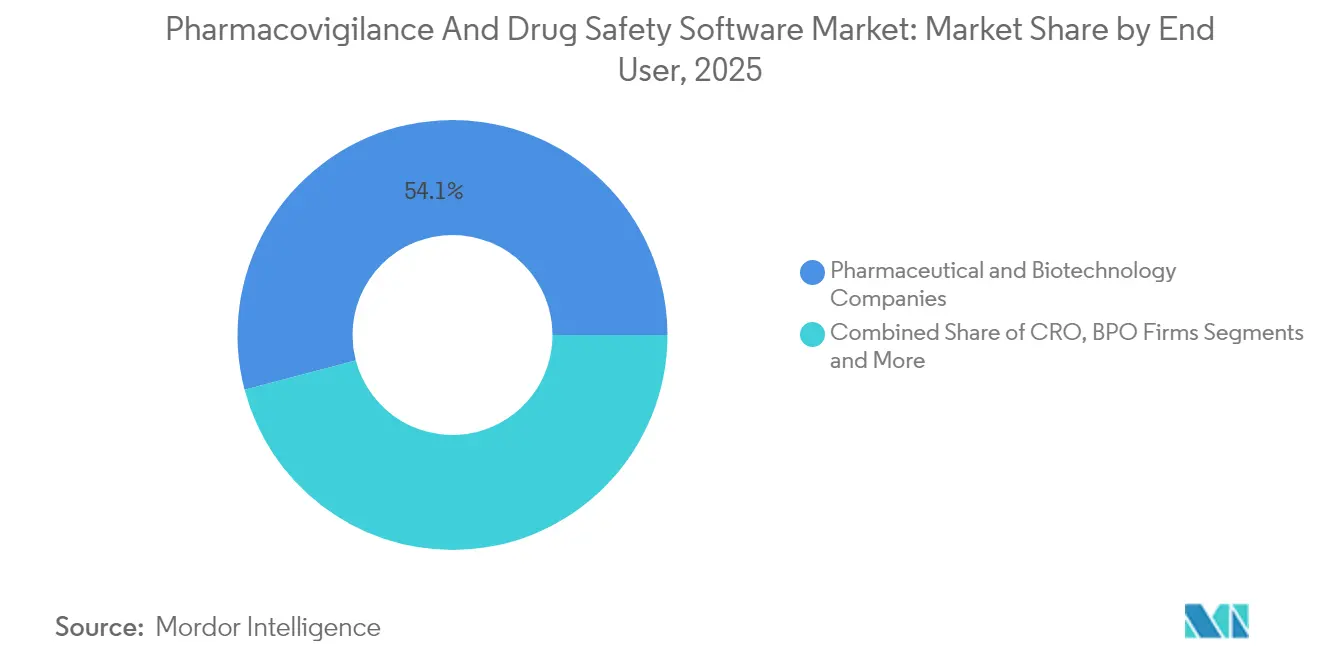
Outsourcing Momentum BuildsPharmaceutical and biotechnology firms controlled 54.10% of the pharmacovigilance software market in 2025 because they hold ultimate responsibility for product safety under global regulations. However, business-process outsourcing (BPO) providers are demonstrating a 17.2% CAGR as sponsors externalize case intake, triage, and submission. The strategy allows innovators to concentrate capital on core R&D while leveraging BPO scale for routine safety tasks. ProPharma Group’s acquisition of iSafety Systems in 2024 exemplifies how service providers extend reach to meet global sponsor demand.
Contract research organizations now incorporate post-marketing surveillance into traditional clinical-trial packages, offering end-to-end lifecycle support. This bundling increases appeal to biotechnology start-ups that lack in-house PV infrastructure. Medical-device manufacturers form a niche but growing cohort asthe convergence of drug and device vigilance rules boosts cross-sector platform demand. The pharmacovigilance software industry thus balances in-house stewardship with expanding managed-service ecosystems
Geography Analysis
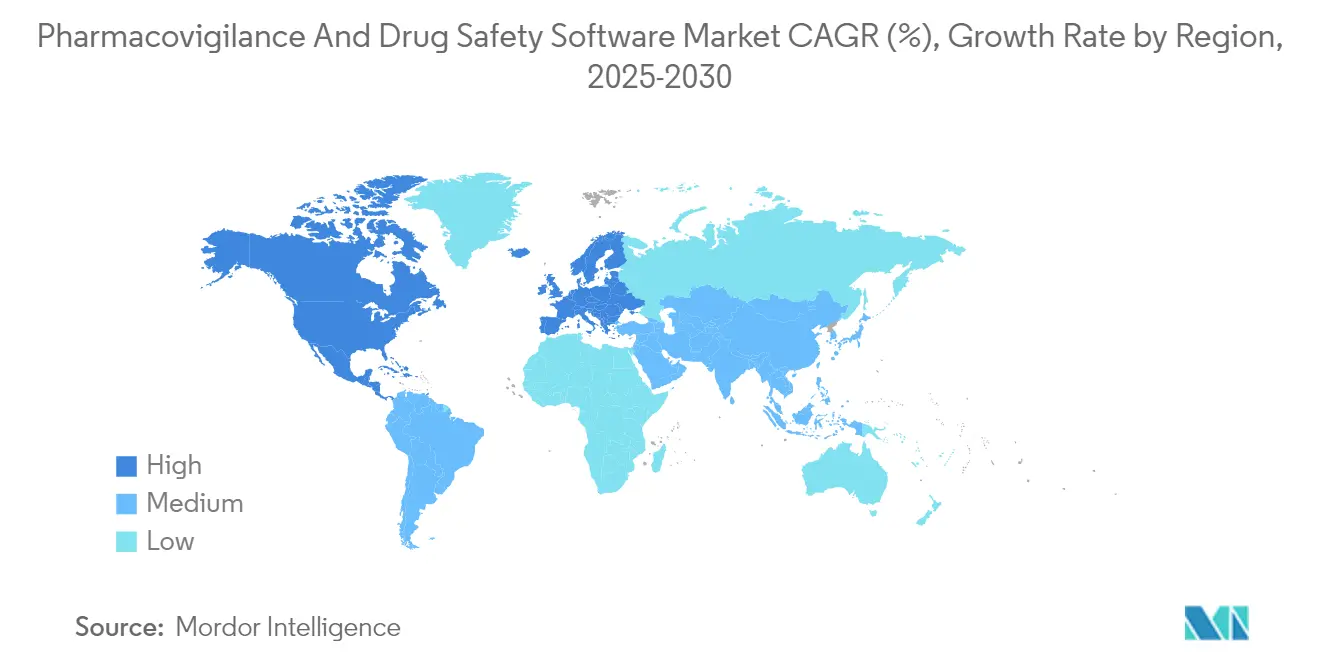
North America Pharmacovigilance and Drug Safety Software Market
North America led with 35.55% revenue share in 2025, anchored by stringent FDA oversight and a dense concentration of top 20 pharmaceutical companies. Many regional sponsors pioneered cloud-based safety systems before 2020; Pfizer's COVAES platform processed more than 1.5 million COVID-19 vaccine cases using automated triage and de-duplication. The FDA's 2025 creation of a chief AI officer underscores the regulator's readiness to evaluate algorithmic submissions, reinforcing regional appetite for AI-rich upgrades. Talent shortages remain a hurdle, inflating salaries for data-science specialists and pressuring smaller firms to outsource.
APAC Pharmacovigilance and Drug Safety Software Market
Asia Pacific records the fastest 13.9% CAGR on the back of clinical-trial migration to South Korea, Taiwan and Singapore, where shorter ethics-committee timelines accelerate recruitment. China's expanding contract research landscape, led by Wuxi AppTec, pulls in global clients that need local PV capacity aligned with National Medical Products Administration rules. Government investment programs, such as Japan's AMED grants for AI drug-safety research, further stimulate domestic software adoption. Despite diverse legal frameworks, many Asia-Pacific regulators now accept ICH E2B(R3) XML, reducing localization barriers.
Europe Pharmacovigilance and Drug Safety Software Market
Europe maintains significant scale because mature pharmacovigilance obligations and GDPR heightens the need for configurable, audit-ready platforms. The European Health Data Space Regulation formalizes secondary health-data use, prompting sponsors to adopt software capable of granular consent management. Germany's new Digital Act unlocks de-identified claims datasets for research, enabling safety algorithms to mine national repositories once off-limits. However, strict data-sovereignty clauses require EU-based hosting, spurring demand for region-specific cloud zones. Collectively, these dynamics keep Europe a premium market for feature-rich platforms even though growth trails Asia Pacific.
Regulatory Landscape
Global pharmacovigilance software requirements are tightening around structured electronic reporting and stronger post-approval signal oversight. In the United States, the FDA has advanced the transition to ICH E2B(R3) ICSRs for submissions to its Adverse Event Monitoring System (AEMS) through the Electronic Submissions Gateway Next Generation (ESG NextGen), moving the industry away from legacy formats and raising validation and mapping requirements for safety databases. In March 2026, the FDA also finalized updated postapproval safety data management guidance (ICH E2D(R1)) and finalized guidance aligned with ICH M14 for non-interventional studies using real-world data, reinforcing expectations for traceability, data quality controls, and governance when safety evidence comes from observational sources.
In Europe, the European Commission’s Implementing Regulation (EU) 2025/1466 became applicable in February 2026, amending pharmacovigilance implementation rules under Regulation (EU) No 520/2012 and strengthening marketing authorization holder responsibilities for signal validation and notification using EudraVigilance workflows. The EMA continued to operationalize this direction through its Signal and Safety Analytics program, with an MVP deployed in December 2025, and by initiating EudraVigilance compliance notifications to track adherence to ICSR reporting timelines. Together, these actions make technical compliance capabilities (E2B(R3) messaging, audit-ready data lineage, and signal-management workflow controls) a core selection criterion for pharmacovigilance and drug safety software.
Competitive Landscape
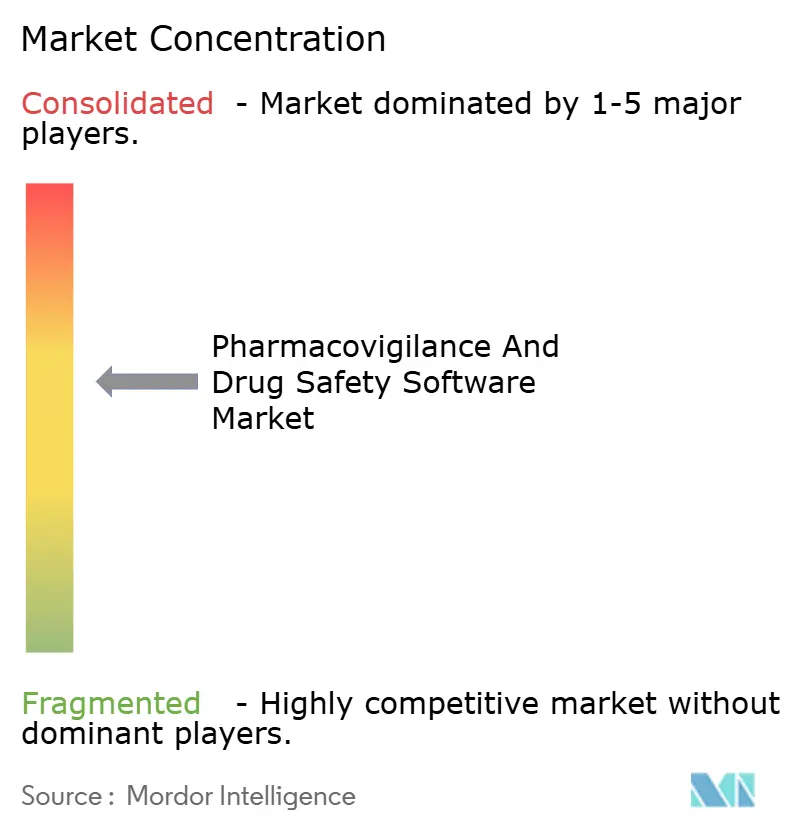
The pharmacovigilance software market exhibits moderate concentration, with platform vendors favoring breadth of functionality and deep integration over discount pricing. Oracle, ArisGlobal, and Veeva Systems defend incumbency through continuous feature expansion. Oracle’s July 2024 Argus upgrade added conditional touchless processing that pushes automation rates toward 80%. ArisGlobal reported record new-logo growth in 2024 and widened its partnership with Sitero to span clinical and regulatory domains. Veeva, historically strong in quality and content, unveiled a unified safety suite with NLP support in April 2025.
Emerging challengers target specific pain points, such as literature mining, machine translation, or duplicate detection. Their specialized offerings integrate via open APIs into larger ecosystems, forcing majors to maintain aggressive R&D roadmaps. The FDA’s Emerging Drug Safety Technology Meetings program levels the playing field by giving smaller firms a formal pathway to validate novel AI models.
M&A continues as scale becomes a prerequisite for global regulatory support. Valsoft’s August 2024 purchase of Anju Software afforded the acquirer an immediate PV footprint, illustrating how consolidators seek synergies between life-science verticals. Meanwhile, service providers such as PrimeVigilance rebrand and reposition to capture outsourced processing demand, creating adjacent competition for pure software vendors. These dynamics keep pricing power balanced, with differentiation residing in automation depth, compliance agility and ecosystem partnerships.
Pharmacovigilance And Drug Safety Software Industry Leaders
-
Ennov Solutions Inc.
-
Extedo GmbH
-
United BioSource Corporation
-
Ab Cube
-
ArisGlobal
- *Disclaimer: Major Players sorted in no particular order
Pharmacovigilance And Drug Safety Software Market Companies Covered in this Report
- Oracle
- Aris Global
- Veeva Systems
- Sparta Systems
- IQVIA
- Ennov Solutions
- Extedo
- AB Cube
- Anju Software
- Sarjen Systems
- United BioSource Corp.
- Accenture
- Cognizant
- Tata Consultancy Services (TCS ADD)
- Parexel International
- Medidata Solutions
- Saama Technologies
- Intellimed (Vigilance 360)
Market Opportunities and Future Outlook
Near-term opportunity centers on mandated standards and regulator platform modernization that force upgrades from legacy safety stacks. The FDA’s migration of FAERS into the Adverse Event Monitoring System (AEMS) in March 2026, alongside its move toward ICH E2B(R3) submissions via ESG NextGen, increases demand for platforms that can generate, validate, and transmit structured ICSRs at scale while maintaining audit trails across intake, triage, and submission. In the EU, the application of Implementing Regulation (EU) 2025/1466 from February 2026 and the EMA’s Signal and Safety Analytics program (MVP deployed in December 2025) expand the addressable need for integrated signal detection and documentation workflows aligned with EudraVigilance oversight and tighter timelines.
A second whitespace area involves AI in pharmacovigilance operations, where buyers are weighing automation benefits against regulator scrutiny on accountability and validation. CIOMS published its XIV report in December 2025 as a consensus framework for applying AI in pharmacovigilance. In January 2026, the FDA and EMA jointly released guiding principles of Good AI Practice in drug development, providing clearer guardrails for model governance, monitoring, and human oversight. Vendors that embed explainability, drift monitoring, and robust quality controls into case processing, MedDRA coding, and literature monitoring have stronger positioning to support the shift from compliance-only systems to safety intelligence workflows without adding inspection risk.
Recent Industry Developments in Pharmacovigilance And Drug Safety Software Market
- June 2026: ArisGlobal expanded its partnership with Sitero to integrate its NavaX AI engine into literature search and monitoring as well as case management workflows. This expands AI-driven automation across upstream signal inputs and downstream case processing, strengthening end-to-end operational coverage within a single ecosystem.
- May 2026: Ennov announced a strategic growth investment from Bregal Sagemount and Ardian Growth to accelerate AI innovation and expand globally across its platform footprint. The funding supports faster product development and commercial scaling in regulated life sciences software categories that include pharmacovigilance.
- April 2025: ArisGlobal launched NavaX Agent for MedDRA Coding using agentic AI to automate and standardize coding steps in pharmacovigilance operations. This release targets a high-effort, inspection-sensitive workflow area, increasing competitive pressure on vendors to deliver validated automation beyond basic case intake.
Pharmacovigilance And Drug Safety Software Market Report Scope and Research Methodology
Market Definition and Coverage
For this methodology, the market covers revenues earned from pharmacovigilance and drug safety software used to capture, process, and analyze adverse event data, and to support regulatory reporting and signal detection across the product life cycle.
Scope exclusions: We exclude pharmacovigilance outsourcing services, call center and case-processing BPO work, and generic clinical trial EDC systems that are not purpose-built for safety workflows.
Segments Covered in This Report
- By Functionality
- Adverse Event Reporting Software
- Drug Safety Audit Software
- Issue Tracking Software
- Fully Integrated Safety Suites
- Signal Detection & Risk-Management Tools
- By Mode of Delivery
- On-premise
- Cloud / SaaS
- Hybrid Deployment
- By End User
- Pharmaceutical & Biotechnology Companies
- Contract Research Organizations (CROs)
- Business-Process-Outsourcing (BPO) Firms
- Medical-Device Manufacturers
- Other PV Service Providers
- Geography
- North America
- United States
- Canada
- Mexico
- Europe
- Germany
- United Kingdom
- France
- Italy
- Spain
- Rest of Europe
- Asia Pacific
- China
- Japan
- India
- South Korea
- Australia
- Rest of Asia Pacific
- Middle East and Africa
- GCC
- South Africa
- Rest of Middle East and Africa
- South America
- Brazil
- Argentina
- Rest of South America
- North America
Data Sources, Market Sizing, and Validation
Desk Research
Desk research was used to set the regulatory and operational context that drives software adoption, and to anchor the model to measurable activity signals. We leaned on public sources such as FDA safety reporting resources, EMA pharmacovigilance guidance, ICH guidelines, and WHO safety monitoring references to understand reporting requirements and workflow expectations.
We also reviewed company filings and investor materials, product documentation, association websites, and reputable press coverage to map common pricing approaches and deployment shifts (on-premise versus SaaS). Where helpful, we referenced paid subscriptions for company financials and news, plus patent databases to sense where product innovation was moving, and then used those signals to sanity-check growth assumptions. These sources are illustrative only, and other public and paid references were also used for collection, cross-checking, and clarification.
Primary Interviews and Surveys
Primary work focused on interviews and short surveys with software users and implementation stakeholders across pharma and biotech firms, CRO and BPO delivery teams, and technology and compliance leaders supporting safety operations. Since this is a global market, views were balanced across major regions so assumptions like module adoption, cloud migration timing, and price progression could be confirmed and adjusted when desk research was not specific enough.
Distribution of primary research fieldwork respondents
| Company type | Respondent position | Region |
|---|---|---|
| Top tier: 31% | CXOs: 12% | APAC: 45% |
| Mid tier: 49% | Functional/Unit leaders: 40% | EMEA: 34% |
| Smaller Players: 20% | Managers: 48% | Americas: 21% |
Market-Sizing & Forecasting
Sizing was built using top-down and bottom-up logic together, where demand signals were first reconstructed from the safety workload and compliance footprint, and then cross-checked using selective supplier-side reality checks. On the top-down side, we translated factors like the number of active marketed products under safety monitoring, reported adverse event volumes, and the typical split between in-house and outsourced safety operations into an addressable software demand pool.
To keep the totals realistic, the outputs were corroborated with bottom-up approximations built from sampled pricing and volume logic, such as users or case volumes tied to licensing, subscription, and maintenance fee structures, and then adjusted for cloud versus on-premise mix. Key model inputs included SaaS penetration, module adoption (case intake, reporting, and signal detection), implementation cycle times, renewal behavior, and average contract values by customer size, which were reviewed and corrected through primary feedback when gaps showed up.
For forecasting, scenario analysis was used so that adoption curves and ASP movement could be flexed under different regulatory intensity and cloud migration timing, followed by a trend-fit check on the implied growth path. Where bottom-up detail was not available for smaller buyers, conservative proxy assumptions were applied and then normalized during the final reconciliation step.
Data Validation & Update Cycle
Model outputs were checked against independent activity indicators and practical constraints, such as safety reporting workload trends and the pace of regulated-system cloud adoption, before totals were finalized. When large variances showed up by region or by deployment type, the assumptions behind pricing, adoption, and customer counts were re-tested and, if needed, respondents were re-contacted for clarification.
Before sign-off, the full model is reviewed in multiple steps so anomalies are explained and not just averaged out. The report is refreshed annually, and interim updates are made when material events change adoption or pricing assumptions. Prior to delivery, we perform a final pass to ensure the latest available public signals are reflected in the estimates.
Mordor Intelligence's Pharmacovigilance and Drug Safety Software Market Size Compared Against Other Published Estimates
Published market sizes for pharmacovigilance and drug safety software can look far apart because the line between software revenue and pharmacovigilance services is not drawn the same way by every publisher, and the time window and currency handling can also differ. In addition, some estimates roll in broader automation or outsourced processing, which changes the addressable pool even when the product label sounds similar.
The biggest gap drivers usually come from refresh timing and pricing logic, where FX conversion dates, subscription versus license recognition, and cloud migration assumptions can move the number even within the same year, and those differences are then amplified in longer forecasts. By re-checking ASP steps and adoption shifts during each update cycle, and locking conversions to a consistent timing, Mordor Intelligence keeps the estimate tied to software-only revenue and repeatable validation checks rather than broad service spend.
Benchmark comparison
| Source | Market Size | Gaps in Research Methodology |
|---|---|---|
| Mordor Intelligence | USD 222.18 M (2025) | |
| Global Consultancy A | USD 210.96 M (2024) | Uses a different base year and growth window, and the scope can blend software demand with outsourced pharmacovigilance delivery in end-use splits, which shifts what is counted as software revenue. |
| Industry Publisher B | USD 2.09 B (2025) | Appears to apply a much broader scope that likely includes wider pharmacovigilance operations or adjacent safety spend, which inflates the market beyond purpose-built software license and subscription revenue. |
Overall, the spread in published values is explained less by math and more by boundaries and timing choices, especially around what is treated as software versus services and how pricing and currency are updated. When the scope is held to software fees and the assumptions are refreshed and rechecked in a consistent way, the resulting market size becomes easier to trace back to clear workload and adoption variables.
Key Questions Answered in the Report
What is the current size of the pharmacovigilance software market?
The market stands at USD 234.73 million in 2026 and is projected to reach USD 309.03 million by 2031.
How fast is the pharmacovigilance software market expected to grow?
It is forecast to expand at a 5.65% CAGR over 2026-2031.
Which functionality segment holds the largest share?
Adverse event reporting software led with 40.22% revenue share in 2025.
What deployment model is growing the quickest?
Cloud and SaaS deployments are advancing at a 21.3% CAGR and already represent 66.55% of market revenue.
Which region is expanding the fastest?
Asia Pacific is forecast to register a 13.9% CAGR through 2031, benefiting from the eastward shift of clinical trials.