
Pharmaceutical Waste Management Market Size and Share
Market Overview
| Study Period | 2020 - 2031 |
|---|---|
| Market Size (2026) | USD 1.61 Billion |
| Market Size (2031) | USD 2.18 Billion |
| Growth Rate (2026 - 2031) | 6.18 % |
| Fastest Growing Market | Asia Pacific |
| Largest Market | North America |
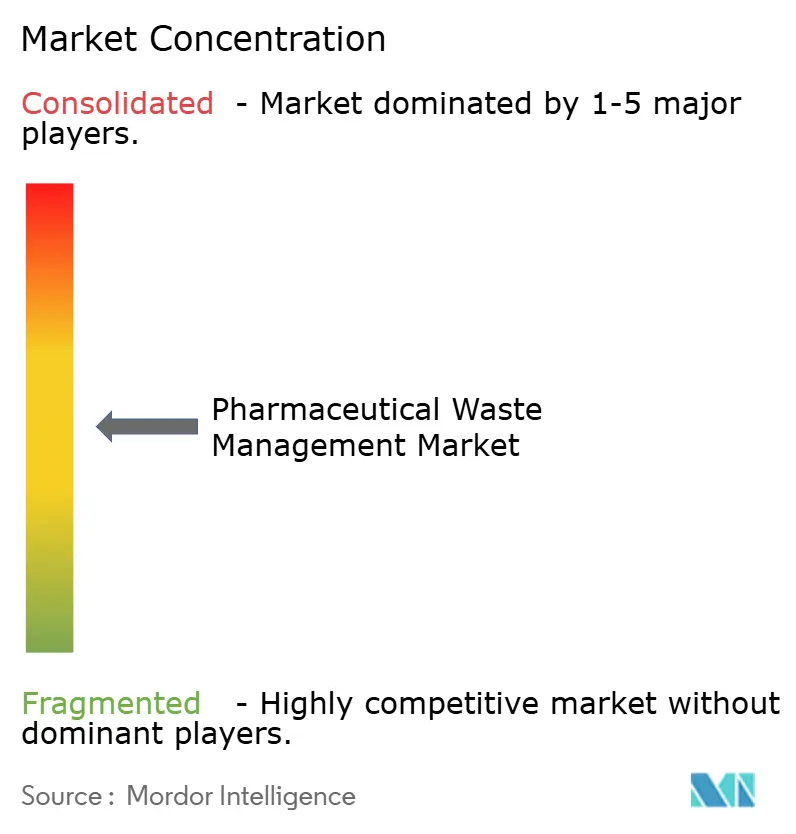
| Market Concentration | Medium |
Major Players *Disclaimer: Major Players sorted in no particular order Image © Mordor Intelligence. Reuse requires attribution under CC BY 4.0. | |
Pharmaceutical Waste Management Market Analysis by Mordor Intelligence
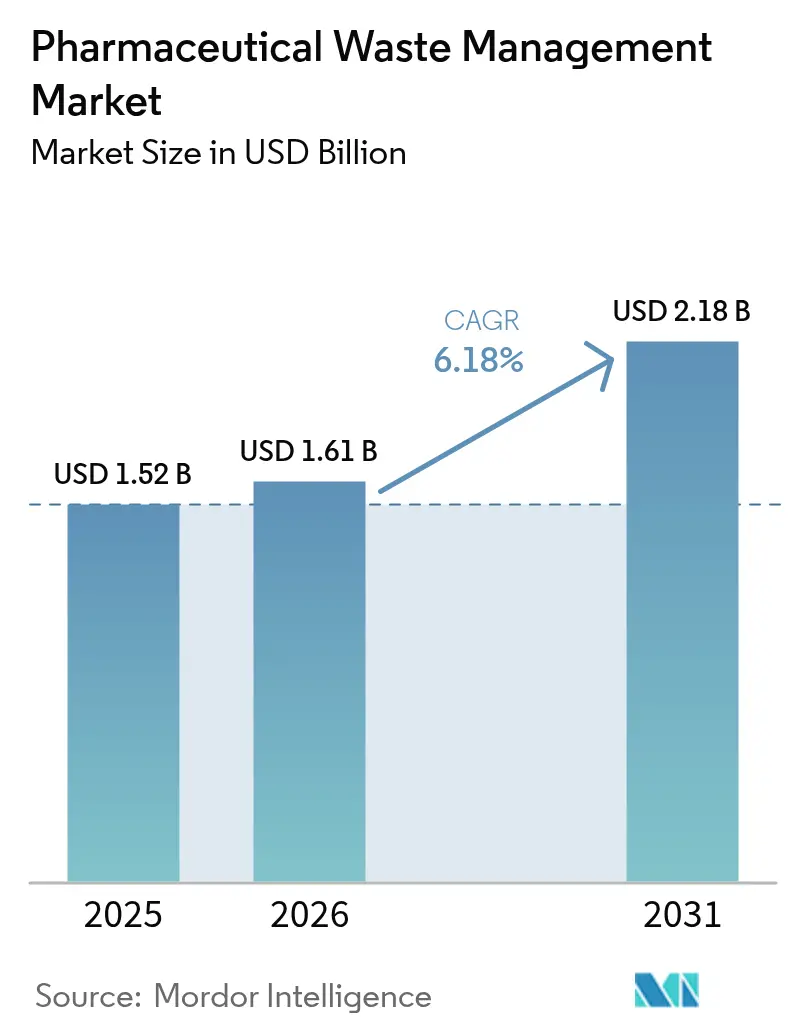
The Pharmaceutical Waste Management Market size is expected to grow from USD 1.52 billion in 2025 to USD 1.61 billion in 2026 and is forecast to reach USD 2.18 billion by 2031 at 6.18% CAGR over 2026-2031.
Rising enforcement of EPA Subpart P rules, the European Union’s Urban Wastewater Treatment Directive, and similar measures in Asia-Pacific are pushing healthcare facilities to adopt comprehensive disposal programs rather than reactive fixes. Expansion of biopharmaceutical manufacturing, rapid consumer take-back initiatives, and sustained investment in advanced oxidation, microwave, and supercritical water technologies further reinforce demand. Intensifying environmental scrutiny and public transparency expectations motivate hospitals and manufacturers to link waste stewardship with broader climate and ESG objectives, while market consolidation allows large players to spread compliance costs across wider networks and invest in innovation that smaller competitors cannot easily replicate.
Key Report Takeaways
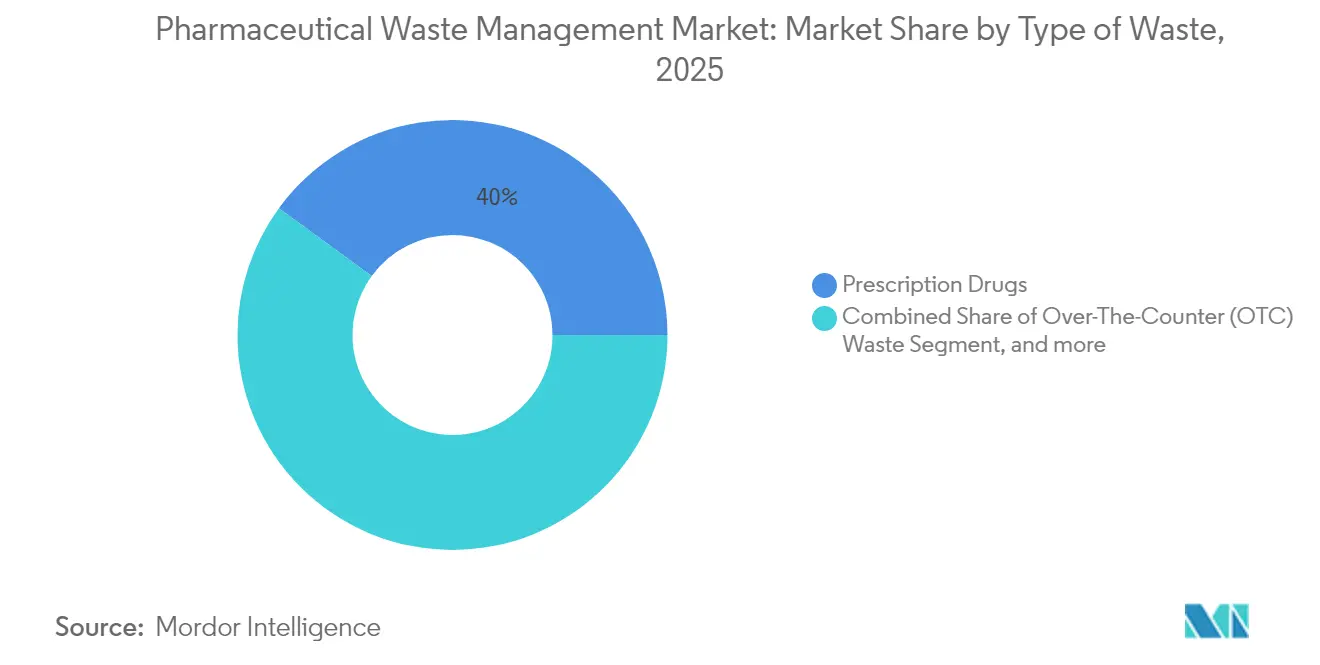
- By waste type, prescription drugs led with 39.96% of pharmaceutical waste management market share in 2025; controlled substances are projected to advance at a 7.35% CAGR through 2031.
- By waste generator, hospitals and clinics held 55.02% of the pharmaceutical waste management market share in 2025, whereas retail pharmacies are poised for the fastest 8.05% CAGR to 2031.
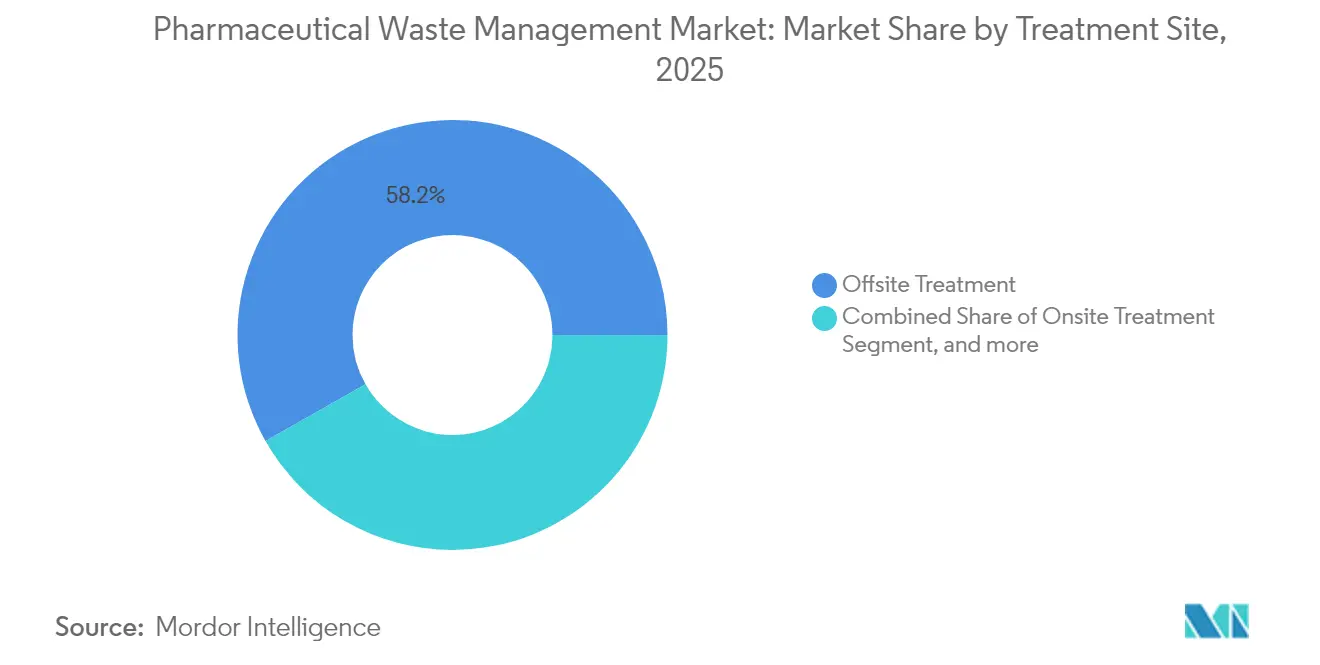
- By treatment site, offsite processing accounted for 58.21% share of the pharmaceutical waste management market size in 2025, while onsite solutions are expanding at an 8.21% CAGR between 2026-2031.
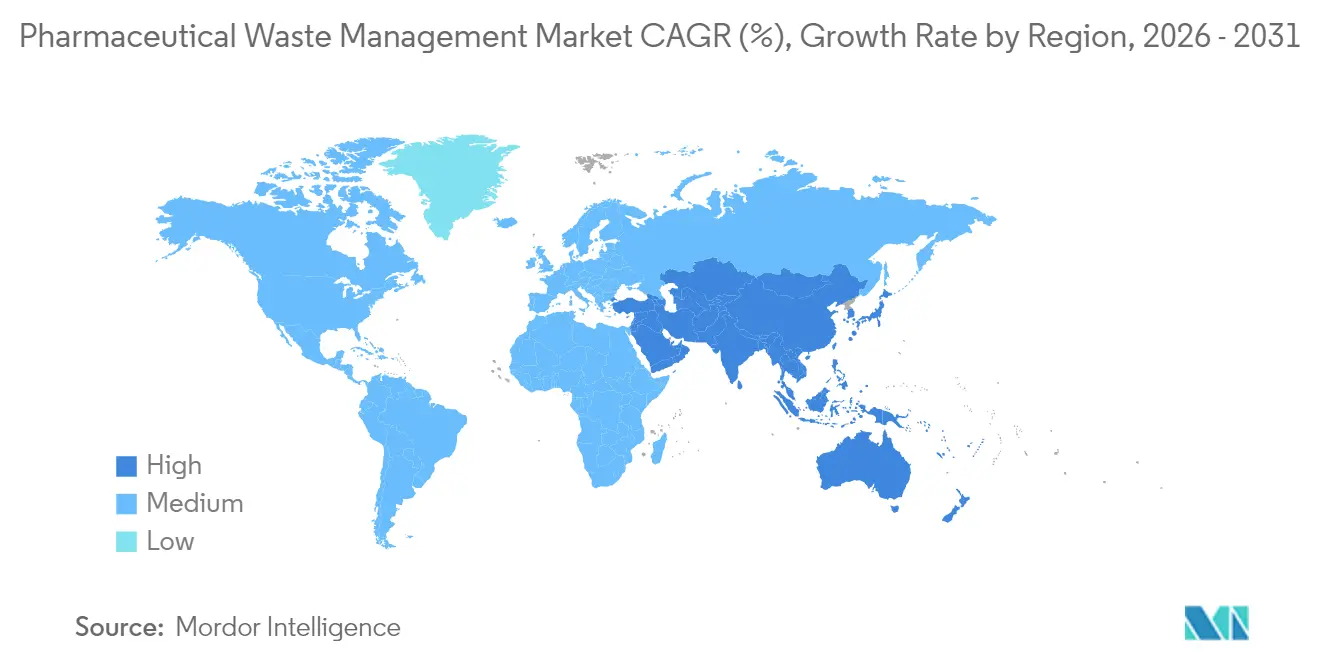
- By geography, North America dominated with 39.55% of pharmaceutical waste management market share in 2025; Asia-Pacific is set to grow at an 8.47% CAGR through 2031.
Note: Market size and forecast figures in this report are generated using Mordor Intelligence’s proprietary estimation framework, updated with the latest available data and insights as of 2026.
Global Pharmaceutical Waste Management Market Trends and Insights
Drivers Impact Analysis*
| Driver | (~) % Impact on CAGR Forecast | Geographic Relevance | Impact Timeline |
|---|---|---|---|
| Increasing Pharmaceutical Production | +1.5% | North America, Europe, emerging Asia-Pacific | Medium term (2-4 years) |
| Stringent Regulatory Compliance | +1.2% | North America & EU; APAC gaining pace | Short term (≤ 2 years) |
| Growing Environmental Concerns | +0.8% | Developed markets worldwide | Long term (≥ 4 years) |
| Advancements in Waste Treatment Technologies | +1.1% | North America & Europe first; APAC following | Medium term (2-4 years) |
| Public Awareness and Corporate Responsibility | +0.7% | Global, strongest in consumer-facing segments | Long term (≥ 4 years) |
| Expansion of Healthcare and Biopharma Manufacturing | +0.9% | Asia-Pacific core, spill-over to MEA & Latin America | Medium term (2-4 years) |
| Source: Mordor Intelligence | |||
Increasing Pharmaceutical Production
Global drug output continues to climb, and biologics add complex cytotoxic residues that require specialized containment and high-temperature destruction. Single-use bioprocessing lowers cross-contamination risk but raises plastic volumes that many recyclers cannot handle. Manufacturers pursuing zero-liquid-discharge have cut biological and chemical oxygen demand by up to 90%, showing clear operational savings alongside compliance gains. Emerging production hubs in India, Vietnam, and the Philippines deepen the pharmaceutical waste management market as these regions race to match disposal infrastructure with capacity expansion. Full-service providers able to integrate solid, liquid, and cytotoxic waste solutions now enjoy a competitive edge.
Stringent Regulatory Compliance
The EPA ban on sewering hazardous pharmaceuticals, the DEA review of non-incineration destruction options, and Europe’s Extended Producer Responsibility cost-recovery model shift disposal costs upstream.[1]Drug Enforcement Administration, “Controlled Substance Public Meeting on Destruction Technologies,” dea.gov Hospitals in jurisdictions adopting Subpart P now maintain detailed cradle-to-grave manifests, and very small quantity generators face sharper training mandates.[2]Stericycle Inc., “Nevada Hospital, Medical and Infectious Waste Incinerator Opening,” stericycle.com German drug makers alone expect EUR 36 billion in micropollutant removal fees over three decades, underscoring why pharmaceutical waste management market participants with robust compliance consulting departments win larger contracts. Cross-border operators also navigate differing take-back, labeling, and reverse-logistics rules, reinforcing the value of global scale.
Growing Environmental Concerns
Healthcare leaders increasingly treat waste minimization as a climate and brand imperative. United States operating rooms account for 20-30% of hospital waste, driving systemwide audits that save USD 700 million in five years by classifying waste more accurately. Advanced oxidation using nanoscale zero-valent iron shows 96.8% pollutant removal, offering hospitals measurable ESG benefits. Circular-economy programs built around the 10Rs framework allow facilities to cut plastics and recover solvents, reinforcing demand for vendors who can document downstream carbon impacts of every disposal method.
Advancements in Waste Treatment Technologies
Supercritical water oxidation now reaches 99.99% destruction of PFAS and cytotoxic residues at lower temperatures than legacy incinerators. Electrochemical units enable onsite PFAS breakdown, while microwave systems slash waste volume by over 80%. AI-driven sorting and blockchain-based chain-of-custody tools improve segregation accuracy and audit readiness. The pharmaceutical waste management market rewards firms that bundle these modular technologies into tiered service plans for hospitals of every size.
Restraints Impact Analysis*
| Restraint | (~) % Impact on CAGR Forecast | Geographic Relevance | Impact Timeline |
|---|---|---|---|
| High Disposal & Compliance Costs for Hazardous Pharma Waste | -0.9% | Global, hardest in cost-sensitive emerging markets | Short term (≤ 2 years) |
| Resistance to Adoption of New Technologies | -0.6% | Traditional systems in developed markets, rural facilities worldwide | Medium term (2-4 years) |
| Limited Infrastructure in Developing Regions | -0.5% | Emerging Asia-Pacific, MEA, Latin America | Long term (≥ 4 years) |
| Fragmented Reverse Logistics Regulations Across Borders | -0.4% | Multinational operations worldwide | Medium term (2-4 years) |
| Source: Mordor Intelligence | |||
High Disposal & Compliance Costs for Hazardous Pharma Waste
Regulated medical waste often costs USD 0.20-0.50 per pound versus USD 0.03-0.08 for general trash, straining small clinics that spend USD 160-360 monthly on disposal. CMS refund rules on discarded single-dose drugs add further administrative burden.[3]Centers for Medicare & Medicaid Services, “Discarded Drug Refunds Final Rule,” cms.gov Misclassification remains rampant—studies show education programs can boost correct segregation by 65%, but facilities lacking budget postpone training. Price pressure pushes buyers to competitive bids, compressing margins even as operators shoulder higher capital outlays for new kilns or advanced oxidation units.
Resistance to Adoption of New Technologies
Some healthcare executives distrust novel methods, citing upfront cost, staff retraining, and perceived regulatory uncertainty. Rural hospitals in North America and smaller European clinics still rely on manual segregation and basic autoclaves. Vendors must therefore offer financing models, turnkey maintenance, and robust validation data to reduce perceived risk and accelerate changeover.
*Our forecasts treat driver/restraint impacts as directional, not additive. The impact forecasts reflect baseline growth, mix effects, and variable interactions.
Segment Analysis
By Type of Waste: Controlled Substances Drive Regulatory Innovation
Prescription drugs represented 39.96% of pharmaceutical waste management market size in 2025. Hospitals, long-term care facilities, and retail pharmacies treat these as mixed hazardous streams demanding incineration or advanced oxidation for safe destruction. Meanwhile, controlled substances comprise the fastest-growing slice, logging a 7.35% CAGR as regulators tighten diversion controls.
Heightened DEA oversight fuels mail-back envelope schemes for opioids, and pilot chemical degradation systems now deliver complete molecular breakdown without incineration. The pharmaceutical waste management market increasingly prizes vendors capable of preserving chain-of-custody integrity through tracked containers, monitored vaults, and blockchain logs. Cytotoxic chemotherapy agents form a smaller yet high-margin segment requiring closed-system transfer devices, while veterinary pharmaceuticals and OTC products round out the mix with simplified protocols under updated EPA nicotine exclusion rules.


By Waste Generator: Retail Pharmacies Accelerate Take-Back Programs
Hospitals and clinics generated commanding 55.02% of overall pharmaceutical waste management market size in 2025. Their environmental services teams already partner with full-service vendors for sharps, chemotherapy, controlled substance destruction, and cradle-to-grave documentation.
Retail pharmacies, however, are on track for the most robust 8.05% CAGR. Chain drugstores now operate thousands of in-store kiosks and coordinate national take-back events, converting public foot traffic into safe return streams. Biopharma manufacturing plants face mounting polymer and solvent loads from single-use systems, while research labs generate sporadic volumes of experimental compounds that nonetheless require meticulous characterization. The upshot is a diversification of customer profiles, compelling providers to tailor service bundles from small-quantity mailers to bulk tanker pickups.
By Treatment Site: Onsite Solutions Gain Momentum
Centralized offsite plants captured 58.21% of 2025 revenue, benefiting from scale, rotary-kiln capacity, and established logistics. Nonetheless, onsite systems are posting an 8.21% CAGR as hospitals prioritize immediate compliance control and shrink transport expenses.
Microwave units installed in tertiary hospitals process 88 kg per hour, cut waste volume by 80%, and meet global infectious waste standards. Some pharmaceutical plants deploy continuous supercritical water reactors that treat isopropyl alcohol effluent for water reuse, illustrating circular-economy payoffs. Hybrid models onsite pre-treatment followed by offsite final destruction are also gaining favor, giving facilities flexibility without capital outlay for incinerators.
Geography Analysis
North America led the pharmaceutical waste management market with 39.55% share in 2025, anchored by mature regulatory enforcement and capital-intensive infrastructure. Recent investments include a USD 110 million Nevada incinerator that couples waste-to-energy with water reuse, plus a planned Arkansas facility that guarantees incineration capacity for another five years. Cross-border harmonization under the Basel Convention streamlines shipments between the United States, Canada, and Mexico, enabling nationwide service networks to optimize routing and reduce emissions.
Asia-Pacific is the fastest-growing region at an 8.47% CAGR through 2031. China’s anti-espionage rules complicate API exports and raise domestic disposal demand, while India’s draft Liquid Waste Management Rules 2024 impose extended responsibility on high-volume water users. Japan’s push for membrane-based water-for-injection systems underscores the region’s tilt toward energy-efficient treatment methods. Southeast Asian countries continue to attract contract manufacturing, creating sizeable yet infrastructure-limited demand for advanced destruction services.
Europe is undergoing a regulatory overhaul that links pharmaceutical packaging, wastewater micropollutant removal, and producer responsibility. Germany’s EUR 36 billion compliance tab over 30 years epitomizes the financial magnitude of forthcoming upgrades. European Medicines Agency guidelines now embed persistence, bio-accumulation, and toxicity criteria in environmental risk assessments, compelling manufacturers to support downstream treatment costs. Providers with pan-EU compliance platforms and specialized high-temperature capacity stand to consolidate market share as smaller collectors exit due to capital constraints.

Regulatory Landscape
Regulation continues to tighten around both hazardous pharmaceutical waste and controlled-substance destruction, pushing generators toward documented, auditable handling from accumulation through final treatment. In the United States, the Environmental Protection Agency regulates hazardous waste pharmaceuticals under RCRA 40 CFR Part 266 Subpart P, including the national ban on sewering hazardous pharmaceuticals and standardized requirements for healthcare facilities and reverse distributors. Adoption and enforcement operate through EPA-authorized state programs, which can add state-specific requirements. In parallel, the Drug Enforcement Administration governs controlled substances disposal and requires destruction methods that render materials non-retrievable, shaping demand for secure chain-of-custody and validated destruction technologies.
Outside the United States, lifecycle-oriented environmental expectations are becoming more explicit in policy and guidance. In Europe, chemical and environmental obligations anchored by REACH and broader pharmaceutical environmental strategy initiatives reinforce upstream accountability for waste and wastewater impacts, while extended producer responsibility concepts shift more cost recovery and reporting upstream. Globally, the World Health Organization issued updated guidance in 2025 on the safe management of pharmaceutical waste from healthcare facilities and manufacturing, including frameworks aimed at limiting environmental drivers of antimicrobial resistance (AMR), which raises scrutiny on liquid effluent controls and API releases for manufacturers and contract facilities operating across regions.
Competitive Landscape
Consolidation is reshaping the pharmaceutical waste management market as regulatory complexity and technology needs outpace small operators’ resources. Waste Management’s USD 7.2 billion acquisition of Stericycle combines the country’s largest logistics network with medical waste expertise, promising USD 125 million in annual synergies and a unified platform offering regulated medical waste, secure information destruction, and take-back program management.
Technology capability remains a key differentiator. General Atomics’ supercritical water systems posting 99.9% PFAS destruction and electrochemical oxidation units designed for hospital basements highlight a pivot toward cleaner, resource-efficient solutions. Microwave technology suppliers promote rapid cycle times and low emissions, attracting facilities seeking to minimize Scope 3 greenhouse-gas disclosures.
Regional specialists leverage local knowledge and cultural acceptance to penetrate emerging markets. Firms partnering with municipal authorities in Brazil or state-owned enterprises in India offer modular plants that address infrastructure gaps. Nevertheless, capital intensity favors multinationals that can amortize R&D across global footprints while fulfilling multi-jurisdictional chain-of-custody obligations.
Pharmaceutical Waste Management Industry Leaders
BioMedical Waste Solutions, LLC
Clean Harbors, Inc.
Sharps Compliance, Inc.
US Ecology, Inc.
Waste Management Inc.
- *Disclaimer: Major Players sorted in no particular order

Market Opportunities and Future Outlook
Compliance execution and traceability remain a major whitespace, particularly for multi-site health systems and retail pharmacy networks that must standardize hazardous pharmaceutical labeling, segregation, storage, and documentation under EPA RCRA Subpart P while also meeting controlled-substance non-retrievable destruction requirements. This favors vendors that can bundle regulated pickup logistics, reverse distribution support, witness and documentation services for controlled substances, and digital audit trails across dispersed generators. Cooperative and association-led contracting is also shaping purchasing behavior, with multi-entity service structures such as MassBio members (more than 1,700 life sciences companies) gaining access to environmental and waste management solutions through Veolia North America. This model supports enterprise-wide program deployment rather than facility-by-facility contracting.
Technology and treatment diversification is another opportunity area as customers look beyond traditional incineration for specific waste streams and ESG constraints. Peer-reviewed and public-sector guidance points to demand for improved wastewater and manufacturing effluent management, including controls that limit API discharge and AMR-related residues. This creates room for advanced treatment offerings and validation services aligned with WHO guidance for pharmaceutical manufacturing waste. Emerging oxygen-limited thermal pathways such as pyrolysis, alongside established autoclaving for infectious waste and specialized hazardous pharmaceutical destruction pathways, open service niches for providers that can manage heterogeneous feedstocks, emissions controls, and residue handling while meeting generator documentation and chain-of-custody requirements.
Recent Industry Developments
- May 2026: The City of Baltimore listed Biomedical Waste Services Inc. for its biomedical waste services contract (SCON-002174), covering pickup and disposal activities that include pharmaceutical waste. The award signals continued municipal and public-sector procurement for compliant collection and disposal programs, supporting predictable volumes for regional service providers and their downstream treatment partners.
- May 2025: Inmar Intelligence expanded its relationship with MMCAP through a new medical waste management contract that includes pharmaceutical waste management services such as secure drug disposal and sharps management. The cooperative purchasing channel centralizes vendor access to public-sector and member facilities, reinforcing demand for standardized, scalable compliance and reverse-logistics capabilities.
- October 2024: Stericycle opened a USD 110 million hospital, medical, and infectious waste incinerator facility in McCarran, Nevada, incorporating waste-to-energy and water reuse features under stringent emissions controls. The added high-temperature destruction capacity supports disposal needs for regulated medical and pharmaceutical waste streams and raises the bar for capital-intensive infrastructure among competing providers.


Research Methodology Framework and Report Scope
Market Definition and Coverage
This market covers services and solutions used to collect, segregate, transport, treat, and dispose pharmaceutical waste that includes expired, unused, contaminated, or recalled drugs from healthcare settings, pharmacies, and related generators.
Scope exclusions: Medical sharps and general biomedical waste with no drug residue, plus in-plant manufacturing process scrap, are excluded from this sizing.
Segmentation Overview
- By Type of Waste
- Prescription Drugs
- Over-The-Counter (OTC) Waste
- Controlled Substances
- Chemotherapy Drugs
- Veterinary Pharmaceuticals
- Other Waste Type
- By Waste Generator
- Hospitals & Clinics
- Retail Pharmacies
- Biopharma Manufacturing Sites
- Long-term Care & Nursing Homes
- Research Laboratories
- By Treatment Site
- Onsite Treatment
- Offsite Treatment
- By Geography
- North America
- United States
- Canada
- Mexico
- Europe
- Germany
- United Kingdom
- France
- Italy
- Spain
- Rest of Europe
- Asia-Pacific
- China
- Japan
- India
- Australia
- South Korea
- Rest of Asia-Pacific
- Middle East & Africa
- GCC
- South Africa
- Rest of Middle East & Africa
- South America
- Brazil
- Argentina
- Rest of South America
- North America
Data Sources, Market Sizing, and Validation
Desk Research
Desk work is used to set the factual base before we start modeling. We referenced public sources such as the US EPA guidance on hazardous waste, WHO healthcare waste guidance, and country-level rules on pharmaceutical take-back and controlled substances disposal. We also used national health statistics and environment agency publications where available, plus customs or waste trade datasets when they were relevant to cross-check cross-border movement of treated waste.
On the market side, company filings, investor presentations, and reputable press were used to map waste service offerings and the typical contract structures, which then helps frame what is being priced as waste services versus adjacent logistics. For specific checks, we also used paid subscriptions that consolidate company financials, track news and events, and provide shipment-level import and export visibility where it supported validation. These sources are illustrative, and many other public documents and references were also used for data collection, validation, and clarification.
Primary Interviews and Surveys
Primary work focused on waste service providers, healthcare waste handlers, compliance specialists, and procurement and operations leaders from waste-generating facilities. Interviews and structured surveys were used to confirm typical service scope, pricing ranges, contract length, treatment mix, and how segregation and compliance rules change the volumes routed to each treatment path across major regions.
Distribution of primary research fieldwork respondents
| Company type | Respondent position | Region |
|---|---|---|
| Top tier: 34% | CXOs: 20% | APAC: 40% |
| Mid tier: 46% | Functional/Unit leaders: 28% | EMEA: 34% |
| Smaller Players: 20% | Managers: 52% | Americas: 26% |
Market-Sizing & Forecasting
Sizing starts with a top-down build where healthcare and pharmacy activity, drug consumption proxies, and regulated waste generation patterns are used to reconstruct an addressable waste pool by region and then translate it into service value. Inputs we typically stress-test include the share of hazardous versus non-hazardous drug waste, take-back program coverage, treatment mix (incineration, autoclave, chemical neutralization, and secure landfill routing), average service fees by generator type, and changes in enforcement intensity that shift compliance-driven collection volumes.
Once that demand pool is built, the totals are corroborated through selective bottom-up approximations, including sampling provider revenue exposure to pharmaceutical waste, channel checks on disposal pricing, and ASP times volume calculations for common service bundles. Where direct disclosure is limited, gaps are handled using clearly stated proxy ratios from interviews, which are then rechecked against observed capacity additions, tender activity, and reported contract wins. Forecasts are produced using scenario analysis supported by trend inputs (healthcare utilization, drug volumes, regulation updates, and inflation-linked pricing clauses) and are reviewed with experts so the growth path stays realistic.
Data Validation & Update Cycle
Outputs are validated through multiple checks, where model results are compared with independent signals such as treatment capacity changes, compliance program adoption, and pricing movement seen in contracts and public announcements. Variances are investigated at the assumption level, and outliers trigger rework of the drivers rather than simple smoothing. Before sign-off, the numbers go through a multi-step analyst review so the same logic holds across regions and years.
Reports are refreshed on an annual cycle, and interim updates are made when material events happen, such as a major regulatory shift, a large capacity addition, or a meaningful change in disposal practices. Right before delivery, a final pass is done to capture the latest public updates so clients receive a current view.
Mordor Intelligence's Pharmaceutical Waste Management Market Sizing Compared With Other Published Estimates
Published market sizes for pharmaceutical waste management often differ because each publisher counts a slightly different waste stream, uses different price bases, and updates assumptions at different times. Differences also show up when one study leans heavily on regulation text, while another leans more on provider revenue rollups or on high-level healthcare spend proxies.
Manufacturing plant process scrap and non-pharmaceutical biomedical waste sit outside Mordor Intelligence's scope, which is one of the main reasons some published totals look larger even when they use similar growth rates. Another common gap comes from how hazardous drug waste is priced, since some estimates apply a single blended fee, while others split controlled substances destruction, reverse logistics, and treatment steps with separate rates and inflation timing.
Benchmark comparison
| Source | Market Size | Gaps in Research Methodology |
|---|---|---|
| Mordor Intelligence | USD 1.61 B (2026) | |
| Global Consultancy A | USD 1.66 B (2024) | Uses an earlier base year and can mix generator pricing with broader medical waste handling fees, which can shift totals if pharmaceutical waste is not isolated as a distinct service line. |
| Trade Journal B | USD 1.50 B (2022) | Anchors sizing on an older historical year and often applies a conservative uptake curve for take-back and compliant collection, which can understate current service value in faster-adopting regions. |
The spread in the table is mainly explained by what gets counted as pharmaceutical waste services, plus the year used for pricing and adoption assumptions. By keeping the demand pool tied to drug waste definitions, treatment routing, and current service fee logic, the sizing remains easy to follow and can be replicated when new regulation or capacity data appears.


Key Questions Answered in the Report
What is the current size of the pharmaceutical waste management market?
The pharmaceutical waste management market size reached USD 1.61 billion in 2026 and is projected to hit USD 2.18 billion by 2031.
Which region leads the pharmaceutical waste management market?
North America held 39.55% of revenue in 2025, reflecting stringent EPA regulations and well-developed treatment infrastructure.
Why are controlled substances the fastest-growing waste type?
Escalating DEA diversion controls and innovation in non-incineration destruction methods are driving a 7.35% CAGR for controlled-substance disposal services.
How fast are onsite treatment solutions growing?
Onsite technologies such as microwave disinfection are expanding at an 8.21% CAGR as hospitals seek tighter compliance control and lower logistics costs.
What is fueling pharmaceutical waste management market growth in Asia-Pacific?
Rapid expansion of biopharma manufacturing and newly enacted extended-producer-responsibility rules are pushing Asia-Pacific to an 8.47% CAGR through 2031.
How is industry consolidation affecting competition?
Large players like Waste Management and Stericycle are merging to offer integrated services and absorb rising compliance costs, raising barriers for smaller firms while accelerating technology investment.
Page last updated on:


 Your data is secure and never sold or shared.


