
Pharmaceutical Manufacturing Software Market Size and Share
Market Overview
| Study Period | 2020 - 2031 |
|---|---|
| Market Size (2026) | USD 4.01 Billion |
| Market Size (2031) | USD 7.24 Billion |
| Growth Rate (2026 - 2031) | 12.55 % |
| Fastest Growing Market | Asia-Pacific |
| Largest Market | North America |
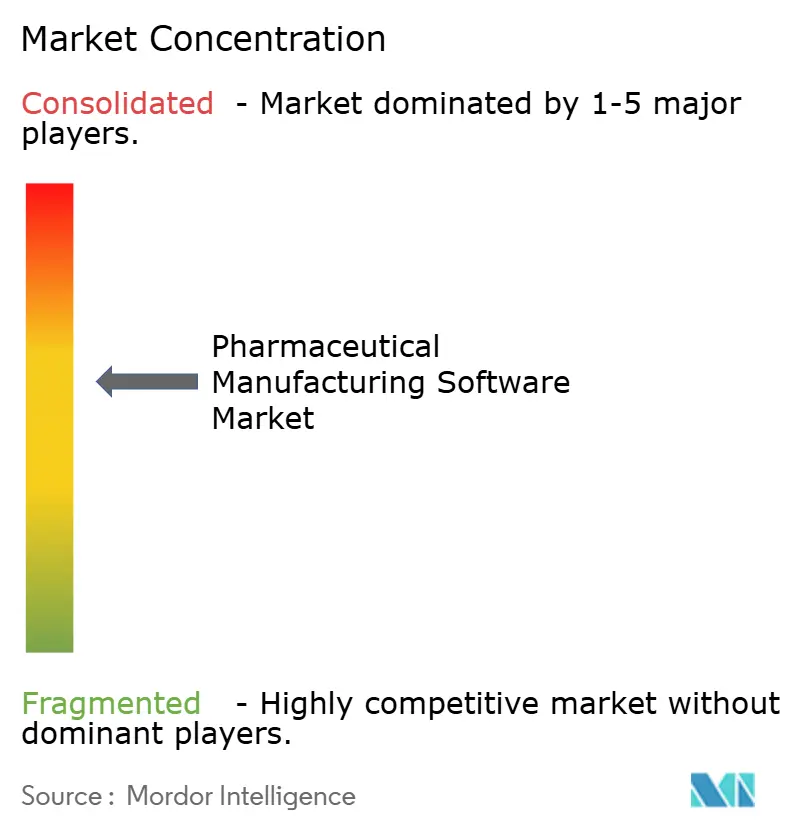
| Market Concentration | Medium |
Major Players *Disclaimer: Major Players sorted in no particular order Image © Mordor Intelligence. Reuse requires attribution under CC BY 4.0. | |
Pharmaceutical Manufacturing Software Market Analysis by Mordor Intelligence
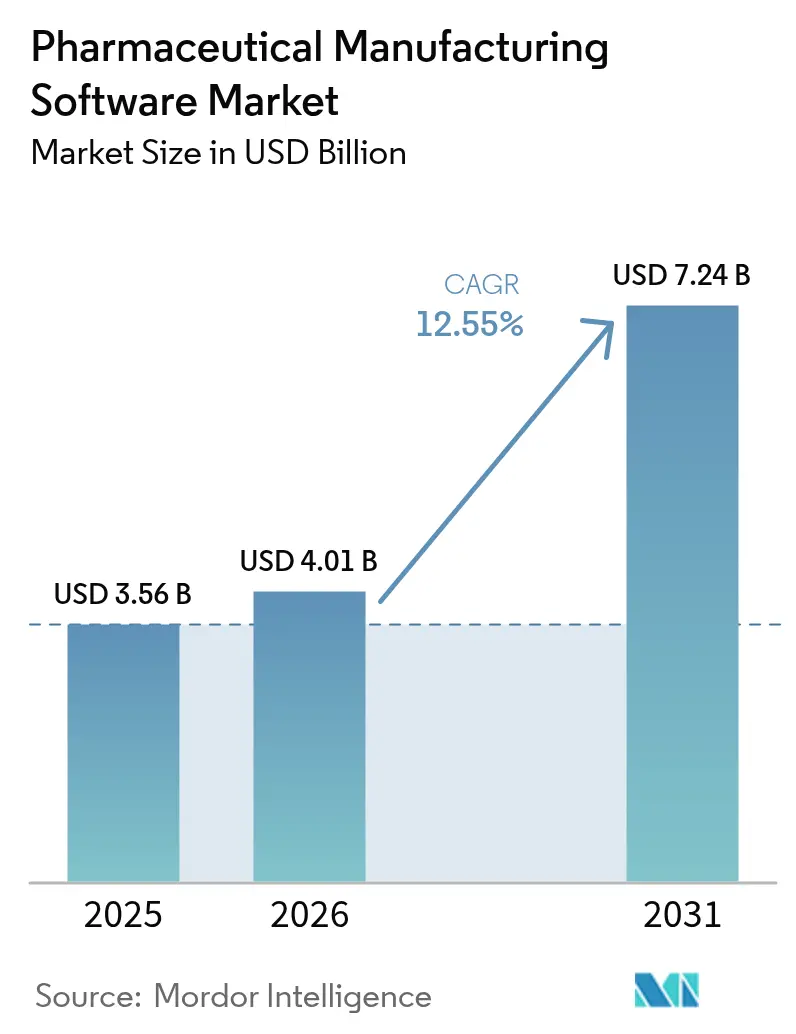
Pharmaceutical Manufacturing Software market size in 2026 is estimated at USD 4.01 billion, growing from 2025 value of USD 3.56 billion with 2031 projections showing USD 7.24 billion, growing at 12.55% CAGR over 2026-2031.
Rising regulatory expectations, cost pressures, and the convergence of artificial intelligence with manufacturing execution systems underpin sustained demand for purpose-built digital platforms. Industry participants move away from fragmented legacy solutions toward unified suites that provide real-time visibility, automated deviation management, and predictive quality controls. Cloud deployment grows quickly as manufacturers balance data-sovereignty needs with the scalability required for multi-site operations. Segment momentum is strongest among small and medium-sized enterprises (SMEs) that now access enterprise-grade capabilities through subscription models, while contract development and manufacturing organizations (CDMOs) accelerate software adoption to support specialized, transferable processes. North America maintains volume leadership thanks to early FDA-driven digitization, yet Asia-Pacific records the fastest growth as regional capacity expansions coincide with national digital-factory programs.
Key Report Takeaways
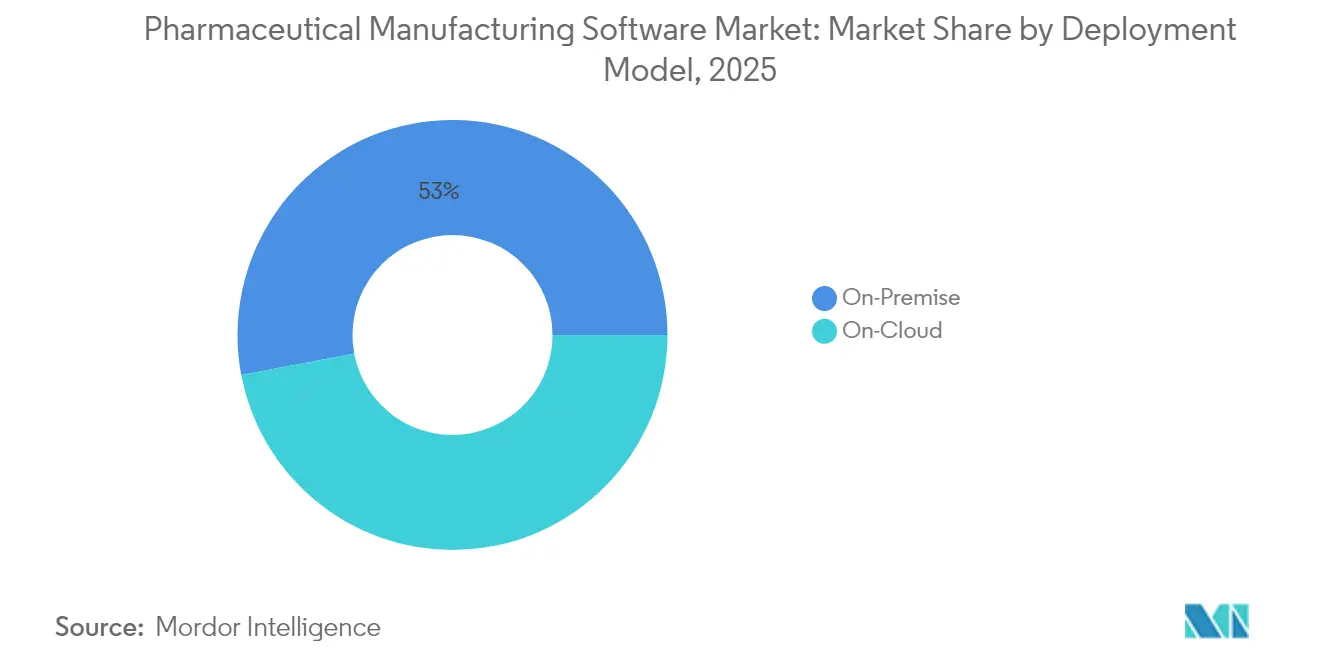
- By deployment model, on-premise solutions led with 52.98% of pharmaceutical manufacturing software market share in 2025, whereas cloud deployments are projected to expand at a 13.28% CAGR through 2031.
- By enterprise size, large enterprises held 60.90% of the pharmaceutical manufacturing software market share in 2025, while SMEs are expected to post the highest 14.29% CAGR to 2031.
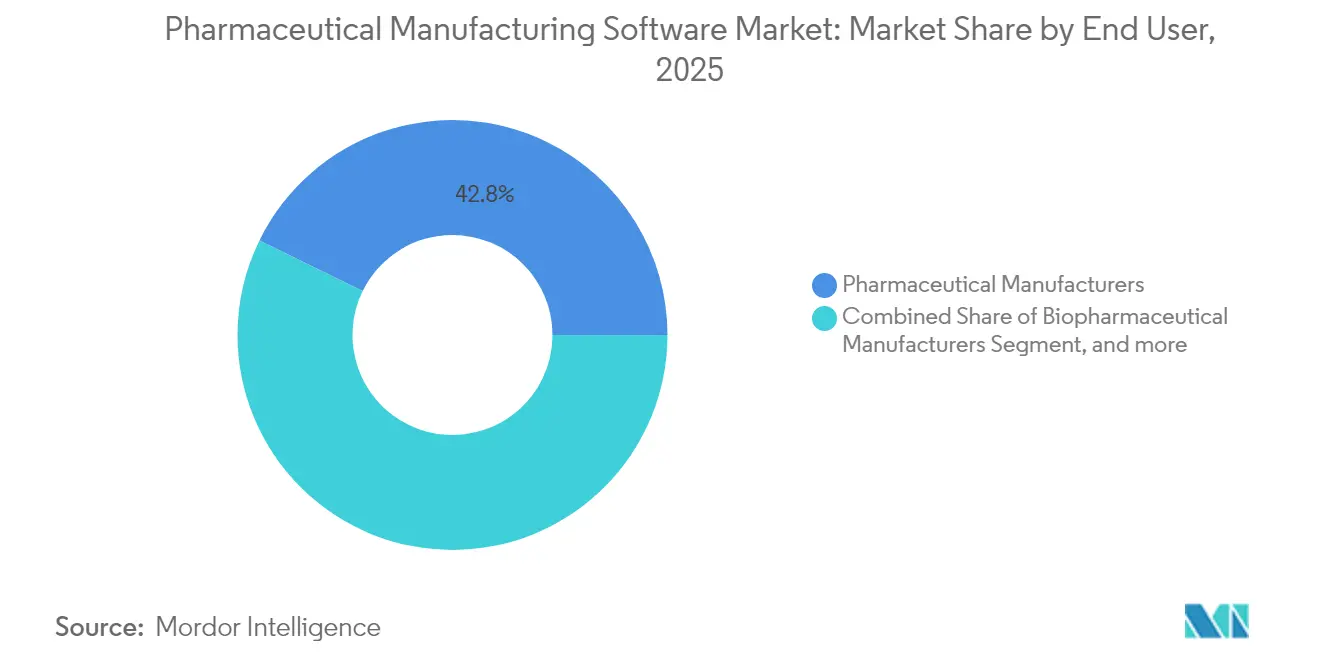
- By end user, pharmaceutical manufacturers held 42.75% of the pharmaceutical manufacturing software market share in 2025 while CDMOs represent the fastest-growing segment with 14.88% at the same CAGR through 2031.
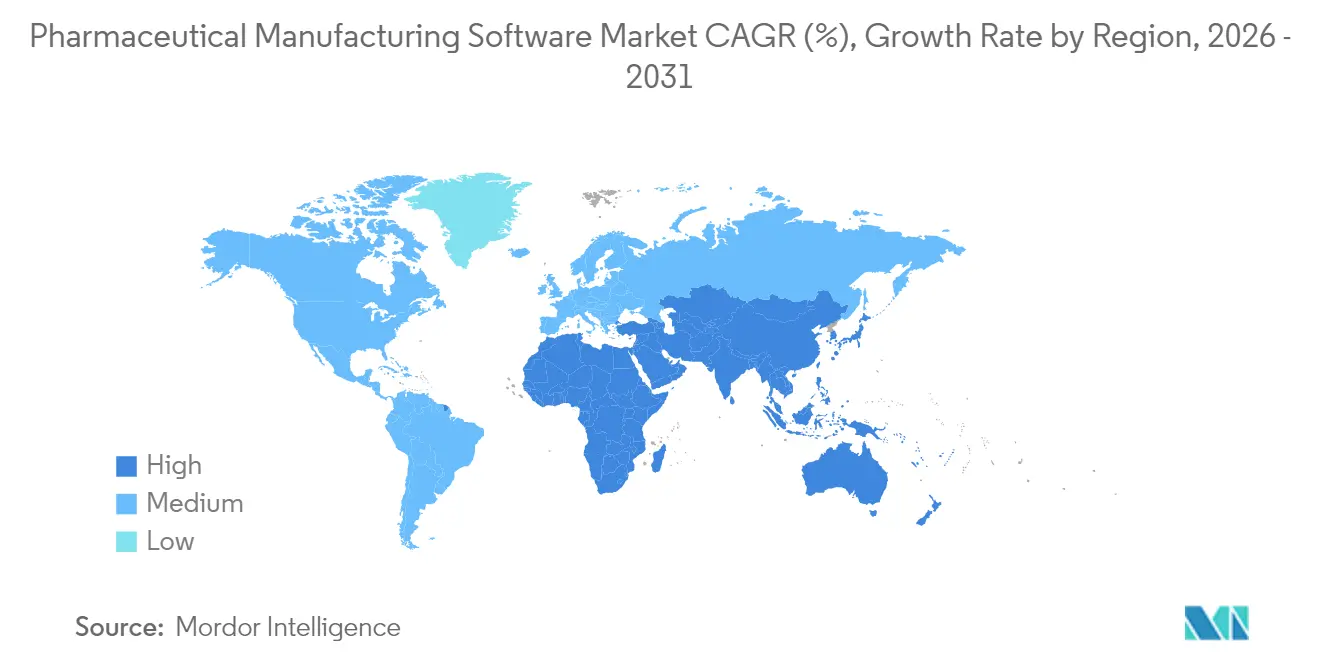
- By geography, North America commanded 40.35% revenue share of the pharmaceutical manufacturing software market in 2025; Asia-Pacific leads future expansion with a 15.18% CAGR to 2031.
Note: Market size and forecast figures in this report are generated using Mordor Intelligence’s proprietary estimation framework, updated with the latest available data and insights as of 2026.
Market Trends and Insights
Drivers Impact Analysis of Pharmaceutical Manufacturing Software Market*
| Driver | (~) % Impact on CAGR Forecast | Geographic Relevance | Impact Timeline |
|---|---|---|---|
| Increasing Adoption of Automation | +2.8% | Global, with early gains in North America & Europe | Medium term (2-4 years) |
| Rising Drug Production Costs | +2.1% | Global, particularly acute in developed markets | Long term (≥ 4 years) |
| Regulatory Compliance Requirements | +3.2% | Global, led by FDA & EMA jurisdictions | Short term (≤ 2 years) |
| Advancements in Cloud-Based Solutions | +1.9% | North America & APAC core, spill-over to Europe | Medium term (2-4 years) |
| Growing Demand for Data-Driven Decision Making | +1.7% | Global, with concentration in innovation hubs | Medium term (2-4 years) |
| Expansion of Pharmaceutical Supply Chains | +1.4% | APAC core, spill-over to MEA & Latin America | Long term (≥ 4 years) |
| Source: Mordor Intelligence | |||
Increasing Adoption of Automation
Manufacturers invest in robotics and integrated manufacturing execution systems (MES) to offset labor shortages and drive consistent quality. Predictive maintenance tools connected to MES cut unplanned downtime by up to 25% in validated facilities. Continuous manufacturing, which replaces static batch runs with dynamic flows, demands software that recalculates recipes in real time and reconciles streaming sensor data with electronic batch records. Japanese firms have piloted fully automated cell therapy suites that link robotics with MES to trim cycle times while preserving compliance. Automation also supports data-rich digital twins for process optimization, enabling faster scale-up when therapies advance from clinic to commercial production.
Rising Drug Production Costs
High-value biologics, complex formulations, and volatile raw-material prices heighten cost pressures. Advanced analytics platforms simulate multiple production scenarios, helping identify optimal run rates and ingredient yields. Plants using such models have reported 15-20% reductions in material waste after six months in operation.[1]NVIDIA Corporation, “Gefion Supercomputer Accelerates Pharmaceutical AI,” nvidia.com Energy-management modules integrated into MES monitor utilities in real time, cutting consumption without compromising Good Manufacturing Practice (GMP) standards. These savings offset rising specialty-ingredient costs and help facilities meet corporate sustainability pledges.
Regulatory Compliance Requirements
The FDA’s guidance on data integrity requires auditable electronic records and secure electronic signatures, prompting widespread adoption of validated software that embeds 21 CFR Part 11 controls.[2]U.S. Food & Drug Administration, “Data Integrity and Compliance With Drug CGMP,” fda.gov Europe’s EMA emphasizes quality-by-design principles, driving demand for platforms that can demonstrate process understanding throughout a product’s lifecycle.[3]European Medicines Agency, “GMP Annex 1 Revision,” ema.europa.eu Serialization mandates across more than 50 jurisdictions necessitate track-and-trace modules integrated into MES so that serial numbers traverse packaging, warehousing, and distribution seamlessly. Artificial intelligence layers now flag deviations in near real time, reducing batch-release delays and minimizing the risk of warning letters.
Advancements in Cloud-Based Solutions
Pharmaceutical-specific virtual private clouds certified to GMP standards have eased earlier security concerns. Hybrid architectures place regulated master data on-premise while using cloud analytics for multivariate process analysis. Vendors such as Körber migrated their PAS-X MES to Microsoft Azure to provide elasticity during scale-up, shortening deployment from months to weeks for greenfield facilities. SMEs favor subscription pricing that converts capital outlays into predictable operating expenses and grants them access to frequent functional upgrades.
Restraints Impact Analysis of Pharmaceutical Manufacturing Software Market*
| Restraint | (~) % Impact on CAGR Forecast | Geographic Relevance | Impact Timeline |
|---|---|---|---|
| High Implementation Costs | -1.8% | Global, particularly acute for SMEs | Short term (≤ 2 years) |
| Complex Integration with Legacy Systems | -2.1% | Global, concentrated in established markets | Medium term (2-4 years) |
| Data Security and Privacy Concerns | -1.4% | Global, with heightened focus in EU & North America | Medium term (2-4 years) |
| Lack of Standardization | -1.2% | Global, most pronounced in emerging markets | Long term (≥ 4 years) |
| Source: Mordor Intelligence | |||
High Implementation Costs
Validation expenses can exceed initial licensing fees by as much as 300% because every code change demands documentation that satisfies GMP auditors. Smaller firms frequently outsource implementation and validation to specialist integrators, increasing total project budgets. Although long-term returns often exceed 25% through productivity gains and fewer compliance findings, near-term cash-flow constraints still deter some first-time buyers. Government tax incentives for digital-factory investments have begun to ease the barrier in select markets.
Complex Integration with Legacy Systems
Many plants still run bespoke supervisory control and data acquisition (SCADA) tools built decades ago without standardized application programming interfaces. Harmonizing these systems with modern MES requires custom middleware and meticulous data-migration tasks to avoid losing historical batch records. Maintaining validation status during staged rollouts adds additional testing cycles and documentation. Companies often opt for modular implementations, but interim data silos can persist until complete migration is finalised, temporarily reducing real-time visibility across multi-site networks.
*Our forecasts treat driver/restraint impacts as directional, not additive. The impact forecasts reflect baseline growth, mix effects, and variable interactions.
Pharmaceutical Manufacturing Software Market Segment Analysis
By Deployment Model:
Cloud Gains Momentum Despite On-Premise DominanceOn-premise platforms retained 52.98% share of the pharmaceutical manufacturing software market in 2025 because large manufacturers prefer direct control of validated infrastructure. However, cloud solutions are forecast to grow at a 13.28% CAGR, reflecting enhanced cybersecurity certifications and regulator acceptance of virtual private cloud environments. Hybrid models dominate new projects, allowing master batch records to remain on-premise while analytics run in the cloud for burst compute requirements.
Cloud adoption also benefits SMEs that lack dedicated data-center resources. Subscription pricing reduces capital expenditure, and built-in validation templates shorten qualification timelines. Global enterprises adopt multi-tenant architectures to harmonize processes across product lines, driving demand for open application programming interface frameworks that integrate MES with enterprise resource planning (ERP) and laboratory information management systems. Vendors now embed machine-learning operations pipelines to refine predictive-quality models continuously, strengthening the value proposition of cloud MES.


By Enterprise Size:
SMEs Drive Growth Despite Large-Enterprise DominanceLarge corporations commanded 60.90% of pharmaceutical manufacturing software market share in 2025, leveraging global IT teams to deploy uniform suites across dozens of sites. These companies prioritize end-to-end digital threads that link early-stage development to commercial production. Yet SMEs are expected to advance at a 14.29% CAGR as cloud provisioning and modular architectures lower entry barriers.
For SMEs, preconfigured GMP workflows minimize validation overhead, while role-based dashboards simplify user adoption. Implementation cycles can conclude in less than nine months, compared with multiyear rollouts in large multinational settings. Investors recognize the opportunity; QbDVision secured USD 13 million in 2025 to accelerate deployment of its Digital CMC platform for mid-market biopharma manufacturers finsmes.com. As SMEs scale production of niche therapies, they often require flexible batch sizes, which cloud MES supports through elastic compute and standard connectors to single-use equipment.
By End User:
CDMOs Lead Growth as Outsourcing AcceleratesTraditional pharmaceutical companies retained 42.75% revenue share in 2025, but CDMOs are projected to expand at a 14.88% CAGR, making them the fastest-growing end-user group within the pharmaceutical manufacturing software market. Outsourcing rises as innovators focus on discovery while entrusting production to partners specializing in continuous processing, aseptic fill-finish, or advanced biologics.
CDMOs compete on technology differentiation, investing in AI-enhanced MES to offer sponsors predictive process-capability dashboards and accelerated tech-transfer routines. These systems streamline onboarding of multiple client products while safeguarding confidential process parameters inside secure data vaults. Biologics-focused CDMOs deploy cell-culture optimization modules that analyze viability, titer, and metabolite profiles in real time. Combined with electronic batch recording, such capabilities shorten batch-release cycles and reduce cost-of-goods, reinforcing CDMOs’ strategic importance to late-stage pipeline acceleration.
Geography Analysis
North America Pharmaceutical Manufacturing Software Market
North America held 40.35% of pharmaceutical manufacturing software market revenue in 2025. Strict FDA enforcement of data-integrity guidance drives universal adoption of electronic batch records and audit-ready deviation management modules. Oracle’s recent expansion of AI-enabled health applications in Canada exemplifies regional appetite for cloud infrastructures, with the firm forecasting a 70% rise in related sales for 2025. United States facilities leverage enterprise-wide MES rollouts to synchronise production across biologics and small-molecule plants, improving capacity utilisation and reducing lot-release times.
APAC Pharmaceutical Manufacturing Software Market
Asia-Pacific is the fastest-growing region, registering a 15.18% CAGR through 2031. China and India upgrade plants to meet global GMP standards, with local regulators aligning data-integrity frameworks to facilitate export licensing. Japanese manufacturers lead regional automation pilots; Chugai Pharmaceutical reports cycle-time reductions after implementing an integrated digital-factory program, while Astellas formed a joint venture with Yaskawa Electric to create a robotics-based cell-therapy manufacturing platform. Government subsidies targeting Industry 4.0 adoption and foreign direct investment in greenfield biologics facilities further propel regional software demand.
Europe Pharmaceutical Manufacturing Software Market
Europe maintains steady momentum as EMA guidance promotes quality-by-design and sustainability. German clusters attract fresh capital from multinational firms seeking advanced production ecosystems, and the regional market favours platforms that track carbon emissions in real time. Brexit-driven supply-chain complexities boost adoption of visibility solutions to manage cross-channel batch documentation. Cloud-native deployments gain traction as data-sovereignty concerns ease within the confines of European-based data centres.
MEA and South America Pharmaceutical Manufacturing Software Market
The Middle East & Africa and South America remain nascent but exhibit rising adoption as domestic producers seek international quality certifications. Incentives in Saudi Arabia’s National Industrial Strategy and Brazil’s digital-health roadmap encourage investment in validated MES, yet capital constraints and limited skilled labour temper short-term uptake. Vendors offering modular, subscription-based solutions are well positioned to capture early adopters in these emerging markets.

Regulatory Landscape
Regulation remains a key adoption catalyst for validated manufacturing platforms that support auditable electronic records, secure e-signatures, and data-integrity controls aligned to cGMP expectations. In February 2026, the US FDA issued its final guidance on Computer Software Assurance (CSA) for Production and Quality Management System software, reinforcing a risk-based approach to assurance activities for software used in regulated operations. This affects how manufacturers document and validate changes across MES, eBR, and QMS-adjacent workflows.
In Europe, EMA inspectorate priorities are becoming more specific around computerized systems and AI use in GMP, which increases the compliance burden for vendors embedding advanced analytics into shop-floor execution. In January 2026, the EMA GMP/GDP Inspectors Working Group published a concept paper to revise Annex 15 (Qualification and Validation), and the group followed with the 2026-2028 GMP work plan that prioritizes updates to Annex 11 (Computerised Systems) and development of a new Annex 22 focused on Artificial Intelligence, supported by a multistakeholder workshop in May 2026. Parallel harmonization work under ICH, including ICH Q13 on continuous manufacturing and a March 2026 ICH reflection paper on advanced manufacturing, also raises expectations around robust data governance, model oversight, and traceable process-control strategies for software supporting continuous and hybrid production.
Competitive Landscape
The pharmaceutical manufacturing software market displays moderate consolidation as enterprise software giants acquire specialist capabilities and niche vendors innovate around cloud-native architectures. Siemens completed its USD 5.1 billion acquisition of Dotmatics in April 2025, integrating AI-driven discovery informatics with manufacturing execution to offer a seamless data continuum from molecule design to finished product. Oracle and SAP embed generative AI aides within their GMP workflow modules, guiding operators through complex exception handling while preserving electronic signatures.
Traditional MES stalwarts such as Körber and Honeywell modernize product lines with low-code configuration layers and containerized deployment options. Körber’s PAS-X in the cloud provides on-demand scalability for multi-site CDMO networks, whereas Honeywell integrates digital-twin engines for process-capability predictions. Technology competition increasingly centres on analytics sophistication, cybersecurity certifications, and the depth of out-of-the-box regulatory content.
Specialist challengers focus on speed and flexibility. QbDVision positions its Digital CMC platform as a plug-and-play solution for SMEs requiring right-sized validation templates, while Aizon targets electronic batch record (eBR) conversion with AI-enabled paper-to-digital utilities. Vendors also differentiate through application-programming-interface ecosystems that simplify connections with laboratory, quality, and supply-chain systems. Sustainability analytics and Internet of Things integrations emerge as white-space opportunities, prompting strategic partnerships between MES providers and sensor manufacturers to deliver energy-intensity dashboards and environmental-impact traceability.
Pharmaceutical Manufacturing Software Industry Leaders
BatchMaster Software
Vormittag Associates, Inc.
Oracle
Sage Group plc
MasterControl
- *Disclaimer: Major Players sorted in no particular order
Pharmaceutical Manufacturing Software Market Companies Covered in this Report
- Oracle
- SAP
- Siemens Healthineers
- ABB Ltd
- Körber Pharma
- Rockwell Automation
- Honeywell International
- Emerson Electric
- Infor
- Dassault Systèmes
- AspenTech
- MasterControl
- BatchMaster Software
- Sage Group plc
- Deskera
- Intellect
- Fishbowl
- Datacor Chempax
- Aquilon Software
- Logic ERP Solutions
- Vormittag Associates
Read Analysis of Pharmaceutical Manufacturing Software Companies

Market Opportunities and Future Outlook
Software demand is expanding beyond core MES execution toward validated, end-to-end digital threads that can evidence control across distributed operations, continuous manufacturing, and AI-assisted decisioning. The FDA's July 2026 proposed rule to modernize drug manufacturing registration, including a streamlined pathway for distributed manufacturing using a hub-and-spoke model, creates room for platforms that manage site networks, recipe and master data governance, electronic batch records, and release-by-exception workflows, while preserving consistent audit trails across nodes. In the United States, higher visibility expectations for upstream supply chains, including provisions that strengthen registration requirements for foreign establishments involved in manufacturing or processing drugs imported into the country, reinforce the need for integrated genealogy, supplier and material traceability, and cross-site documentation controls.
AI governance is increasingly a buying criterion as regulators formalize expectations and enforcement attention increases. The EMA's 2026-2028 GMP work plan and work toward a new Annex 22 on Artificial Intelligence, alongside FDA scrutiny of AI use in manufacturing in 2026, points to opportunities for vendors that package validated AI lifecycle management (data integrity, versioning, explainability artifacts, human oversight, and change control) within MES and quality workflows. Manufacturers are also investing in digital twins and predictive quality tools to support scale-up and deviation detection, illustrated by Eli Lilly's 2026 activity around using digital twin technology and AI to simulate scale-up and predict batch outcomes, which raises the bar for tighter integration between execution data, process models, and compliant review processes in manufacturing software.
Recent Industry Developments in Pharmaceutical Manufacturing Software Market
- February 2026: Oracle announced new capabilities in Oracle Fusion Cloud Supply Chain and Manufacturing to support process manufacturing by connecting formulas and recipes with materials management and batch execution. The update strengthens cloud-based orchestration for regulated batch environments where tight control of recipes, inventory, and shop-floor execution data underpins compliant operations.
- February 2026: BatchMaster Software announced the general availability of BME Web ERP 9.0 with AI-oriented capabilities for process manufacturers. The release highlights continued product investment in web-based ERP and manufacturing workflows that can be configured for regulated industries, supporting broader modernization away from legacy on-premise deployments.
- December 2024: Oracle released updates to Oracle Life Sciences Empirica to streamline safety signal management and compliance in the cloud. While centered on pharmacovigilance, the upgrade supports the broader shift toward cloud-validated platforms in life sciences, tightening data governance and traceability requirements across connected manufacturing and quality ecosystems.


Pharmaceutical Manufacturing Software Market Report Scope and Research Methodology
Market Definition and Coverage
This market covers software used directly in licensed pharmaceutical production plants to run and document manufacturing operations, including shop-floor execution, electronic batch records, batch genealogy, quality documentation, inventory control, and integrated MRP or ERP workflows across the plant.
Scope exclusions: We do not count discovery informatics suites, standalone LIMS used only for lab workflows, or general office productivity tools.
Segments Covered in This Report
- By Deployment Model
- On-Cloud
- On-Premise
- By Enterprise Size
- Large Enterprises
- Small & Medium-Sized Enterprises (SMEs)
- By End User
- Pharmaceutical Manufacturers
- Biopharmaceutical Manufacturers
- Contract Development & Manufacturing Organisations (CDMOs)
- By Geography
- North America
- United States
- Canada
- Mexico
- Europe
- Germany
- United Kingdom
- France
- Italy
- Spain
- Rest of Europe
- Asia-Pacific
- China
- Japan
- India
- Australia
- South Korea
- Rest of Asia-Pacific
- Middle East & Africa
- GCC
- South Africa
- Rest of Middle East & Africa
- South America
- Brazil
- Argentina
- Rest of South America
- North America
Data Sources, Market Sizing, and Validation
Desk Research
Desk research was used to build the starting data layer and to set practical guardrails around demand, regulation, and adoption timing. We reviewed public regulatory and compliance references that drive software needs in plants, plus manufacturing and trade signals that point to capacity additions and site expansions.
Sources used include public and official materials such as FDA guidance and databases, EMA publications, OECD health statistics, World Bank macro indicators, and WTO trade statistics. We also referenced peer-reviewed journals that cover pharma manufacturing quality systems. On the commercial side, we used company annual reports, investor presentations, and credible industry news to understand product positioning, deployment patterns, and how spend is split across plants, lines, and validation work. Where required, paid database subscriptions were used only for company financials and intelligence, news and financials, and patent databases to cross-check timelines and product direction. These desk sources are not exhaustive, and we also referenced other public documents and datasets during data collection, validation, and clarification.
Primary Interviews and Surveys
Primary interviews and surveys were used to confirm what is actually purchased at the plant level, how contracts are structured, and which adjacent software categories should not be mixed into the core market. We spoke with a balanced mix of software suppliers, implementation partners, and pharma and CDMO users across major regions, then used the inputs to align adoption assumptions with real buying cycles and validation requirements.
Distribution of primary research fieldwork respondents
| Company type | Respondent position | Region |
|---|---|---|
| Top tier: 33% | CXOs: 18% | APAC: 43% |
| Mid tier: 47% | Functional/Unit leaders: 28% | EMEA: 33% |
| Smaller Players: 20% | Managers: 54% | Americas: 24% |
Market-Sizing & Forecasting
Sizing was built using a top-down and bottom-up approach. The main model starts from the global pharma manufacturing footprint and digitization needs, then is reconstructed through adoption and spend layers. In practice, plant counts, production expansion signals, and compliance-driven digitization intensity were used to estimate how much software is deployed in manufacturing sites, and how fast replacements and upgrades happen.
To keep the model grounded, we prioritized repeatable inputs such as the share of sites moving to electronic batch records, the rate of new line additions and brownfield upgrades, the split between on-premise and secure cloud deployments, typical multi-year renewal patterns, and implementation plus validation effort that is bundled into software deals. Pricing was treated through blended ASP bands adjusted by plant size and number of lines. Where direct disclosure was missing, we filled gaps using proxy ranges from similar regulated manufacturing environments. Forecasting used scenario analysis with a central case, with variable paths set using interview consensus around compliance deadlines, cloud validation readiness, and pharma capex cycles. We then stress-tested the central path against slower budget environments and faster digital transformation cycles.
Data Validation & Update Cycle
Outputs were checked against independent signals, including public announcements of plant expansions, shifts in regulated digital documentation requirements, and software revenue exposure implied in filings. When a region or deployment mode produced an outlier, assumptions were revisited, and where needed a follow-up call was used to confirm what had changed in buying behavior.
Before sign-off, the model goes through multi-step analyst review, where calculations, conversion logic, and growth drivers are rechecked for internal consistency across years and regions. Reports are refreshed annually, and interim updates are made when material events occur, such as major regulatory changes, large M&A, or abrupt shifts in cloud validation adoption. Right before delivery, we run a final update pass so the view reflects the latest available information.
Mordor Intelligence's Pharmaceutical Manufacturing Software Market Size Compared With Other Published Estimates
It is common to see different market values for pharmaceutical manufacturing software because publishers do not always count the same software boundary, and timing choices can shift results by year. Differences can also come from how vendors bundle implementation and validation services into software contracts, and whether the study treats subscription revenue differently from perpetual licenses.
The biggest gap drivers here tend to be whether adjacent lab-only tools are included, whether enterprise-only ERP spend is mixed into plant execution software, and how cloud transition is modeled. Some estimates also apply a single global ASP trend, even though regulated plants often show step changes after major compliance projects. This is why our assumptions were repeatedly cross-checked through interviews and public signals before totals were finalized, a scope and refresh choice applied by Mordor Intelligence.
Benchmark comparison
| Source | Market Size | Gaps in Research Methodology |
|---|---|---|
| Mordor Intelligence | USD 4.01 B (2026) | |
| Industry Report A | USD 3.30 B (2024) | Uses an earlier base year and appears to mix plant manufacturing software with a wider set of pharma operational software, which can dilute the core manufacturing-only scope and shift value into a different year. |
| Trade Publication B | USD 3.40 B (2024) | Cites a single-point value based on historical tracking and broad category definitions, which likely undercounts validation-linked contract value and does not clearly separate standalone lab systems from plant execution workflows. |
Overall, the spread is explained by year alignment and what is counted as manufacturing software versus adjacent lab and enterprise tools. By keeping the scope tied to licensed production plant workflows and then checking assumptions through interviews and external signals, the resulting number stays traceable to clear demand drivers and repeatable steps.


Key Questions Answered in the Report
What is the current size of the pharmaceutical manufacturing software market?
The market is valued at USD 4.01 billion in 2026 and is forecast to reach USD 7.24 billion by 2031.
Which deployment model is growing fastest?
Cloud-based solutions are expanding at a 13.28% CAGR, outpacing on-premise installations as security certifications mature.
Why are CDMOs adopting software faster than drug innovators?
CDMOs invest in advanced MES to differentiate services, streamline tech transfer, and support multi-client operations, resulting in a 14.88% CAGR.
How do regulations influence software adoption?
FDA and EMA data-integrity guidelines mandate auditable electronic records, driving accelerated rollout of validated digital platforms across all regions.
What challenges limit software uptake among SMEs?
High validation costs and integration with legacy systems remain primary barriers, though modular cloud offerings are lowering entry hurdles.
Which region will contribute most to future market growth?
Asia-Pacific leads in growth at a projected 15.18% CAGR, supported by capacity expansion in China, India, and Japan and government incentives for digital factories.
Page last updated on:


 Your data is secure and never sold or shared.


