
Pharmaceutical Management Software Market Size and Share
Market Overview
| Study Period | 2021 - 2032 |
|---|---|
| Market Size (2027) | USD 4.10 Billion |
| Market Size (2032) | USD 7.12 Billion |
| Growth Rate (2027 - 2032) | 11.67 % |
| Fastest Growing Market | North America |
| Largest Market | Asia-Pacific |
| Market Concentration | Medium |
Major Players *Disclaimer: Major Players sorted in no particular order Image © Mordor Intelligence. Reuse requires attribution under CC BY 4.0. | |
Pharmaceutical Management Software Market Analysis by Mordor Intelligence
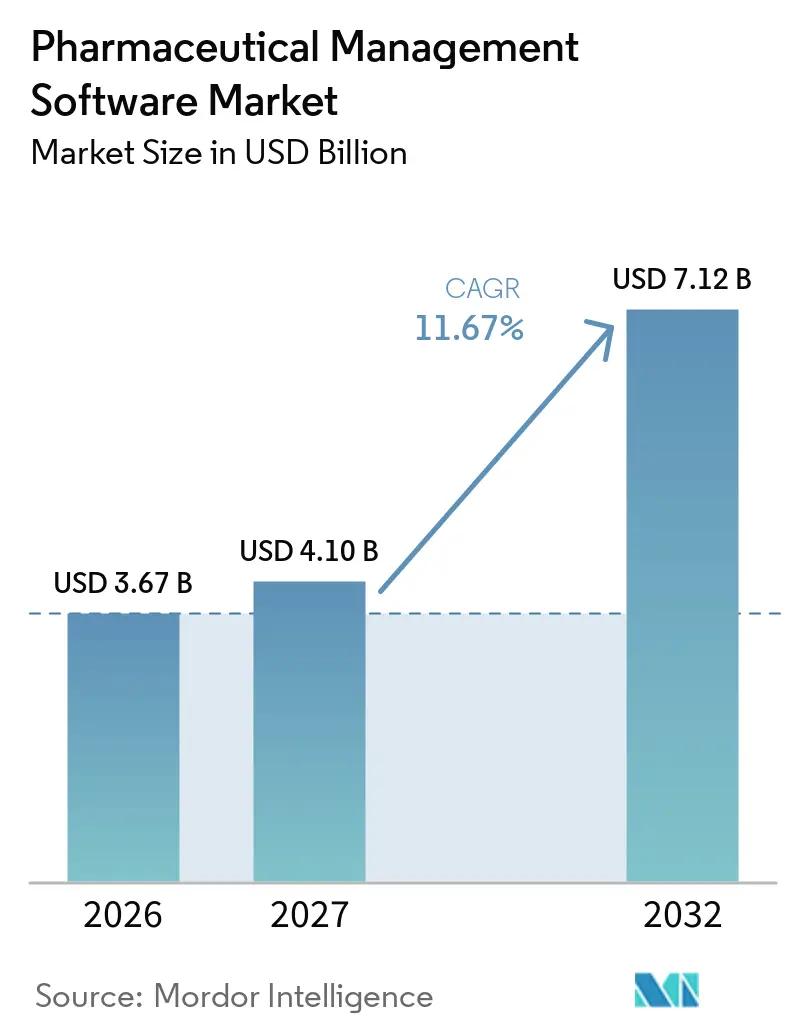
The Pharmaceutical Management Software Market size is expected to increase from USD 3.67 billion in 2026 to USD 4.10 billion in 2027 and reach USD 7.12 billion by 2032, growing at a CAGR of 11.67% over 2027-2032.
Heightened global compliance mandates, the rapid migration toward validated cloud services, and the growing complexity of biologics are accelerating spending on platform integrations that unify quality, manufacturing, and regulatory data. Vendors that can embed immutable audit trails, role-based access controls, and e-signature workflows into configurable solutions are capturing early-mover advantages as companies revalidate legacy systems to meet the European Medicines Agency’s expanded Annex 11 draft. Demand is further strengthened by the expansion of decentralized clinical trials that require remote patient monitoring, e-consent, and real-time submission workflows. Cybersecurity incidents such as the Change Healthcare breach underscore the need for ISO 27001-aligned architectures, pushing buyers toward providers that pair software with zero-trust security toolkits. In parallel, sovereign-AI regulations in Europe and China are steering the pharmaceutical management software market toward hybrid deployments in which sensitive batch-genealogy data remain on-premise while analytics layers run in regional clouds.
Key Report Takeaways
- By solution type, manufacturing execution systems led the pharmaceutical management software market with 36.12% market share in 2026. Quality and compliance management solutions are projected to expand at a 13.06% CAGR through 2032, the fastest among all categories.
- By deployment model, on-premises systems accounted for 55.87% of the pharmaceutical management software market in 2026, whereas cloud-based systems are forecast to grow at a 12.63% CAGR through 2032.
- By end user, pharmaceutical companies held a 61.03% share of the pharmaceutical management software market in 2026; biotechnology firms recorded the highest projected CAGR at 12.18% through 2032.
- By geography, North America led with 41.18% revenue share in 2026, while Asia-Pacific is advancing at a 14.71% CAGR over 2027-2032.
Note: Market numbers in this report are based on Mordor Intelligence's proprietary estimation framework, which combines nine months of actuals with Q4 projections for base year 2026.
Market Trends and Insights
Drivers Impact Analysis of Pharmaceutical Management Software Market*
| Driver | (~) % Impact on CAGR Forecast | Geographic Relevance | Impact Timeline |
|---|---|---|---|
| AI-driven predictive quality analytics reduces batch-failure costs | +3.2% | Global, concentrated in advanced manufacturing hubs | Medium term (2-4 years) |
| Cloud-first ERP migration across Big Pharma | +2.8% | Global, with North America & EU leading adoption | Medium term (2-4 years) |
| Mandatory serialization/track-&-trace enforcement in low- and middle-income countries | +2.4% | APAC core, spill-over to MEA and Latin America | Short term (≤ 2 years) |
| Cyber-resilience mandates from regulators (FDA, EMA) | +2.1% | Global, with stricter enforcement in developed markets | Short term (≤ 2 years) |
| Biologics manufacturing complexity driving MES–ERP convergence | +1.8% | North America & EU, emerging in APAC | Long term (≥ 4 years) |
| Shift toward decentralized & virtual clinical trials | +1.5% | North America & EU, expanding to APAC | Long term (≥ 4 years) |
| Source: Mordor Intelligence | |||
Stringent Global Compliance Mandates Accelerate Software Validation Investments
The European Medicines Agency draft released in 2025 stretched Annex 11 from five to nineteen pages, forcing manufacturers to upgrade audit-trail logic, supplier-qualification protocols, and data-integrity testing.[1] The United States continues to strictly enforce 21 CFR Part 11, with 2024 warning letters citing validation gaps in 23% of inspections. WHO Technical Report Series 1033 codifies ALCOA+ principles, effectively prohibiting post-hoc edits to batch data. China’s National Medical Products Administration now demands local hosting or live regulatory access for foreign software, tightening oversight on multinational platforms. Together, these mandates are expanding validation budgets and pushing the pharmaceutical management software market toward configurable, compliance-ready suites.
Rapid Migration to Cloud / SaaS Platforms Balances Agility With Data Sovereignty
Cloud uptake is rising, yet patterns diverge by workload. North American firms push commercial analytics into public cloud environments while retaining batch records on-premises for tighter control.[2] Veeva reported that 78% of new Vault QMS clients chose multi-tenant SaaS in 2025, though 64% deployed Vault Manufacturing on private instances to comply with residency clauses. The European Union’s GDPR and pending AI Act trigger a 15-20% cost premium as organizations add sovereign-cloud controls. SAP’s S/4HANA Life Sciences sovereign-cloud launch in October 2025 demonstrates the vendor's pivot toward regional compliance. SaaS inflation, averaging 8-12% per annum, is prompting mid-tier buyers to revisit lifetime economics, slowing pure-cloud migrations in inflationary economies.
Growth of Biologics & Personalized Medicine Fragments Batch Architectures
Personalized medicine is fragmenting batches into single-patient lots that still need full validation. Siemens noted that 42% of new cell-therapy customers required electronic health-record links in 2025, a feature absent from small-molecule lines. Contract manufacturers such as Lonza are investing in modular suites like Siemens Opcenter Execution Pharma to orchestrate parallel autologous campaigns at scale.
Mandatory Electronic Batch-Record Adoption Eliminates Paper Deviations
The eBR segment is projected to expand from USD 734.85 million in 2026 to USD 1.92 billion by 2035 as regulators reject paper workflows. FDA data-integrity guidance states that manual logs cannot supply the same contemporaneous evidence as validated digital records. MasterControl’s 2025 survey shows eBR users reduced average deviation investigation time from 28 days to 11 days, freeing quality resources for proactive analytics. Implementation costs of USD 500,000–2 million still deter some mid-size firms, but CDMOs offer pre-validated platforms to lower CapEx barriers.
Restraints Impact Analysis of Pharmaceutical Management Software Market*
| Restraint | (~) % Impact on CAGR Forecast | Geographic Relevance | Impact Timeline |
|---|---|---|---|
| High Implementation & Validation Cost | -1.4% | Global, acute in emerging markets & mid-tier firms | Short term (≤ 2 years) |
| Cyber-Security & Data-Sovereignty Concerns | -1.1% | EU & APAC data-residency mandates, US breach exposure | Medium term (2-4 years) |
| Regulatory Patchwork Triggers Frequent Re-Validation Cycles | -0.9% | Multinational deployments across FDA, EMA, NMPA jurisdictions | Long term (≥ 4 years) |
| Rising SaaS Subscription TCO In Inflationary Markets | -0.7% | North America & Europe SaaS-heavy deployments | Short term (≤ 2 years) |
| Source: Mordor Intelligence | |||
High Implementation & Validation Cost Constrains Mid-Tier Adoption
Total project budgets range from USD 1.5 million for single-site QMS to more than USD 10 million for enterprise MES-ERP roll-outs, driven by installation, operational, and performance qualifications.[3] European Annex 11 supplier audits can add 25% to baseline costs relative to non-regulated roll-outs. External validation consultants bill USD 1,200-2,500 per day, prolonging timelines for firms with limited in-house expertise. Although CDMOs supply turn-key, pre-validated environments, clients trade configurability for speed, heightening vendor lock-in concerns.
Cyber-Security & Data-Sovereignty Concerns Fragment Deployment Topologies
The February 2024 Change Healthcare ransomware event compromised more than 100 million records and cost USD 872 million in remediation, amplifying scrutiny on third-party software chains. EU GDPR fines top 4% of global revenue, while China’s Data Security Law forces domestic hosting of sensitive health data, splintering global architectures into regional silos. Companies now demand ISO 27001 and annual penetration tests as part of software contracts, raising operating budgets by about 10-15%.
*Our forecasts treat driver/restraint impacts as directional, not additive. The impact forecasts reflect baseline growth, mix effects, and variable interactions.
Pharmaceutical Management Software Market Segment Analysis
By Solution Type:
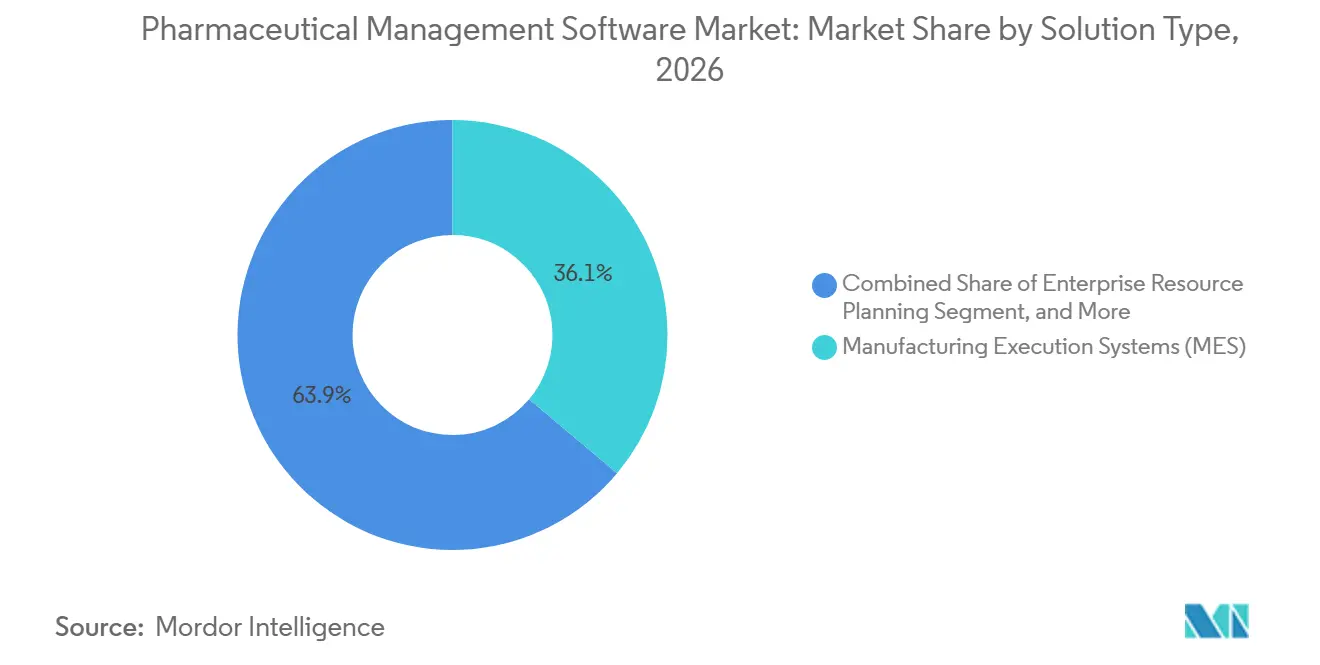
Compliance Suites Drive Uptake Beyond Traditional ERPManufacturing execution systems accounted for 36.12% of the pharmaceutical management software market share in 2026, underpinned by their ability to orchestrate real-time batch execution, equipment integration, and lot genealogy across sterile suites. Quality and Compliance Management platforms, including eBR, are projected to post a 13.06% CAGR through 2032, reflecting regulatory emphasis on immutable audit trails and supplier qualification. Pharmaceutical management software market size allocations continue shifting as companies favor modular, compliance-ready layers over sprawling transactional ERP refreshes, evidenced by enterprise resource planning growth lagging newer quality modules.
Demand is also increasing for supply-chain and inventory suites that embed serialization rules from the US Drug Supply Chain Security Act and the EU Falsified Medicines Directive, enabling full chain-of-custody from API procurement through retail dispense. Customer and Commercial applications capture early traction among firms piloting direct-to-patient programs and value-based contracts. Knowledge and Data Management hubs are emerging as strategic assets, providing unified repositories that support AI-driven signal detection and real-world evidence snapshots, with 64% of top-20 companies adopting Veeva Vault RIM by 2025.

By Deployment Model:
Hybrid Architectures Balance Compliance and AgilityOn-premise systems accounted for 55.87% in 2026, as risk-averse manufacturers retain validated workloads behind facility firewalls to comply with 21 CFR Part 11 and Annex 11 rules. Nonetheless, cloud instances represent the fastest-growing segment of the pharmaceutical management software market, advancing at a 12.63% CAGR to 2032, as multi-tenant SaaS accelerates upgrades and eases audit preparation. Firms are widely opting for hybrid topologies in which manufacturing and quality cores remain on-premises or in sovereign cloud zones. At the same time, analytics, collaboration, and supplier portals reside in hyperscale public clouds.
GDPR and China’s data-localization statutes force regional data centers, adding up to 20% in infrastructure overhead and further complicating multi-cloud deployments. SAP’s 2025 release of S/4HANA Life Sciences sovereign clouds in Germany, France, and the United Arab Emirates reflects vendor recognition that localization is non-negotiable for regulated records. Persistent SaaS price inflation of 8-12% per year pressures buyers to compare subscription models with perpetual licensing in total-cost analyses, which can occasionally slow migrations among mid-cap firms.
By End User:
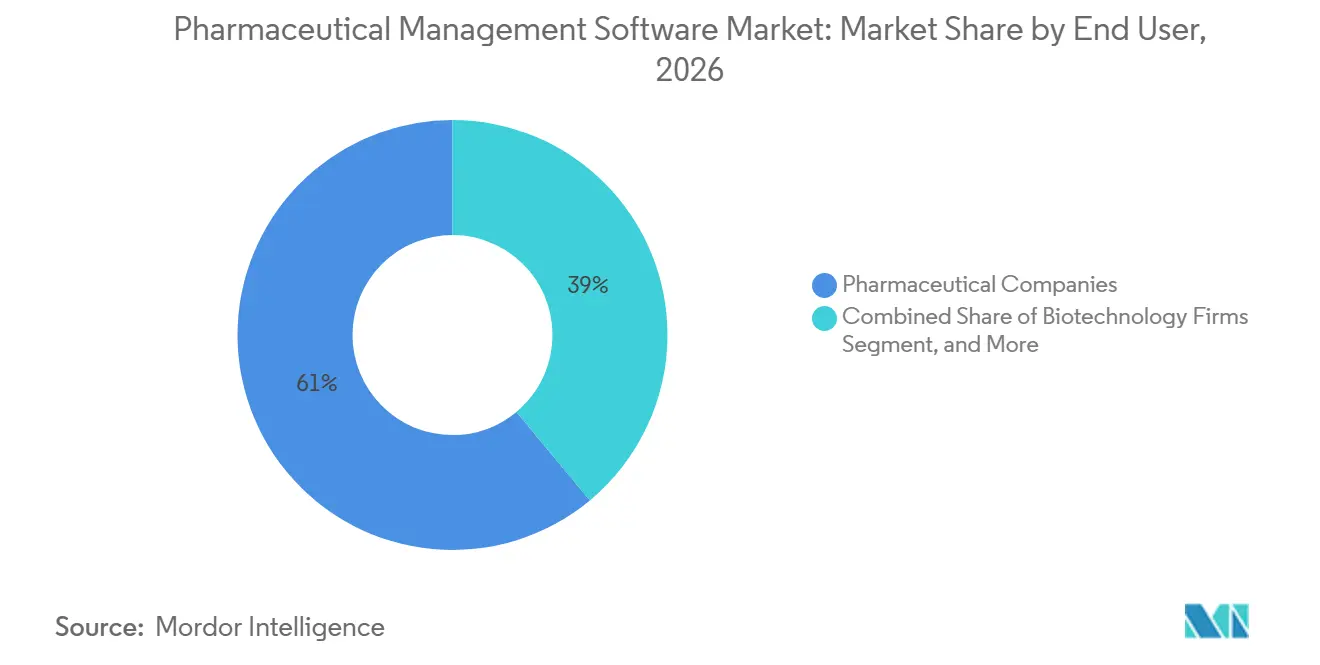
Biotechnology Firms Accelerate Digital AdoptionPharmaceutical companies accounted for 61.03% of 2026 revenue. Yet, biotechnology firms are forecast to exhibit a 12.18% CAGR, outpacing all other segments, because cell and gene therapies require highly configurable workflows that legacy MES systems cannot support. CDMOs and CMOs are scaling software investments to shorten batch release times and differentiate capacity offerings, as illustrated by Lonza’s USD 580 million Visp expansion, which uses Siemens Opcenter to orchestrate parallel autologous runs.
CROs deepen investments in trial-management stacks as decentralized studies displace site-based models. Hospitals and clinics remain an emerging buyer group but show rising interest in pharmacy automation tools that integrate with electronic health records systems, especially for personalized therapies requiring bedside chain-of-identity validation. Together, these evolving buyer patterns are expanding the addressable market for pharmaceutical management software.
Geography Analysis
North America Pharmaceutical Management Software Market
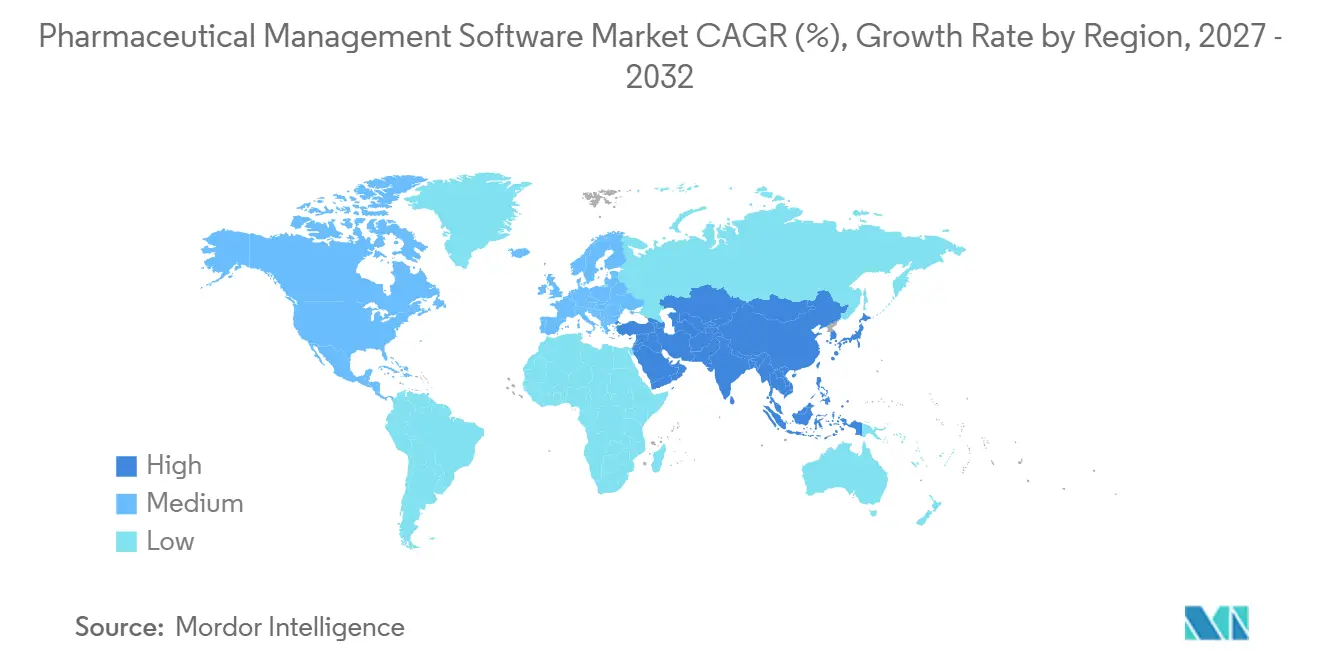
North America retained a 41.18% share in 2026, propelled by robust biologics pipelines, strict Part 11 enforcement, and the early adoption of SaaS quality suites that shorten validation cycles. The United States hosts most of the world’s commercial-scale cell and gene therapy plants, fueling demand for real-time equipment integration and cold-chain genealogy tracking. Canada’s CDMO sector is growing due to near-shoring trends, though expertise shortages are extending validation timelines. Mexico benefits from proximity to US markets but lags in adopting advanced software, primarily due to smaller plant sizes and limited capital budgets. High-profile breaches, such as the Change Healthcare incident, are driving adoption of ISO 27001 and the NIST Framework across the region.
Europe Pharmaceutical Management Software Market
Europe is revalidating legacy platforms because the Annex 11 draft issued in 2025 elevates data integrity and supplier audit thresholds. Germany, France, and the United Kingdom lead MES-ERP convergence pilots tied to Industry 4.0 programs, while GDPR and the AI Act compel sovereign-cloud configurations that increase deployment spend by 15-20% relative to public-cloud-only architecture. Mid-sized manufacturers face implementation costs of USD 1.5-10 million for validated roll-outs, prompting outsourcing to CDMOs with turnkey systems.
APAC, South America and Middle East Pharmaceutical Management Software Market
Asia-Pacific is growing at 14.71% CAGR through 2032, underpinned by China’s enforcement of data-integrity controls that obligate local hosting and real-time regulator access. India’s CDMO sector invested USD 2.1 billion in capacity in 2024, adopting MES platforms to secure export approval. Japan advances electronic batch record adoption, though cultural preference for on-premises solutions tempers SaaS adoption. South Korea and Australia expand biologics capacity, using advanced MES suites for real-time process orchestration. Meanwhile, the pharmaceutical management software market gains momentum across the Middle East and South America as governments seek drug-supply self-sufficiency, though smaller plant footprints and skills gaps moderate growth trajectories.
Regulatory Landscape
Global regulatory requirements for GxP computerized systems continue to influence procurement and validation priorities for pharmaceutical management software, with 21 CFR Part 11 in the United States and GMP Annex 11 expectations across EU-aligned environments shaping audit-trail, role-based access, and e-signature requirements. The FDA Computer Software Assurance (CSA) framework supports a risk-based approach to validation for production and quality system software, while data-integrity norms (for example, ALCOA+ principles referenced in WHO GMP guidance) raise expectations around electronic records, change control, and traceable exception handling.
In Europe, the ongoing EU pharmaceutical legislation reform advanced through political agreement in December 2025, and 2026 brought operational updates such as the revised variations framework effective 15 January 2026 and planned implementation updates tied to EudraVigilance signal-detection rules in Q2 2026. Canada maintains a GMP Annex 11-style guide for computerized systems, and Brazil ANVISA keeps computerized-system expectations through its GMP rulemaking, reinforcing the need for globally deployable, inspection-ready configurations. In the United States, 2026 legislative proposals focused on drug origin transparency and FDA policy proposals around unique facility identification point toward tighter supply chain and manufacturing provenance data requirements, which increases the value of interoperable master data, genealogy, and reporting features in regulated platforms.
Competitive Landscape
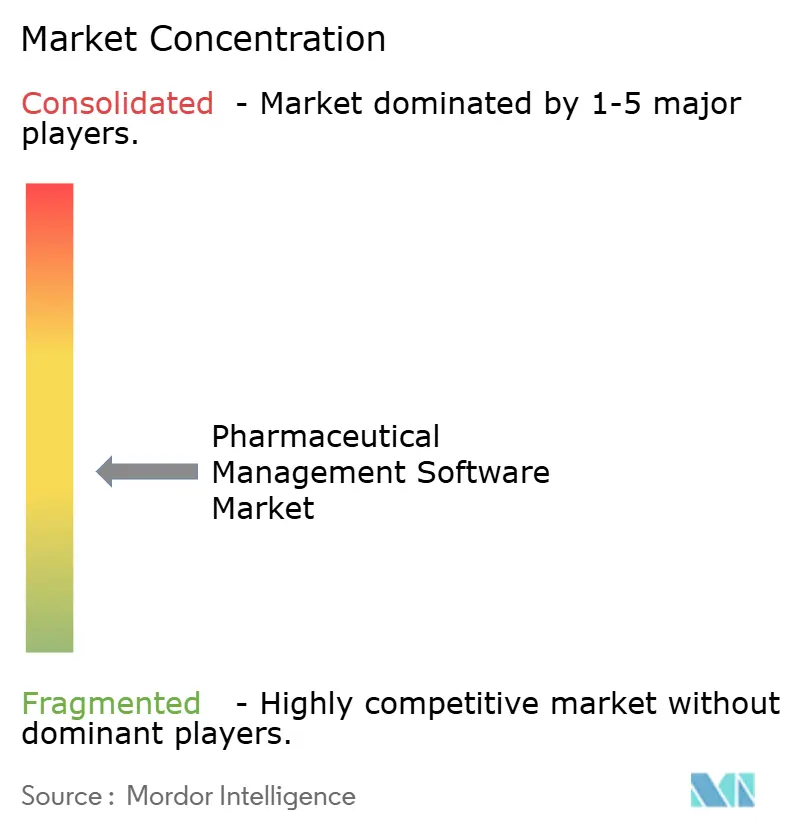
The market remains moderately fragmented, but consolidation is on the rise as buyers favor integrated platforms that converge MES, QMS, and regulatory data. Enterprise resource planning incumbents SAP, Oracle, and Microsoft are extending life sciences clouds with sovereign options and AI analytics to retain market share. Vertical specialists such as Veeva Systems, MasterControl, Siemens, and Dassault Systèmes continue to gain traction by bundling validated content, rapid-deployment templates, and industry-specific data models. Veeva disclosed that 78% of new QMS clients selected SaaS in 2025 for automatic upgrades, but two-thirds opted for private Vault Manufacturing instances to comply with residency requirements.
Siemens and Dassault Systèmes dominate in biologics manufacturing through recipe-driven MES capable of sub-100-unit lots, while Rockwell Automation and Emerson integrate plant-level automation with enterprise IT for multi-site CDMOs. Vendors differentiate on cybersecurity, offering ISO 27001 certification, zero-trust architectures, and post-event penetration testing following incidents such as the Change Healthcare breach. Low-code disruptors target mid-tier buyers with rapid workflow configuration that reduces validation overheads, but large pharma stays cautious due to patent and data-integrity risks.
White-space innovations include AI-assisted deviation management, blockchain serialization for emerging markets, and predictive maintenance that correlates equipment health with batch quality metrics.
Pharmaceutical Management Software Industry Leaders
-
AssurX, Inc.
-
AXSource
-
EtQ Management Consultants, Inc.
-
Dassault Systèmes SE
-
IQVIA Inc.
- *Disclaimer: Major Players sorted in no particular order
Pharmaceutical Management Software Market Companies Covered in this Report
- AssurX
- AXSource
- BatchMaster Software
- Dassault Systèmes SE
- EtQ Management Consultants
- Emerson Electric
- Epicor Software Corp.
- Honeywell International
- Infor
- IQVIA
- Körber AG (Werum IT)
- MasterControl Inc.
- Microsoft
- Oracle
- Rockwell Automation Inc.
- Sage Group plc
- SAP
- Schneider Electric SE
- Siemens Healthineers
- Veeva Systems
- Yokogawa Electric Corp.
Read Analysis of Pharmaceutical Management Software Companies
Market Opportunities and Future Outlook
An actionable opportunity is compliance-grade, interoperable traceability and partner master-data infrastructure as DSCSA requirements move the supply chain toward package-level electronic traceability and authorized trading-partner data exchanges, while similar track-and-trace frameworks persist globally (for example EU FMD and national programs such as UAE Tatmeen). Platform vendors positioning around multi-enterprise networks and interoperability, including TraceLink (OPUS) and authorized trading partner master-data hubs such as Spherity CARO (v1.3 released in February 2026), target buyers that need faster partner onboarding, exception management, and evidence-ready reporting without rebuilding integrations for each counterparty.
Another whitespace is workflow automation across regulated functions using agentic AI, as life sciences buyers increasingly fund enterprise-scale modernization programs rather than isolated pilots. Merck (MSD) announced a multi-year USD 1 billion partnership with Google Cloud in April 2026 to deploy agentic AI across R&D, manufacturing, and commercial workstreams, and Veeva introduced its Falcon agentic platform for clinical, regulatory, and safety processes in May 2026, followed by the June 2026 acquisition of Copli and the launch of Falcon MLR for medical, legal, and regulatory content review automation. These developments expand demand for validated guardrails around e-signatures, audit trails, controlled vocabularies, and role-based controls in AI-assisted workflows, creating room for vendors that package compliant automation with secure hybrid deployment options to meet data-sovereignty and cybersecurity constraints.
Recent Industry Developments in Pharmaceutical Management Software Market
- April 2026: AXSource supported an SAP S/4HANA go-live as a client-side project management engagement, with the deployment going live on April 1, 2026. The activity highlights continued demand for validated ERP modernization and integration services that connect regulated quality and manufacturing processes to enterprise platforms.
- January 2025: Veeva and Zifo announced a partnership to accelerate quality control modernization by linking laboratory informatics with enterprise quality dashboards. The collaboration aims to speed up connectivity between QC data and quality workflows, supporting electronic evidence capture and more standardized inspection readiness across sites.
- August 2024: Valsoft acquired Anju Software to expand its footprint in regulatory and quality management software. The deal supported broader suite bundling across compliance-centric workflows, reinforcing consolidation dynamics as buyers pursue fewer vendors and more integrated platforms.
Pharmaceutical Management Software Market Report Scope and Research Methodology
Market Definition and Coverage
This market covers software platforms and modules used to plan, run, and control pharmaceutical operations. It includes quality workflows, manufacturing execution support, supply and inventory planning, and commercial or customer processes, delivered through on-premise, cloud, or hybrid deployments.
Scope exclusions: Hardware, pure IT services, and general purpose enterprise software that is not configured and sold for pharmaceutical-specific workflows were excluded.
Segments Covered in This Report
- By Solution Type
- Enterprise Resource Planning (ERP)
- Manufacturing Execution Systems (MES)
- Quality / Compliance Management (QMS & eBR)
- Supply-Chain / Inventory Management
- Customer / Commercial (CRM, PBM)
- Knowledge & Data Management
- By Deployment Model
- On-Premise
- Cloud-Based
- Hybrid
- By End User
- Pharmaceutical Companies
- Biotechnology Firms
- CDMOs / CMOs
- CROs
- Hospitals & Clinics
- By Geography
- North America
- United States
- Canada
- Mexico
- Europe
- Germany
- United Kingdom
- France
- Italy
- Spain
- Rest of Europe
- Asia-Pacific
- China
- Japan
- India
- Australia
- South Korea
- Rest of Asia-Pacific
- Middle East & Africa
- GCC
- South Africa
- Rest of Middle East & Africa
- South America
- Brazil
- Argentina
- Rest of South America
- North America
Data Sources, Market Sizing, and Validation
Desk Research
Desk work started with public signals that describe pharma software demand and how operating models are changing. We referenced sources such as the US FDA for quality and compliance context, the European Commission and EMA for regulatory direction, and OECD and World Bank datasets for macro indicators that influence technology spend.
We also used materials such as annual reports and investor presentations from relevant software providers and pharmaceutical manufacturers, plus reputable press coverage and association publications that describe adoption patterns like cloud validation, data integrity, and audit readiness. Where needed, we cross-checked company level revenue splits and product notes using paid databases focused on company financials and news. Patent databases were used to track how automation and analytics features are evolving in this software category. The sources listed above are illustrative, and other public references were also used for collection, cross-checks, and clarification.
Primary Interviews and Surveys
Primary work was used to confirm what buyers actually count as pharmaceutical management software and how pricing is being structured across subscriptions, modules, and implementation waves. We spoke with a mix of software product leaders, pharma and biotech digital owners, quality and manufacturing heads, and channel or implementation partners across APAC, EMEA, and the Americas to test adoption drivers. We also used these conversations to normalize assumptions where public sources did not provide enough detail on buyer rollout logic.
Distribution of primary research fieldwork respondents
| Company type | Respondent position | Region |
|---|---|---|
| Top tier: 32% | CXOs: 19% | APAC: 45% |
| Mid tier: 49% | Functional/Unit leaders: 22% | EMEA: 30% |
| Smaller Players: 19% | Managers: 59% | Americas: 25% |
Market-Sizing & Forecasting
Sizing was built using a top-down and bottom-up approach. The top-down path starts from the addressable pharma software spend pool, then applies adoption and module mix factors to reconstruct demand for pharma-specific management software. To keep totals realistic, we corroborated outputs using selective bottom-up checks, such as sampled vendor revenue ranges, typical subscription pricing by module, and the approximate count of active enterprise deployments by region.
A few practical inputs were used in the model because they change the market in measurable ways. These included the pace of cloud migration in regulated environments, shifts in validation and audit workload, expansion of CDMOs and multi-site manufacturing footprints, and the shift toward data integrity and electronic documentation practices. We also tracked pricing signals such as user-based versus site-based licensing, the share of recurring subscription revenue versus one-time implementation, and contract renewal timing. These signals helped avoid overstating growth when deals are delayed.
For forecasting, scenario analysis was used with a central case anchored on expected compliance pressure and digitization budgets, then adjusted using interview feedback on buying cycles and deployment timelines. When bottom-up evidence was thin for smaller countries or niche end users, gaps were handled with regional adoption proxies and then scaled by the estimated number of regulated sites, followed by a reasonableness check against known spending patterns.
Data Validation & Update Cycle
Validation is done through a sequence of checks so major assumptions do not slip into the final numbers unnoticed. We compare the model against independent signals such as enterprise software spending direction in pharma, observed cloud uptake, and buyer-reported rollout timelines. Any variance that looks out of line with these signals is investigated.
Anomalies are reviewed by a second analyst, and follow-up calls are triggered when a pricing, deployment, or renewal assumption materially changes the market total. Reports are refreshed annually, and interim updates are made when material events affect adoption or pricing. Before delivery, the dataset and calculations are rechecked so the latest updated view is provided.
Mordor Intelligence's Pharmaceutical Management Software Market Estimate Compared With Other Published Estimates
Published market sizes for pharmaceutical management software can vary widely even when they appear to cover similar tools. In practice, gaps usually come from how each publisher treats software scope, how recurring revenue is recognized, and which year and currency timing is used for conversion.
Refresh cadence and pricing logic tend to be the biggest drivers in this space. Subscription renewals, module expansions, and implementation timing do not land evenly across years, and currency conversion can change totals when revenues are global. By aligning the current-year cut with updated average selling price progressions and rechecking outlier growth rates against interview feedback before locking the model, Mordor Intelligence reduces year-shift and currency-timing noise that can inflate or compress published totals.
Benchmark comparison
| Source | Market Size | Gaps in Research Methodology |
|---|---|---|
| Mordor Intelligence | USD 3.67 B (2026) | |
| Industry Publisher A | USD 5.46 B (2024) | Uses a broader definition that blends pharma management software with adjacent healthcare and enterprise software use cases, and the base year sits earlier in the cycle where renewal timing can lift the measured run-rate. |
| Market Tracker B | USD 4.33 B (2025) | Focuses tightly on inventory management software, which changes what is counted and can shift averages, and it typically applies simpler pricing progression that may not separate implementation revenue from recurring subscriptions. |
The spread across the three figures is mainly explained by scope boundaries and timing choices rather than a single right or wrong number. When software categories are separated carefully and the year cut is aligned to subscription recognition and currency timing, the resulting market size is easier to trace back to repeatable inputs and practical buyer behavior checks.
Key Questions Answered in the Report
What CAGR is forecast for spending on platforms that manage pharmaceutical quality, manufacturing, and regulatory data?
The pharmaceutical management software market is projected to grow at an 11.67% CAGR from 2027 to 2032.
Which solution type currently holds the largest revenue?
Manufacturing Execution Systems led with 36.12% share in 2026.
Why are hybrid deployments gaining traction?
Hybrid models allow companies to keep validated batch records on-premise for compliance while running analytics in sovereign clouds, balancing agility with residency mandates.
Which region is expanding the fastest?
Asia-Pacific is forecast to grow at a 14.71% CAGR through 2032, driven by China’s and India’s manufacturing investments.
How do electronic batch records impact deviation investigations?
EBR implementations have reduced average deviation-resolution time from 28 days to 11 days by automating root-cause workflows.