
Pharmaceutical Intermediates Market Size and Share
Market Overview
| Study Period | 2022 - 2031 |
|---|---|
| Market Size (2026) | USD 48.65 Billion |
| Market Size (2031) | USD 68.37 Billion |
| Growth Rate (2026 - 2031) | 7.05 % |
| Fastest Growing Market | Asia Pacific |
| Largest Market | North America |
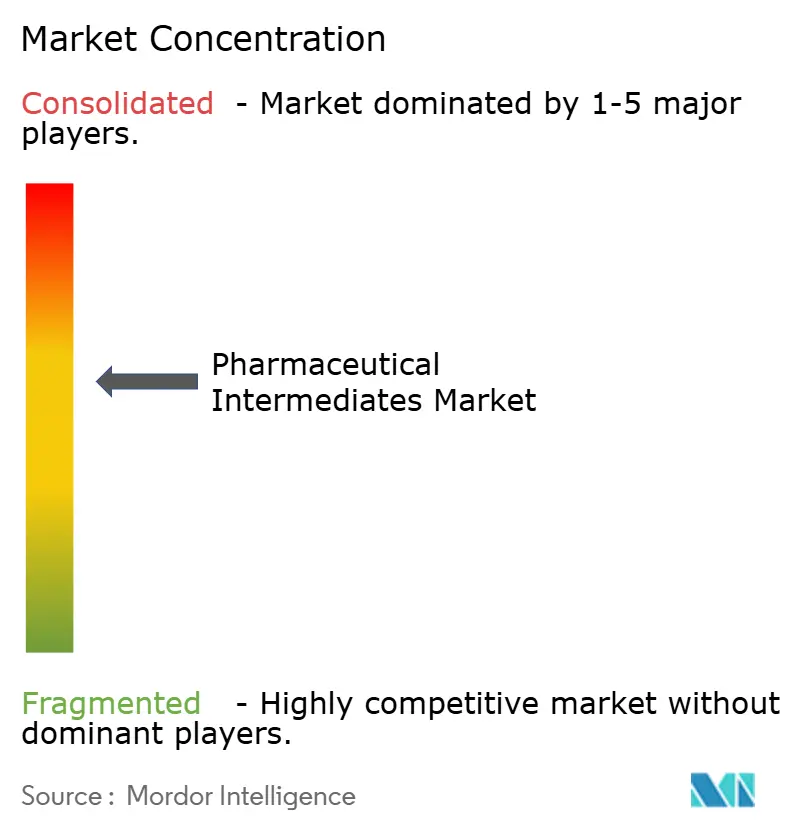
| Market Concentration | Medium |
Major Players *Disclaimer: Major Players sorted in no particular order Image © Mordor Intelligence. Reuse requires attribution under CC BY 4.0. | |
Pharmaceutical Intermediates Market Analysis by Mordor Intelligence
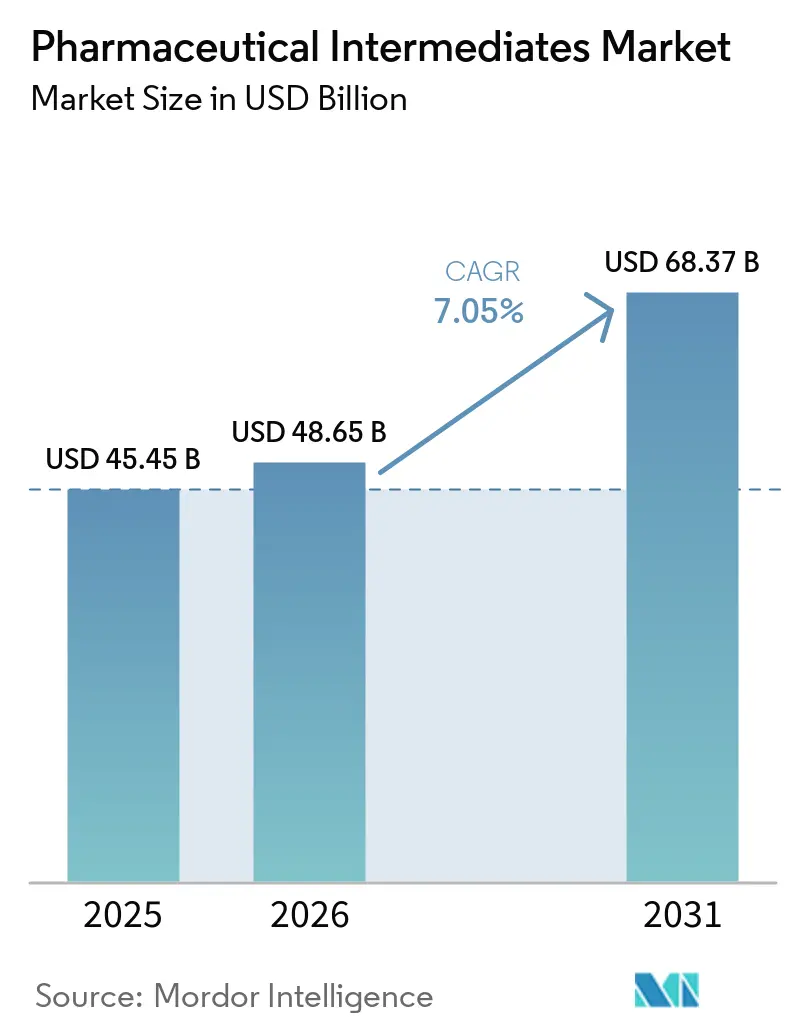
The pharmaceutical intermediates market size was valued at USD 45.45 billion in 2025 and estimated to grow from USD 48.65 billion in 2026 to reach USD 68.37 billion by 2031, at a CAGR of 7.05% during the forecast period (2026-2031). Demand is fueled by drug sponsors’ growing preference for contract development and manufacturing organizations (CDMOs), the resurgence of continuous-flow chemistry, and government incentives aimed at reshoring critical ingredients. Intensifying biologics pipelines, especially for oncology and peptide drugs, are elevating requirements for high-potency, chiral, and oligonucleotide intermediates. At the same time, disruptive technologies such as AI-enabled route scouting are compressing development timelines, while regulatory programs like the U.S. FDA’s Advanced Manufacturing Technologies initiative reward early adopters with faster approvals. Together, these forces reinforce the pivotal role of the pharmaceutical intermediates market in an ecosystem where speed, flexibility, and quality have become the defining competitive parameters.
Key Report Takeaways
- By product type, bulk drug intermediates commanded 48.10% of the pharmaceutical intermediates market share in 2025, while peptide & oligonucleotide intermediates are projected to post the fastest 7.85% CAGR through 2031.
- By therapeutic application, oncology led with a 37.20% revenue share in 2025; the same segment is forecast to maintain the highest 7.35% CAGR during 2026-2031.
- By synthesis process, traditional batch chemistry accounted for 69.05% of the pharmaceutical intermediates market size in 2025, whereas continuous-flow chemistry is set to expand at an 7.76% CAGR over the forecast horizon.
- By end user, generic drug manufacturers held 53.10% of the pharmaceutical intermediates market share in 2025, but innovative pharma companies are expected to register the quickest 7.62% CAGR to 2031.
- By geography, North America represented 41.80% of global value in 2025, while Asia-Pacific is projected to log the fastest 8.02% CAGR over the next five years.
Note: Market size and forecast figures in this report are generated using Mordor Intelligence’s proprietary estimation framework, updated with the latest available data and insights as of 2026.
Global Pharmaceutical Intermediates Market Trends and Insights
Drivers Impact Analysis*
| Driver | (~) % Impact on CAGR Forecast | Geographic Relevance | Impact Timeline |
|---|---|---|---|
| Accelerating shift toward outsourced manufacturing | +1.8% | Global, with Asia-Pacific leading growth | Medium term (2-4 years) |
| Rising demand for small-molecule oncology APIs | +1.2% | North America & Europe, expanding to Asia | Long term (≥ 4 years) |
| Re-shoring incentives in the United States & Europe | +0.9% | North America & Europe | Medium term (2-4 years) |
| Growing investments in continuous-flow chemistry | +0.7% | Global, concentrated in developed markets | Long term (≥ 4 years) |
| Expansion of nucleotide & oligonucleotide drug pipelines | +0.6% | Global, with North America leading | Long term (≥ 4 years) |
| AI-enabled route scouting and synthesis optimization | +0.5% | Global, early adoption in developed markets | Short term (≤ 2 years) |
| Source: Mordor Intelligence | |||
Accelerating Shift Toward Outsourced Manufacturing
Contract services have become the production backbone for new chemical entities as drug originators prioritize capital-light models that de-risk supply chains. Full-service CDMOs now advertise 25% cost reductions and 50% timeline compression compared with in-house development. Post-pandemic boardrooms are also localizing critical intermediates; 81% of executives surveyed in 2025 planned to relocate at least one manufacturing step to a CDMO in the same economic bloc. Regulatory endorsements, notably the FDA Advanced Manufacturing Technologies Designation Program, further tilt the calculus in favor of outsourcing because certified sites gain quicker pre-approval inspection slots and shorter review cycles.
Rising Demand for Small-Molecule Oncology APIs
Twenty-five novel oncology active substances launched globally in 2024, lifting the five-year debut count to 132 and triggering a surge in specialized intermediate orders. The productivity of oncology pipelines has improved 51% since 2019, yet the underlying chemistry has grown more complex, often requiring multi-step high-potency handling and customized chiral catalysts. North American innovator companies dominate precision medicine trials, but Chinese CDMOs have gained share in second-generation tyrosine kinase inhibitors, complicating global sourcing patterns and magnifying the need for dual geography supply strategies.
Re-shoring Incentives in the United States & Europe
U.S. manufacturers committed USD 160 billion to domestic pharmaceutical facilities in 2025, buoyed by tax credits, the FDA PreCheck pilot, and federal grants for essential-medicine APIs. Parallel packages in France and Austria provide subsidies for local API complexes using continuous production lines. As a result, intermediates output in these regions is forecast to expand faster than finished dosage-form growth, tightening local feedstock markets and encouraging vertical integration moves such as Novo Holdings’ USD 16.5 billion Catalent deal.
Growing Investments in Continuous-Flow Chemistry
Continuous-flow reactors shrink facility footprints by up to 70% and cut variable costs 40-50%, enabling viable Western-world economics for segments once dominated by Asian tollers. Early adopters have reported FDA approval timelines shorter than traditional batch filings, while ICH Q13 provides a harmonized pathway for global validation. Large pharma is retrofitting legacy lines, whereas greenfield plants in India, Singapore, and Ireland are designed as flow-first, positioning the technology for rapid share gains.
Restraints Impact Analysis*
| Restraint | (~) % Impact on CAGR Forecast | Geographic Relevance | Impact Timeline |
|---|---|---|---|
| Volatile prices of key raw materials (solvents, reagents) | -0.8% | Global, particularly affecting Asia-Pacific | Short term (≤ 2 years) |
| Stringent environmental-impact compliance costs | -0.6% | Europe & North America, expanding globally | Medium term (2-4 years) |
| Geopolitical export controls on dual-use precursors | -0.4% | US-China trade corridors, expanding globally | Medium term (2-4 years) |
| CDMO capacity bottlenecks for highly-potent intermediates | -0.3% | Global, acute in North America & Europe | Short term (≤ 2 years) |
| Source: Mordor Intelligence | |||
Volatile prices of key raw materials (solvents, reagents)
Volatile prices of key raw materials, including solvents and reagents, restrain the pharmaceutical intermediates market by increasing production costs and creating uncertainty in procurement budgets. Fluctuations in the prices of petrochemical derivatives, specialty chemicals, and other essential inputs can reduce manufacturers' profit margins and limit their ability to offer competitively priced pharmaceutical intermediates.
Stringent environmental-impact compliance costs
High costs associated with compliance with stringent environmental regulations restrain the pharmaceutical intermediates market. Manufacturers must invest in emission-control systems, wastewater treatment facilities, hazardous waste management, and cleaner production technologies to meet environmental standards, which increases operating costs and may particularly affect smaller manufacturers.
*Our forecasts treat driver/restraint impacts as directional, not additive. The impact forecasts reflect baseline growth, mix effects, and variable interactions.
Segment Analysis
By Product Type: Complex Intermediates Drive Innovation
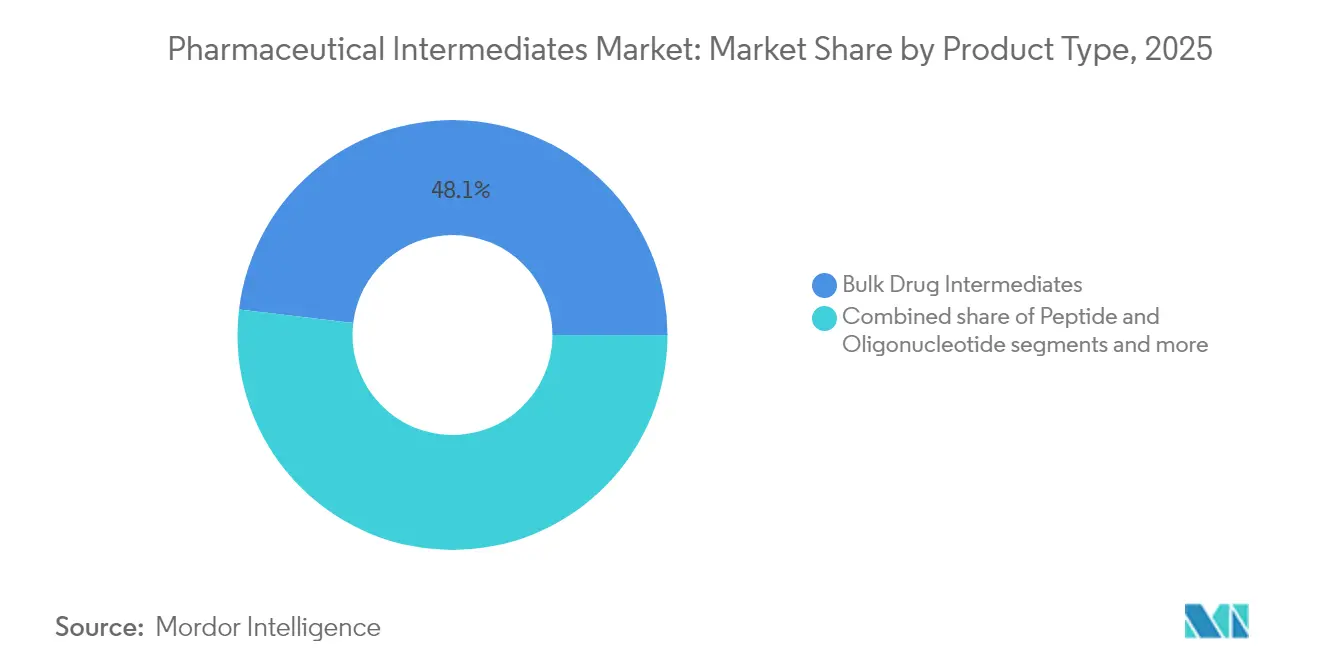
Bulk drug intermediates retained leadership with 48.10% of pharmaceutical intermediates market share in 2025, anchored by high-volume small-molecule generics and mature therapies. Peptide & oligonucleotide intermediates, though smaller in absolute value, are forecast to outpace at an 7.85% CAGR as biologic-like chemical entities gain clinical momentum. Custom & contract intermediates continue to flourish because innovators prefer turnkey synthesis that meets accelerated filing timelines.
The pharmaceutical intermediates market size for chiral & high-potency intermediates is expanding steadily on the back of oncology pipelines that demand precise stereochemistry and specialized containment. CDMOs able to combine flow chemistry with advanced hazardous-material management are winning multi-year master service agreements, indicating a structural shift toward premium, low-volume, high-margin subsegments.

By Therapeutic Application: Oncology Leads Growth Trajectory
Oncology generated 37.20% of revenue in 2025 and is projected to maintain a 7.35% CAGR, reinforcing its status as the chief value driver within the pharmaceutical intermediates market. Immuno-oncology combinations and antibody-drug conjugates necessitate intricate linker chemistry, elevating demand for ultrapure intermediates. Cardiovascular agents, though moderating after several patent expiries, continue to require sizable base intermediates given the chronic-care prevalence.
Central nervous system candidates are re-emerging as AI-discovered molecules enter trials, a trend likely to accelerate specialized amide and heterocycle intermediate consumption. Infectious disease programs remain strategically important as governments stockpile antivirals and vaccines, sustaining medium-volume demand. Metabolic disorders, especially obesity, stimulate peptide intermediate orders tied to GLP-1 agonists.
By Synthesis Process: Traditional Methods Face Digital Disruption
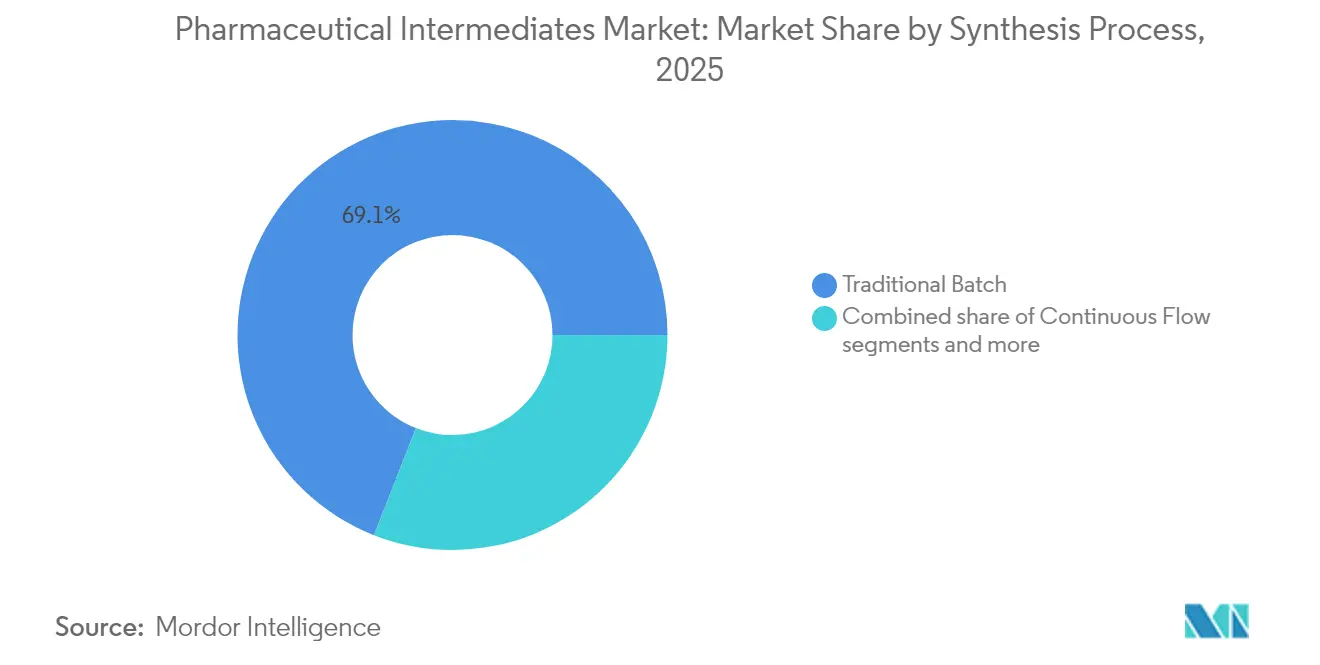
Conventional batch chemistry still accounts for 69.05% of pharmaceutical intermediates market size owing to entrenched validation files and depreciated assets. Yet continuous-flow chemistry is charting an 7.76% CAGR, supported by demonstrable gains in yield, safety, and regulatory receptiveness. Early adopters report double-digit margin expansion and shorter tech-transfer cycles to secondary sites.
Biocatalytic and enzymatic routes, although niche, are gaining credibility as enzyme-engineering costs decline and sustainability metrics climb regulatory agendas. Large-volume amino-acid derivatives and select chiral epoxides are already transitioning to enzymatic production, hinting that the segment’s share could rise disproportionately once scale economics equilibrate.
By End User: Innovation Companies Accelerate Growth
Generic drug manufacturers held 53.10% of pharmaceutical intermediates market share in 2025, reflecting the still-dominant role of multisource molecules in global healthcare. However, innovative pharma companies are projected to clock a 7.62% CAGR as patent-protected assets intensify. These firms increasingly award multi-compound, multi-year supply contracts that bundle development services with guaranteed commercial volumes.
Contract research & manufacturing organizations (CROs/CDMOs) serve as the supply chain’s connective tissue, absorbing capacity pressure from both generic and innovator clients. Market leaders have begun to forward-integrate into finished-dose manufacturing, a strategy that secures share of wallet and mitigates volatility in early-phase project pipelines.
Geography Analysis
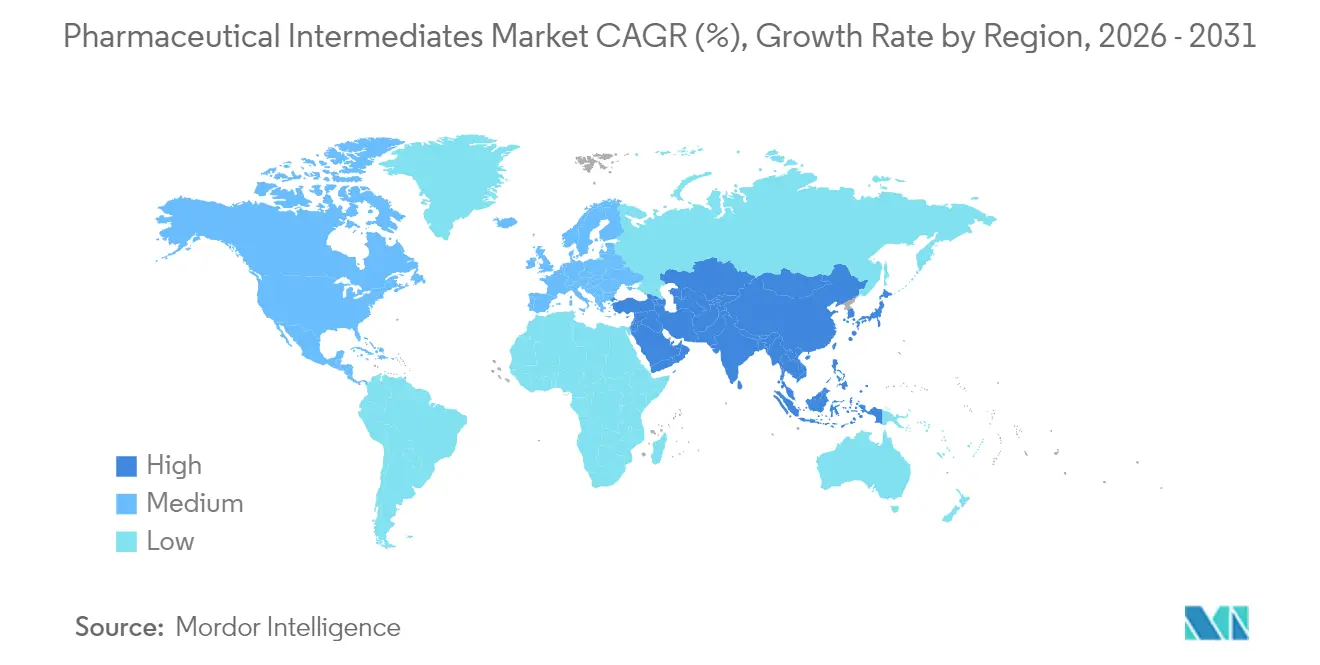
North America generated 41.80% of 2025 revenue, buoyed by USD 160 billion in announced manufacturing investments and a policy environment that rewards domestic sourcing. The FDA PreCheck program and draft shortage-mitigation plans are already shortening inspection queues, encouraging both incumbents and new entrants to qualify U.S. sites. Canada complements the regional ecosystem with regulatory modernization aimed at averting ingredient shortages, thereby cementing cross-border supply resilience.
Asia-Pacific is forecast to post the fastest 8.02% CAGR between 2026 and 2031. India’s CRDMO community is scaling high-potency and antibody-drug conjugate services, while China sustains leadership in commodity APIs despite emerging compliance costs linked to revised environmental statutes. Bilateral frameworks such as the India-U.S. TRUST Initiative underscore the strategic imperative of diversified sourcing away from single-country concentration. Southeast Asian nations are also courting investment with free-trade zones and expedited clearance for greenfield facilities.
Europe remains a critical pillar, emphasizing sustainability and advanced therapy readiness. Synthetic APIs account for 77% of the region’s output, yet policy makers are subsidizing relocation of select intermediates as part of supply-security drives. Continuous-manufacturing retrofits across Ireland, Belgium, and Germany signal a technological leap that could close cost gaps with low-cost jurisdictions. Moreover, updated EU GMP Annexes and the European Medicines Agency’s three-year work plan reinforce consistent quality expectations, raising the entry bar for new suppliers.
Regulatory Landscape
Regulatory oversight for pharmaceutical intermediates continues to converge with active-substance expectations where intermediates are critical to API quality. ICH Q7 remains a foundational GMP reference applied by regulators for APIs and their critical intermediates. In Europe, the European Medicines Agency (EMA) published a revised Guideline on the Chemistry of Active Substances in March 2026, with the update taking effect on 1 September 2026. The change reinforces control strategies for cohorts of concern such as N-nitrosamines and tightens expectations around impurity risk management and documentation.
In the United States, FDA activity has shifted emphasis toward establishment visibility and modern manufacturing models. A proposed rule issued in July 2026 to amend drug establishment registration sought to accommodate distributed manufacturing registration approaches, while also requiring mandatory registration for foreign establishments manufacturing APIs entering the U.S. supply chain. This raises the compliance bar for cross-border sourcing and increases the importance of transparent site and supply-chain data for intermediate-to-API pathways.
Value Chain Analysis
The value chain spans upstream petrochemical and bio-based feedstocks, solvents, reagents, catalysts, and key starting materials (KSMs), through intermediate synthesis (often multi-step, with batch and growing continuous-flow configurations), purification, analytical testing, and downstream transfer into API production and finished-dose manufacturing. CDMOs and specialty chemical producers increasingly sit at the center of this chain, performing route scouting, scale-up, and GMP manufacture for custom, chiral, and high-potency intermediates. Distributors support multi-region reach and SKU fragmentation, particularly for fine chemicals and selected pharmaceutical intermediates.
Supply concentration at the KSM layer remains a primary bottleneck and risk amplifier. U.S. Pharmacopeia analysis highlighted that 58% of KSMs for approved U.S. APIs are sole-sourced from a single country, including 41% from China and 16% from India. The same analysis also noted that 50% of U.S.-approved APIs depend on a single country for at least one KSM. This concentration interacts with regionalization efforts and capacity upgrades, including Thermo Fisher’s March 2026 announcement of a USD 420 million expansion in Greenville, North Carolina, aimed at strengthening domestic supply-chain resilience. It also aligns with policy shifts that force supplier re-qualification and re-optimization of routes when trade or compliance conditions change.
Competitive Landscape
Mega-mergers are reshaping bargaining power. Novo Holdings’ USD 16.5 billion Catalent purchase secures critical biologics capacity, while Roquette’s USD 1.5 billion acquisition of IFF Pharma Solutions enlarges its formulation footprint. Agilent’s USD 925 million BIOVECTRA buyout extends its presence in highly-potent APIs. Collectively, these deals illustrate an arms race for differentiated capabilities in an environment where CDMO slots for high-potency intermediates can be booked out years in advance.
Technology leadership is emerging as a key differentiator. Lonza’s collaboration with IBM on AI-driven retrosynthesis models aims to cut process-development cycles, whereas Thermo Fisher uses machine-learning vision systems to slash false rejection rates on inspection lines. Competitors with proven continuous-flow credentials are winning high-profile transfer projects, especially from sponsors eager to meet ESG metrics. Conversely, smaller regional players without digital or flow expertise risk commoditization and margin compression.
Environmental compliance costs and dual-use export controls create additional barriers to entry, subtly favoring incumbents with diversified site networks. Players capable of offering dual-hemisphere production options along with redundant raw-material sources are viewed as lower-risk partners by multinationals executing de-risking strategies. Niche specialists in peptide, oligonucleotide, and linker chemistry remain acquisition targets as broader platforms seek to deepen modality coverage.
Pharmaceutical Intermediates Industry Leaders
-
Chiracon GmbH
-
BASF SE
-
Sanofi SAIS
-
Aceto
-
Codexis, Inc.
- *Disclaimer: Major Players sorted in no particular order
Market Opportunities and Future Outlook
White space is forming where buyers need qualified, multi-geography sources for critical and high-complexity intermediates, particularly where upstream KSM concentration drives audit and dual-sourcing mandates. Documented chokepoints, including U.S. Pharmacopeia findings on single-country KSM sourcing (with large shares linked to China and India) and NITI Aayog reporting that India remains 65% dependent on China for critical inputs (APIs, KSMs, and intermediates), are pushing sponsors and manufacturers to invest in alternate routes, redundant suppliers, and regionally aligned supply chains.
The investment pipeline also points to demand for specialized intermediate capabilities and modernization of chemical infrastructure. In July 2026, Evonik announced a USD 100 million, five-year program to modernize its Tippecanoe Labs site in Lafayette, Indiana, adding reactor upgrades and automation to expand drug substance and CDMO capacity. Pharmaron disclosed a RMB 3 billion investment (May 2026) for a Shaoxing facility focused on intermediates and APIs. At the modality edge, Lonza communicated plans (July 2026) to expand payload-linker manufacturing capacity at Visp, supporting higher-value intermediate classes linked to HPAPI and ADC supply chains. Together, these moves underline an opportunity set around complex intermediates, compliant documentation packages, and technology-enabled manufacturing upgrades that reduce transfer friction across regions.
Recent Industry Developments
- July 2026: Evonik announced a USD 100 million, five-year investment to modernize its Tippecanoe Labs site in Lafayette, Indiana, including reactor upgrades and automation to expand drug substance CDMO capacity. The company’s plan strengthens North American supply options for intermediates-to-API pathways and aligns with customer demand for regionally aligned sourcing and faster tech transfers.
- February 2025: Ardena acquired Catalent’s Somerset, New Jersey facility and outlined plans to add a new bioanalytical lab by late 2025. The acquisition expands Ardena’s service footprint around development and analytical support that can shorten cycle times for intermediate and API programs moving from early phase to clinical supply.
- October 2024: National Resilience secured USD 17.5 million in U.S. federal funding to scale domestic production of essential-medicine intermediates. The funding highlighted public-sector willingness to support critical-ingredient capacity and supported efforts to reduce single-region dependence for key chemical inputs.
Research Methodology Framework and Report Scope
Market Definition and Coverage
For this report, the market covers the sales value of pharmaceutical intermediates used as input materials in making APIs and drug substances across key producing and consuming countries. The scope follows intermediates that are generated and consumed through multi-step chemical synthesis routes before the final drug substance stage.
Scope exclusions: finished dosage forms, packaging materials, and final APIs are excluded from this market sizing.
Segmentation Overview
- By Product Type
- Bulk Drug Intermediates
- Custom & Contract Intermediates
- Peptide & Oligonucleotide Intermediates
- Chiral & High-Potency Intermediates
- By Therapeutic Application
- Oncology
- Cardiovascular
- Infectious Diseases
- Central Nervous System
- Metabolic & Others
- By Synthesis Process
- Traditional Batch Chemistry
- Continuous-Flow Chemistry
- Biocatalytic & Enzymatic Routes
- By End User
- Generic Drug Manufacturers
- Innovative Pharma Companies
- Contract Research & Manufacturing Organizations (CROs/CDMOs)
- By Geography
- North America
- United States
- Canada
- Mexico
- Europe
- Germany
- United Kingdom
- France
- Italy
- Spain
- Rest of Europe
- Asia-Pacific
- China
- India
- Japan
- South Korea
- Australia
- Rest of Asia-Pacific
- South America
- Brazil
- Argentina
- Rest of South America
- Middle East and Africa
- GCC
- South Africa
- Rest of Middle East and Africa
- North America
Data Sources, Market Sizing, and Validation
Desk Research
Desk research started with defining what counts as an intermediate in pharma chemistry, and then mapping the demand pool that supports repeat purchases. We used public sources such as the US FDA (drug approvals and facility information), the European Medicines Agency, UN Comtrade trade statistics, and World Bank macro indicators to frame production and cross-border movement trends.
To keep the sizing grounded, we also reviewed sources such as OECD industry statistics, WIPO patent publications, company annual reports, and investor presentations to understand capacity additions and product mix shifts. Where available, paid subscriptions for company financials and intelligence, patent databases, and shipment level import and export data were used to verify ownership structures and directional volume movement in key routes. These desk research sources are illustrative, and we reviewed many other public references to collect, validate, and clarify data points.
Primary Interviews and Surveys
Primary work focused on interviews and structured surveys with manufacturers, distributors, procurement teams at pharma companies, and process chemistry experts, so that pricing logic and utilization assumptions could be checked against how intermediates are actually sourced and consumed. Since this is a global market, inputs were validated across APAC, EMEA, and the Americas, with extra attention on regions that function as export hubs for intermediates. Where desk data looked inconsistent, respondents were recontacted to confirm whether the gap came from captive consumption, mix shifts, or temporary shutdowns.
Distribution of primary research fieldwork respondents
| Company type | Respondent position | Region |
|---|---|---|
| Top tier: 29% | CXOs: 14% | APAC: 49% |
| Mid tier: 53% | Functional/Unit leaders: 35% | EMEA: 31% |
| Smaller Players: 18% | Managers: 51% | Americas: 20% |
Market-Sizing & Forecasting
The core sizing was built using a top-down approach, where production and trade signals were reconstructed into an addressable demand pool for pharmaceutical intermediates, and then converted to value using typical price bands. To keep the totals realistic, we cross-checked results with selective bottom-up approximations, such as sampled volume by intermediate families multiplied by observed average selling prices, followed by distributor channel checks.
Key model inputs included API manufacturing output trends, intermediate intensity in multi-step synthesis routes, capacity utilization ranges at chemical plants, import dependence for key building blocks, and observed price movement linked to feedstock and energy costs. When bottom-up data was missing for smaller routes, we filled gaps using proxy ratios from similar chemistries and then tested the outcome against trade flows and interview feedback.
For forecasting, scenario analysis was used so demand could be flexed based on generic drug expansion, outsourcing to CMOs, and tighter compliance costs that can change sourcing patterns. The forward view was then adjusted using expert consensus on which regions are likely to add capacity and which ones are expected to remain import heavy.
Data Validation & Update Cycle
Validation was done through multiple checks so the outputs stayed consistent with external market signals. We compared the implied volumes and values against independent indicators such as pharma manufacturing growth, trade directionality, and capacity additions, and then investigated outliers before the model was signed off.
If a large variance appeared between what the model suggested and what interviews implied, the assumptions were revisited and targeted follow-ups were triggered. Reports are refreshed annually, and interim updates are made when material events occur, such as major plant disruptions, regulatory actions, or sharp feedstock price changes. Before delivery, an analyst completes a fresh pass on key variables so clients receive the latest updated view.
Mordor Intelligence's Pharmaceutical Intermediates Market Size Compared Against Other Published Estimates
Published market sizes for pharmaceutical intermediates can differ because each publisher draws the line around a slightly different set of chemicals and selling points in the value chain. Differences also come from the year used as the stated current estimate, currency conversion timing, and how captive consumption inside integrated plants is treated.
Finished APIs are kept outside Mordor Intelligence's scope for this market, which can pull the total away from estimates that bundle late stage API value with intermediate chemistry. Another recurring gap is whether figures lean on aggressive pricing uplift assumptions, or instead use trade and utilization checks to keep ASP growth closer to what buyers report in contracts and spot buys. Update cadence matters too, since short term disruptions in China and India can move volumes and prices quickly for certain intermediates.
Benchmark comparison
| Source | Market Size | Gaps in Research Methodology |
|---|---|---|
| Mordor Intelligence | USD 48.65 B (2026) | |
| Trade Journal A | USD 33.59 B (2024) | Uses an earlier base year and may apply a narrower intermediate definition, and it may not fully normalize for captive intermediate use that does not show up cleanly in trade linked views. |
| Industry Publisher B | USD 36.62 B (2025) | Likely reflects a more conservative pricing path and a different cut of product scope, which can understate value when mix shifts toward higher complexity intermediates in regulated supply chains. |
Across the sources, the spread is mostly explained by what is counted as an intermediate versus an API adjacent item, and by whether older year pricing is carried forward without enough adjustment. With clear scope rules, observable demand signals, and repeatable checks, the estimate stays easier to trace back to real production and purchasing behavior.
Key Questions Answered in the Report
How big is the Pharmaceutical Intermediates Market?
The Pharmaceutical Intermediates Market size is expected to reach USD 48.65 billion in 2026 and grow at a CAGR of 7.05% to reach USD 68.37 billion by 2031.
What is the current Pharmaceutical Intermediates Market size?
In 2026, the Pharmaceutical Intermediates Market size is expected to reach USD 48.65 billion.
Who are the key players in Pharmaceutical Intermediates Market?
Chiracon GmbH, BASF SE, Sanofi SAIS, Aceto and Codexis, Inc. are the major companies operating in the Pharmaceutical Intermediates Market.
Which is the fastest growing region in Pharmaceutical Intermediates Market?
Asia Pacific is estimated to grow at the highest CAGR over the forecast period (2026-2031).
Which region has the biggest share in Pharmaceutical Intermediates Market?
In 2025, the North America accounts for the largest market share in Pharmaceutical Intermediates Market.