Market Overview
| Study Period | 2017 - 2030 |
|---|---|
| Base Year For Estimation | 2024 |
| Forecast Data Period | 2025 - 2030 |
| Market Size (2025) | USD 57.33 Billion |
| Market Size (2030) | USD 75.39 Billion |
| Growth Rate (2025 - 2030) | 5.63% CAGR |
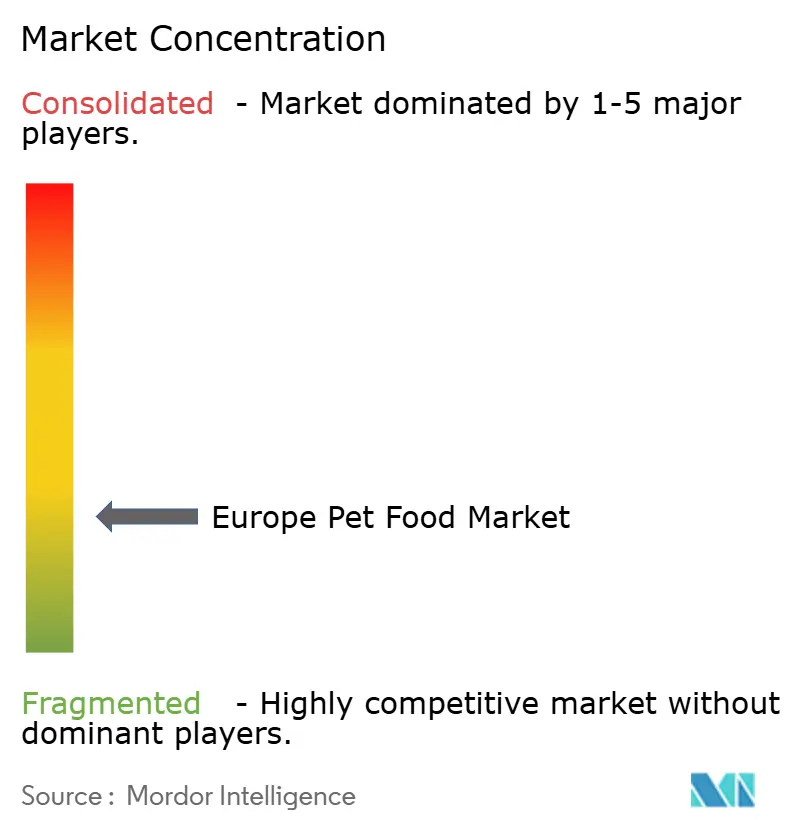
| Market Concentration | Low |
Major Players
*Disclaimer: Major Players sorted in no particular order Image © Mordor Intelligence. Reuse requires attribution under CC BY 4.0. |
|

Europe Pet Food Market Analysis by Mordor Intelligence
The Europe pet food market size stands at USD 57.33 billion in 2025 and is projected to reach USD 75.39 billion by 2030, expanding at a 5.63% CAGR through 2030. Momentum is powered by premiumization, pet humanization, and demographic shifts toward single-person households that devote steady discretionary budgets to companion-animal nutrition. Functional ingredients, such as probiotics, omega fatty acids, and joint-support complexes, are now appearing in mainstream SKUs (Stock Keeping Units), underpinning a value mix that favors higher price points. Online and direct-to-consumer channels are scaling quickly as European shoppers adopt subscription models that deliver personalized diets. Top manufacturers are investing in alternative proteins to align with the European Green Deal and future-proof raw-material supply chains.
Key Report Takeaways
- By pet food product, food commanded 67.2% market share in 2024, whereas pet nutraceuticals/supplements are forecast to grow at 8.2% CAGR through 2030.
- By pets, dogs captured 42.5% of the 2024 market share, and are projected to advance at a 6.6% CAGR to 2030.
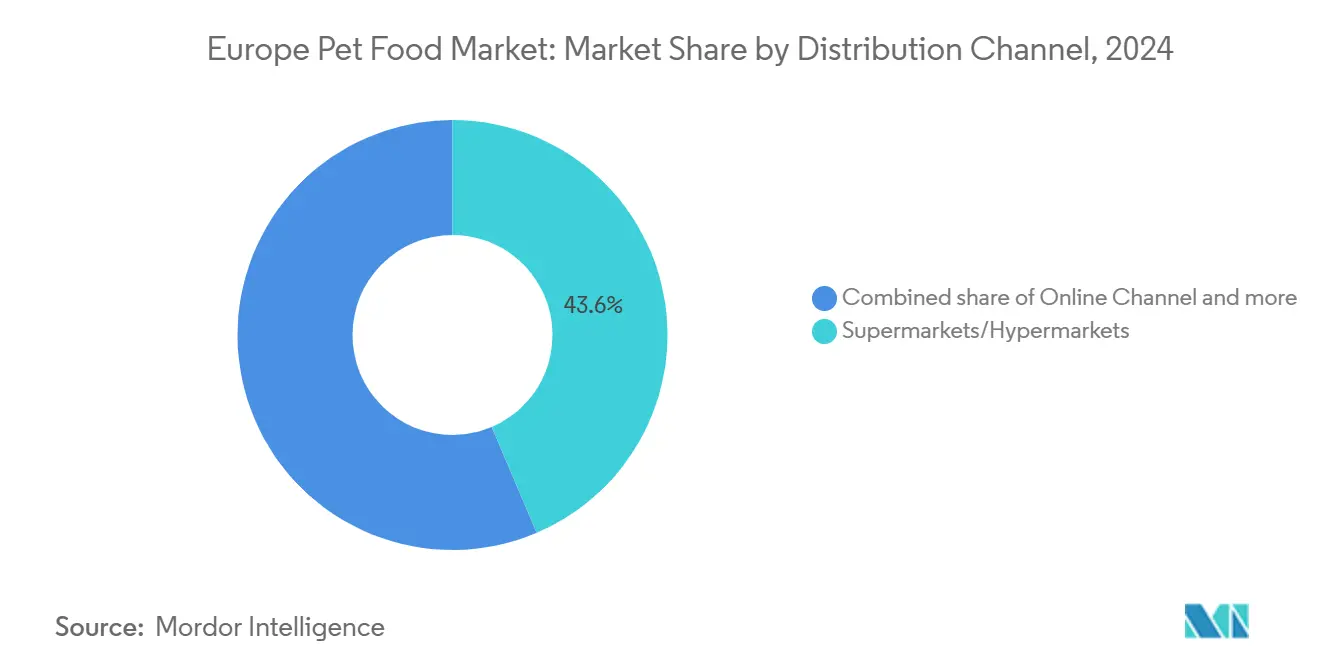
- By distribution channel, Supermarkets/Hypermarkets held a 43.6% market share in 2024, while online outlets are likely to accelerate at a 7.1% CAGR through 2030.
- By geography, the United Kingdom led with 21.2% market share in 2024, while Spain is likely to post the fastest growth at a 6.4% CAGR during the outlook period.
Europe Pet Food Market Trends and Insights
Drivers Impact Analysis
| Driver | (~) % Impact on CAGR Forecast | Geographic Relevance | Impact Timeline |
|---|---|---|---|
| Premiumization and pet humanization | +1.8% | Western Europe's core and expanding to Eastern markets | Medium term (2-4 years) |
| Rising pet ownership and single-person households | +1.5% | Pan-European with the strongest impact in Germany, France,and Nordics | Long term (≥ 4 years) |
| Rapid growth of e-commerce and DTC (Direct-to-Consumer) subscriptions | +1.2% | Urban centers across all major European markets | Short term (≤ 2 years) |
| Private-label consolidation expanding price-competitive capacity | +0.9% | Germany, the Netherlands,and United Kingdom are leading the adoption | Medium term (2-4 years) |
| European Union Green Deal pressure spurring alternative-protein innovation | +0.7% | European Union-27, with pilot programs in the Netherlands and Denmark | Long term (≥ 4 years) |
| Veterinary-service inflation pushing owners toward preventive nutrition | +0.6% | Western Europe, primarily, is emerging in Eastern markets | Medium term (2-4 years) |
| Source: Mordor Intelligence | |||
Understand The Key Trends Shaping This Market
Download PDF
Premiumization and Pet Humanization
European pet owners are increasingly viewing animals as family members, fundamentally reshaping their purchasing decisions toward premium, science-backed nutrition products. This humanization trend has accelerated post-pandemic, as remote work arrangements have deepened human-animal bonds. In 2024, 73% of European pet owners consider their pets' nutritional needs to be equivalent to those of their human family members. The shift is evident in the growing demand for organic, grain-free, and veterinary-recommended formulations, with premium products commanding price premiums of 40-60% over conventional alternatives. The trend's sustainability is reinforced by European consumers' willingness to reduce personal spending without compromising the quality of pet nutrition.
Rising Pet Ownership and Single-Person Households
Europe's demographic shift toward single-person households, which accounted for 41.4% of all households in 2024, compared to 32.8% in 2010, creates sustained demand for companion animals and their associated nutritional products [1]Source: Eurostat, “Single-Person Households in Europe – Statistics Explained,” ec.europa.eu. This demographic shift is particularly pronounced in urban centers, where aging populations and delayed family formation lead to pet adoption as a means of emotional companionship. Single-person households typically allocate higher per-capita spending to pet care, with an average annual expenditure on pet food that is 35% higher than in multi-person households, due to fewer competing financial priorities. The trend is reinforced by European housing policies that increasingly accommodate pet ownership in rental properties, thereby removing traditional barriers to pet adoption.
Rapid Growth of E-commerce and Direct-to-Consumer Subscriptions
Online pet food sales are expanding at a 7.1% CAGR through 2030, significantly outpacing traditional retail channels as convenience and personalization drive consumer migration to digital platforms. Subscription-based direct-to-consumer models have gained particular traction, with companies like Tails.com and Pets at Home reporting 40-50% annual subscriber growth throughout 2024. These platforms utilize data analytics to create personalized nutrition profiles tailored to pet age, breed, activity level, and health conditions, offering premium pricing through customized value propositions. The shift is accelerated by European consumers' growing comfort with recurring delivery models, particularly among urban millennials and Gen Z pet owners who prioritize convenience and curated products.
Private-Label Consolidation Expanding Price-Competitive Capacity
European retailers and contract manufacturers are consolidating their private-label production capabilities, creating economies of scale that enable deeper market penetration through competitive pricing strategies. Major retailers, including Fressnapf, Maxi Zoo, and national supermarket chains, have expanded private-label offerings to capture 25-30% of their pet food sales, up from 15-20% in 2020. This consolidation enables retailers to offer premium-quality products at 20-30% discounts to branded equivalents while maintaining healthy margins through vertical integration. Contract manufacturers like United Petfood and Deuerer have invested heavily in production capacity and quality certifications to serve multiple retail partners simultaneously, spreading fixed costs across larger volumes.
Restraints Impact Analysis
| Restraint | (~) % Impact on CAGR Forecast | Geographic Relevance | Impact Timeline |
|---|---|---|---|
| Raw-material price volatility for meat and grains | -1.4% | Pan-European with acute impact in processing-intensive markets | Short term (≤ 2 years) |
| Stringent European Union additive and labeling regulations | -0.8% | European Union -27 with spillover effects to the United Kingdom and Switzerland | Medium term (2-4 years) |
| Diversion of Category-3 animal fats to biofuels, tightening supply | -0.6% | Germany, the Netherlands, and France are leading biofuel adoption | Long term (≥ 4 years) |
| Escalating veterinary costs squeezing discretionary pet-food spend | -0.5% | Western Europe primarily, with emerging pressure in Eastern markets | Medium term (2-4 years) |
| Source: Mordor Intelligence | |||
Raw Material Price Volatility for Meat and Grains
Commodity price fluctuations for meat meals, grains, and specialized ingredients have intensified since 2024, with wheat prices experiencing 25-30% volatility and meat meal costs surging 35-40% due to African swine fever outbreaks and climate-related supply disruptions [2]Source: European Feed Manufacturers’ Federation, “Feed Raw-Material Prices 2024,” fefac.eu. These input cost pressures particularly impact mid-tier manufacturers lacking vertical integration or commodity hedging capabilities, forcing difficult decisions between margin compression and retail price increases that risk consumer defection. Premium brands with strong consumer loyalty demonstrate greater pricing power, while private-label producers benefit from retailer support in managing cost volatility. The challenge is compounded by European consumers' price sensitivity during economic uncertainty, limiting manufacturers' ability to pass through full cost increases.
Stringent European Union Additive and Labeling Regulations
European Union regulations governing pet food additives, novel ingredients, and labeling claims impose substantial compliance burdens that disproportionately impact smaller manufacturers and new product development timelines. The European Food Safety Authority's rigorous approval processes for functional ingredients can extend 18-24 months, which is significantly longer than the regulatory timelines in other major markets[3]Source: European Food Safety Authority, “Feed Additive Applications,” efsa.europa.eu . These regulatory requirements create barriers for innovative ingredients, including probiotics, novel proteins, and health-claim substantiation, which may slow market evolution toward functional nutrition products. The regulatory framework's complexity also creates uncertainty around novel ingredients, such as insect proteins and synthetic biology-derived components, despite policy support for sustainability innovation.
Segment Analysis
By Pet Food Product: Nutraceuticals Drive Innovation Wave
Food dominates the market with a 67.2% market share in 2024, reflecting European preferences for comprehensive nutrition solutions over supplemental treats and accessories. This substantial market share is primarily driven by the essential nature of pet food products in meeting daily nutritional requirements. Within this segment, dry pet foods emerge as the preferred choice among pet owners due to their convenience, long shelf life, nutritional balance, and cost-effectiveness compared to wet pet food market products. The segment's growth is further supported by the increasing shift from homemade meals to commercial pet food products, particularly in urban areas where convenience and nutritional optimization are prioritized.
Pet nutraceuticals/supplements represent the fastest-growing product segment, with an 8.2% CAGR through 2030, driven by increasing pet health awareness and veterinary recommendations for preventive nutrition strategies. The segment's expansion is particularly notable in premium markets where pet owners are increasingly investing in supplements containing vitamins, minerals, omega-3 fatty acids, and probiotics to enhance their pets' overall health and well-being. The growth is further supported by veterinarians' recommendations and the rising adoption of holistic approaches to pet care, especially in countries like the United Kingdom, Germany, and France, where pet health awareness is particularly high.

Note: Segment shares of all individual segments available upon report purchase
Get Detailed Market Forecasts at the Most Granular Levels
Download PDF
By Pets: Canine Dominance with Sustained Growth
Dogs account for 42.5% of pet-specific market share in 2024, while experiencing continued growth at a 6.6% CAGR through 2030, reflecting Europe's cultural preference for canine companionship and larger average household sizes that accommodate larger pets. The segment's prominence is further strengthened by the increasing trend of pet humanization and the rising adoption of commercial pet food products. Dog owners in Europe are increasingly focusing on premium and specialized food products, including veterinary diets and treats, particularly for training purposes.
Increasing adoption rates drive the dog segment's sustained growth among younger demographics and single-person households, where dogs provide emotional companionship and security benefits. Large-breed nutrition represents a particularly dynamic subcategory, as European urbanization trends favor apartment-friendly breeds that require specialized nutritional support for joint health and weight management.
By Distribution Channel: Supermarkets Lead with Online Acceleration
Supermarkets/hypermarkets are anticipated to maintain a 43.6% market share in 2024, leveraging convenience, competitive pricing, and extensive geographic coverage to continue dominating European pet food retail. This channel's prominence is driven by its ability to offer a convenient one-stop shopping experience where customers can purchase both household products and pet food simultaneously. Major retail chains, including Tesco, Carrefour, Auchan, Sainsbury's, Lidl, and Aldi, have established strong networks across Europe, offering customers extensive pet product portfolios at competitive prices. The segment's success is further bolstered by the availability of premium brands, regular promotional offers, and loyalty programs that attract price-conscious consumers while maintaining quality standards.
Online channels are experiencing the fastest growth at 7.1% CAGR through 2030, fundamentally reshaping retail dynamics as convenience and personalization drive consumer migration to digital platforms. The online channel's expansion reflects European consumers' increasing comfort with recurring delivery models and data-driven product recommendations. Traditional retailers are responding through omnichannel strategies that combine physical touchpoints with digital convenience, though pure-play online retailers maintain advantages in personalization capabilities and subscription model optimization.
Note: Segment shares of all individual segments available upon report purchase
Get Detailed Market Forecasts at the Most Granular Levels
Download PDF
Geography Analysis
The United Kingdom leads the market share at 21.2% in 2024, leveraging high pet ownership rates, premium product adoption, and a strong retail infrastructure, despite Brexit-related trade complexities that have increased import costs and regulatory compliance burdens. British pet owners demonstrate strong brand loyalty and willingness to pay premiums for perceived quality, supporting market values that exceed volume growth rates. The country's regulatory environment maintains alignment with European Union (EU) standards while developing independent frameworks that support innovation in alternative proteins and functional ingredients.
Spain demonstrates the fastest growth trajectory, at 6.4% CAGR through 2030, driven by aging demographics, an increase in single-person households, and cultural shifts toward pet humanization that mirror Western European trends. The Spanish market benefits from improving retail infrastructure, expanding veterinary services, and regulatory alignment with broader European Union frameworks that support cross-border trade and product standardization.
Germany and France maintain significant market positions through strong domestic brands and established veterinary channel partnerships, while Eastern European markets, including Poland and Turkey, present emerging opportunities for established brands seeking growth beyond saturated Western European segments. Recent sustainability initiatives have accelerated the adoption of alternative protein sources, with insect-based pet foods gaining regulatory approval and consumer acceptance ahead of other European markets.
Competitive Landscape
The European pet food market exhibits fragmentation, with the top players creating competitive dynamics that balance scale advantages with innovation opportunities for smaller specialists. Global conglomerates like Mars, Incorporated, Nestle (Purina), Colgate-Palmolive Company (Hill's Pet Nutrition, Inc.), Affinity Petcare S.A., and ADM dominate the market through their established brands and extensive distribution networks. These companies leverage their substantial research and development capabilities, manufacturing infrastructure, and marketing resources to maintain their market positions.
The market has witnessed considerable merger and acquisition activity as companies seek to expand their product portfolios and geographical presence. Large companies are particularly interested in acquiring smaller, innovative brands that have established themselves in specific market niches or regional markets. These acquisitions help major players quickly enter new market segments, particularly in premium and specialized pet food categories.
The European pet food market is characterized by intense competition and continuous innovation among major players. Companies are heavily focused on product development, particularly in premium and specialized pet food segments, including grain-free options and therapeutic diets. Operational agility has become crucial, with European pet food manufacturers expanding their production capacities and modernizing facilities to meet growing demand. Strategic moves in the market primarily revolve around strengthening distribution networks through partnerships with retailers and veterinary clinics, while also developing direct-to-consumer channels.
Europe Pet Food Industry Leaders
-
Mars, Incorporated
-
Nestle (Purina)
-
Colgate-Palmolive Company (Hill's Pet Nutrition, Inc.)
-
Affinity Petcare S.A
-
Archer Daniels Midland (ADM)
- *Disclaimer: Major Players sorted in no particular order
Need More Details on Market Players and Competitors?
Download PDF
Recent Industry Developments
- September 2025: Mars Petcare announced a EUR 200 million (USD 210 million) investment in its Verden, Germany, manufacturing facility to expand production capacity for Royal Canin veterinary diets by 40%, responding to growing demand for therapeutic nutrition products across European markets.
- May 2023: Nestle Purina launched new cat treats under the Friskies "Friskies Playfuls - treats" brand. These treats are round in shape and are available in chicken and liver and salmon and shrimp flavors for adult cats.
- May 2023: Virbac acquired its distributor (GS Partners) in the Czech Republic and Slovakia, which became Virbac's 35th subsidiary. This new subsidiary allows Virbac to expand its presence more in these countries.
Europe Pet Food Market Report Scope
Food, Pet Nutraceuticals/Supplements, Pet Treats, Pet Veterinary Diets are covered as segments by Pet Food Product. Cats, Dogs are covered as segments by Pets. Convenience Stores, Online Channel, Specialty Stores, Supermarkets/Hypermarkets are covered as segments by Distribution Channel. France, Germany, Italy, Netherlands, Poland, Russia, Spain, United Kingdom are covered as segments by Country.
Pet Food Product
| Food | By Sub Product | Dry Pet Food | By Sub Dry Pet Food | Kibbles |
| Other Dry Pet Food | ||||
| Wet Pet Food | ||||
| Pet Nutraceuticals/Supplements | By Sub Product | Milk Bioactives | ||
| Omega-3 Fatty Acids | ||||
| Probiotics | ||||
| Proteins and Peptides | ||||
| Vitamins and Minerals | ||||
| Other Nutraceuticals | ||||
| Pet Treats | By Sub Product | Crunchy Treats | ||
| Dental Treats | ||||
| Freeze-dried and Jerky Treats | ||||
| Soft and Chewy Treats | ||||
| Other Treats | ||||
| Pet Veterinary Diets | By Sub Product | Diabetes | ||
| Digestive Sensitivity | ||||
| Oral Care Diets | ||||
| Renal | ||||
| Urinary tract disease | ||||
| Obesity Diets | ||||
| Derma Diets | ||||
| Other Veterinary Diets |
Pets
| Cats |
| Dogs |
| Other Pets |
Distribution Channel
| Convenience Stores |
| Online Channel |
| Specialty Stores |
| Supermarkets/Hypermarkets |
| Other Channels |
Geography
| Germany |
| France |
| Spain |
| Italy |
| United Kingdom |
| Poland |
| Russia |
| Netherlands |
| Rest of Europe |
| Pet Food Product | Food | By Sub Product | Dry Pet Food | By Sub Dry Pet Food | Kibbles |
| Other Dry Pet Food | |||||
| Wet Pet Food | |||||
| Pet Nutraceuticals/Supplements | By Sub Product | Milk Bioactives | |||
| Omega-3 Fatty Acids | |||||
| Probiotics | |||||
| Proteins and Peptides | |||||
| Vitamins and Minerals | |||||
| Other Nutraceuticals | |||||
| Pet Treats | By Sub Product | Crunchy Treats | |||
| Dental Treats | |||||
| Freeze-dried and Jerky Treats | |||||
| Soft and Chewy Treats | |||||
| Other Treats | |||||
| Pet Veterinary Diets | By Sub Product | Diabetes | |||
| Digestive Sensitivity | |||||
| Oral Care Diets | |||||
| Renal | |||||
| Urinary tract disease | |||||
| Obesity Diets | |||||
| Derma Diets | |||||
| Other Veterinary Diets | |||||
| Pets | Cats | ||||
| Dogs | |||||
| Other Pets | |||||
| Distribution Channel | Convenience Stores | ||||
| Online Channel | |||||
| Specialty Stores | |||||
| Supermarkets/Hypermarkets | |||||
| Other Channels | |||||
| Geography | Germany | ||||
| France | |||||
| Spain | |||||
| Italy | |||||
| United Kingdom | |||||
| Poland | |||||
| Russia | |||||
| Netherlands | |||||
| Rest of Europe | |||||
Need A Different Region or Segment?
Customize Now
Market Definition
- FUNCTIONS - Pet foods are usually intended to provide complete and balanced nutrition to the pet but are primarily used as functional products. The scope includes the food and supplements consumed by pets including veterinary diets. Supplements/nutraceuticals that are directly supplied to pets are considered within the scope.
- RESELLERS - Companies engaged in reselling of pet food without value addition have been excluded from the market scope, in order to avoid double counting.
- END CONSUMERS - Pet owners are considered to be the end-consumers in the market studied.
- DISTRIBUTION CHANNELS - Supermarkets/hypermarkets, specialty stores, convenience stores, online channels and other channels are considered within the scope. The stores which are exclusively providing pet related basic and custom products are considered within the scope of specialty stores.
| Keyword | Definition |
|---|---|
| Pet Food | The scope of pet food includes the food that is eatable by pets including food, treats, veterinary diets, and nutraceuticals/supplements. |
| Food | Food is animal feed intended for consumption by pets. It is formulated to provide essential nutrients and meet the dietary needs of various types of pets, including dogs, cats, and other animals. These are generally segmented into dry and wet pet foods. |
| Dry Pet Food | Dry pet foods may be extruded/baked (kibbles) or flaked. They have a lower moisture content, typically around 12-20%. |
| Wet Pet Food | Wet pet food, also known as canned pet food or moist pet food, generally has a higher moisture content compared to dry pet food, often ranging from 70-80%. |
| Kibbles | Kibbles are dry, processed pet food in small, bite-sized pieces or pellets. They are specifically formulated to provide balanced nutrition for various domestic animals, such as dogs, cats, and other animals. |
| Treats | Pet Treats are special food items or rewards given to pets, to show affection, and encourage good behavior. They are especially used during training. Pet treats are made from various combinations of meat or meat-derived materials with other ingredients. |
| Dental Treats | Pet dental treats are specialized treats that are formulated to promote good oral hygiene in pets. |
| Crunchy Treats | It is a type of pet treat that has a firm and crispy texture which can be a good source of nutrition for pets. |
| Soft and chewy treats | Soft and Chewy pet treats are a type of pet food product that is formulated to be easy to chewy and digest. They are usually made from soft and pliable ingredients, such as meat, poultry, or vegetables, that have been blended and formed into bite-sized pieces or strips. |
| Freeze-dried & Jerky Treats | Freeze-dried and jerky treats are snacks given to pets, that are prepared through a special preservation process, without damaging the nutritional content, resulting in long-lasting, nutrient-rich treats. |
| Urinary Tract Disease Diets | These are commercial diets that are specifically formulated to promote urinary health and reduce the risk of urinary tract infections and other urinary problems. |
| Renal Diets | These are specialized pet foods formulated to support the health of pets with kidney disease or renal insufficiency. |
| Digestive Sensitivity Diets | Digestive-sensitive diets are specially formulated to meet the nutritional needs of pets with digestive issues such as food intolerances, allergies, and sensitivities. These diets are designed to be easily digestible and to reduce the symptoms of digestive problems in pets. |
| Oral Care Diets | Oral care diets for pets are specially formulated diets produced to promote oral health and hygiene in pets. |
| Grain-Free Pet Food | Pet food that does not contain common grains like wheat, corn, or soy. Grain-free diets are often preferred by pet owners seeking alternative options or if their pets have specific dietary sensitivities. |
| Premium Pet Food | High-quality pet food formulated with superior ingredients often offers additional nutritional benefits compared to standard pet food. |
| Natural Pet Food | Pet food made from natural ingredients, with minimal processing and without artificial preservatives. |
| Organic Pet Food | Pet food is produced using organic ingredients, free from synthetic pesticides, hormones, and genetically modified organisms (GMOs). |
| Extrusion | A manufacturing process used to produce dry pet food, where ingredients are cooked, mixed, and shaped under high pressure and temperature. |
| Other Pets | Other pets include birds, fish, rabbits, hamsters, ferrets, and reptiles. |
| Palatability | The taste, texture, and aroma of pet food influence its appeal and acceptance by pets. |
| Complete and Balanced Pet Food | Pet food that provides all essential nutrients in appropriate proportions to meet the nutritional needs of pets without additional supplementation. |
| Preservatives | These are the substances that are added to pet food to extend its shelf life and prevent spoilage. |
| Nutraceuticals | Food products that offer health benefits beyond basic nutrition, often contain bioactive compounds with potential therapeutic effects. |
| Probiotics | Live beneficial bacteria that promote a healthy balance of gut flora, supporting digestive health and immune function in pets. |
| Antioxidants | Compounds that help neutralize harmful free radicals in the body, promoting cellular health and supporting the immune system in pets. |
| Shelf-Life | The duration of which pet food remains safe and nutritionally viable for consumption after its production date. |
| Prescription diet | Specialized pet food formulated to address specific medical conditions under veterinary supervision. |
| Allergen | A substance that can cause allergic reactions in some pets, leading to food allergies or sensitivities. |
| Canned food | Wet pet food that is packed in cans and contains higher moisture content than dry food. |
| Limited ingredient diet (LID) | Pet food formulated with a reduced number of ingredients to minimize potential allergens. |
| Guaranteed Analysis | The minimum or maximum levels of certain nutrients present in pet food. |
| Weight management | Pet food designed to help pets maintain a healthy weight or support weight loss efforts. |
| Other Nutraceuticals | It includes prebiotics, antioxidants, digestive fiber, enzymes, essential oils and herbs. |
| Other Veterinary Diets | It includes weight management diets, skin and coat health, cardiac care, and joint care. |
| Other Treats | It includes rawhides, mineral blocks, lickables, and catnips. |
| Other Dry Foods | It includes cereal flakes, mixers, meal toppers, freeze-dried foods, and air-dried foods. |
| Other Animals | It includes birds, fish, reptiles, and small animals (rabbits, ferrets, hamsters). |
| Other Distribution Channels | It includes veterinary clinics, local unregulated stores, and feed and farm stores. |
| Proteins and Peptides | Proteins are large molecules composed of basic units called amino acids which help in the growth and development of pets. Peptides are the short string of 2 to 50 amino acids. |
| Omega-3 fatty acids | Omega-3 fatty acids are essential polyunsaturated fats that play a crucial role in the overall health and well-being of Pets |
| Vitamins | Vitamins are the essential organic compounds that are essential for vital physiological functioning. |
| Minerals | Minerals are naturally occurring inorganic substances that are essential for various physiological functions in pets. |
| CKD | Chronic Kidney Disease |
| DHA | Docosahexaenoic Acid |
| EPA | Eicosapentaenoic Acid |
| ALA | Alpha-linolenic Acid |
| BHA | Butylated Hydroxyanisol |
| BHT | Butylated Hydroxytoluene |
| FLUTD | Feline Lower Urinary Tract Disease |
Need More Details on Market Definition?
Ask a Question
Research Methodology
Mordor Intelligence follows a four-step methodology in all our reports.
- Step-1: IDENTIFY KEY VARIABLES: In order to build a robust forecasting methodology, the variables and factors identified in Step-1 are tested against available historical market numbers. Through an iterative process, the variables required for market forecast are set and the model is built on the basis of these variables.
- Step-2: Build a Market Model: Market-size estimations for the forecast years are in nominal terms. Inflation is not a part of the pricing, and the average selling price (ASP) is kept constant throughout the forecast period.
- Step-3: Validate and Finalize: In this important step, all market numbers, variables and analyst calls are validated through an extensive network of primary research experts from the market studied. The respondents are selected across levels and functions to generate a holistic picture of the market studied.
- Step-4: Research Outputs: Syndicated Reports, Custom Consulting Assignments, Databases & Subscription Platforms

Get More Details On Research Methodology
Download PDF


