
Pet Cancer Therapeutics Market Size and Share
Market Overview
| Study Period | 2020 - 2031 |
|---|---|
| Market Size (2026) | USD 505.85 Million |
| Market Size (2031) | USD 781.04 Million |
| Growth Rate (2026 - 2031) | 9.08 % |
| Fastest Growing Market | Asia Pacific |
| Largest Market | North America |
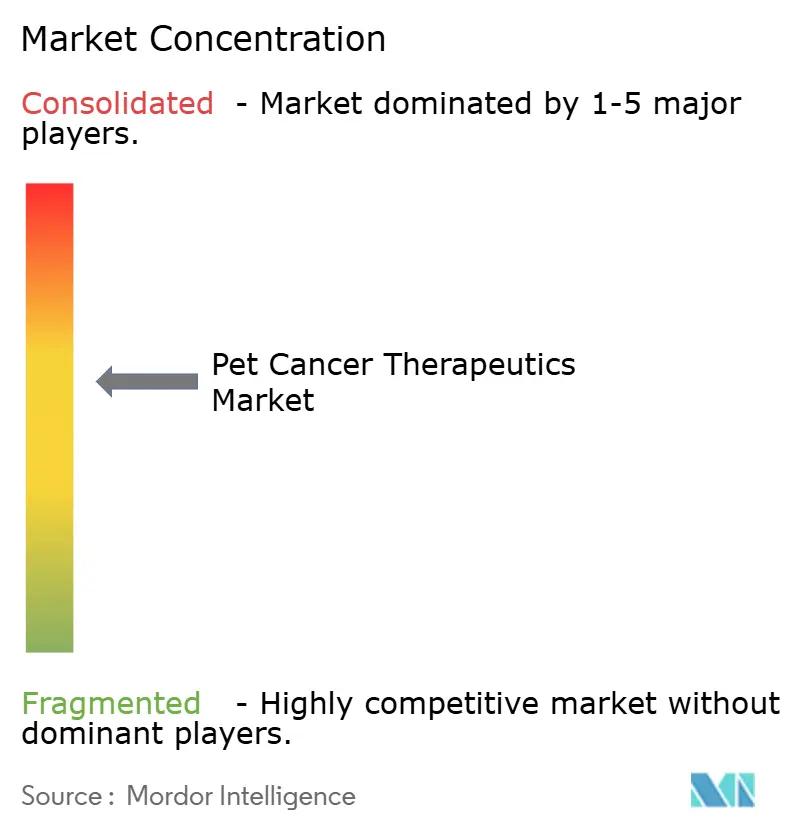
| Market Concentration | Medium |
Major Players *Disclaimer: Major Players sorted in no particular order Image © Mordor Intelligence. Reuse requires attribution under CC BY 4.0. | |
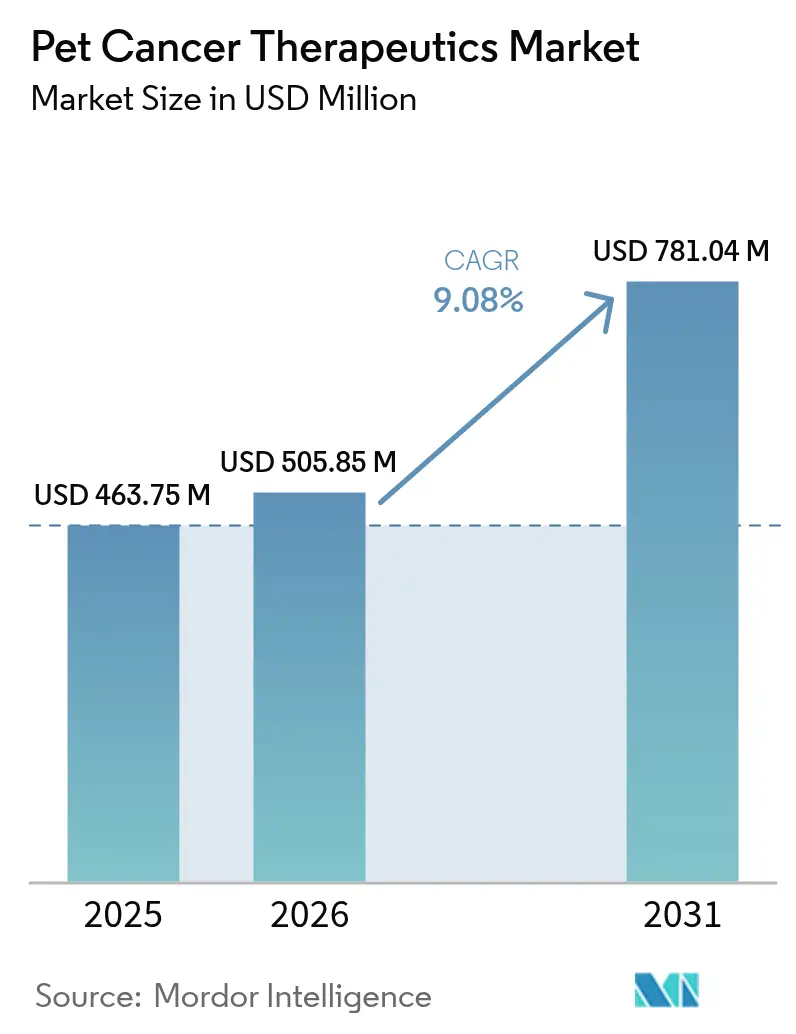
Pet Cancer Therapeutics Market Analysis by Mordor Intelligence
Pet Cancer Therapeutics Market size in 2026 is estimated at USD 505.85 million, growing from 2025 value of USD 463.75 million with 2031 projections showing USD 781.04 million, growing at 9.08% CAGR over 2026-2031.
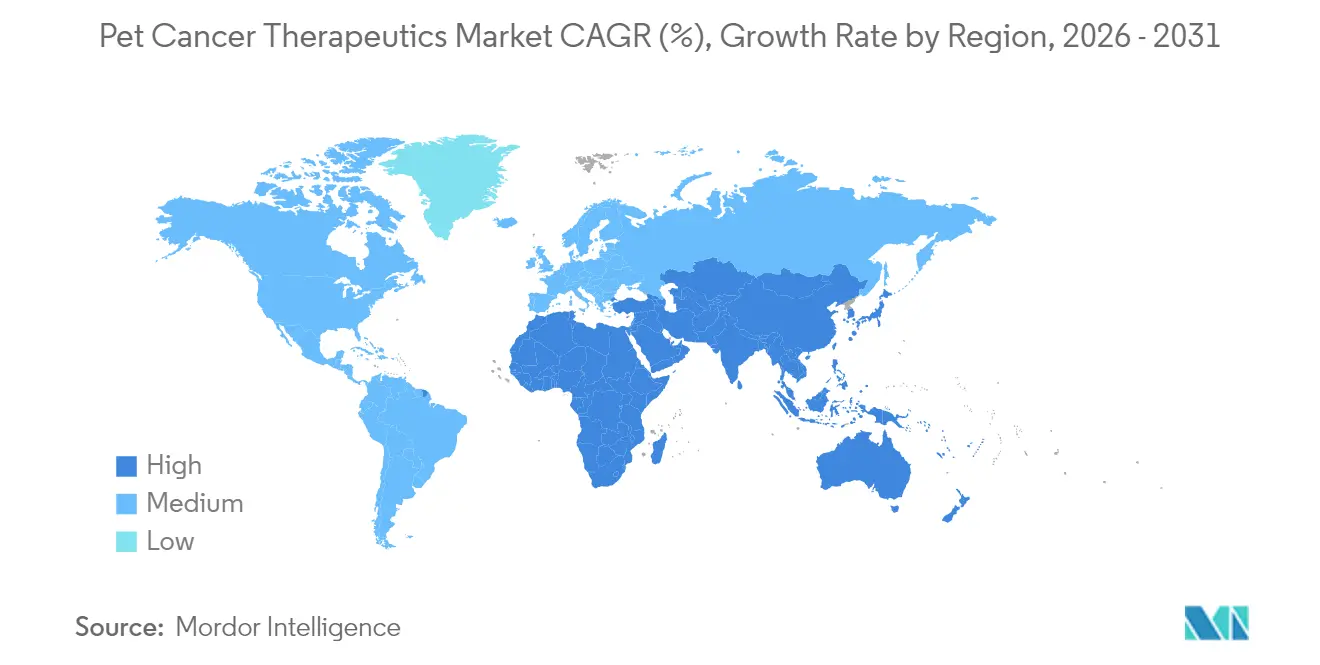
Rising pet humanization, expanding insurance coverage, and regulatory incentives such as the U.S. FDA’s Conditional Approval pathway are sustaining double-digit growth. Immunotherapy is advancing faster than any other therapy class, helped by canine-specific monoclonal antibodies that promise higher efficacy with fewer side effects. North America retains leadership through a 46.04% revenue share on the back of mature specialty hospitals, while Asia-Pacific is set to chart the quickest gains at 12.82% CAGR thanks to surging ownership of companion animals and growing disposable income. Intensifying competition among large incumbents and niche innovators combined with digital tele-oncology platforms widens treatment reach and accelerates product launches.
Key Report Takeaways
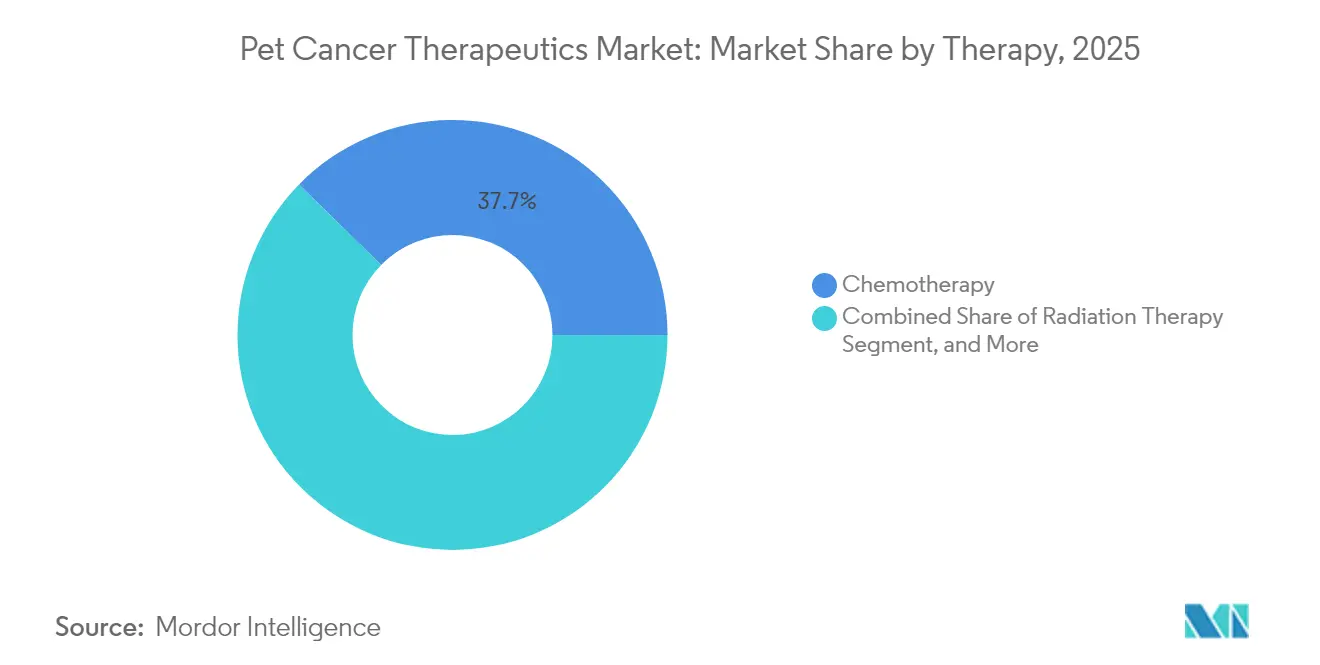
- By therapy, chemotherapy led with 37.65% of the pet cancer therapeutics market share in 2025, whereas immunotherapy is projected to expand at 14.05% CAGR through 2031.
- By animal, dogs captured 71.05% of the pet cancer therapeutics market size in 2025; the feline segment is poised for an 10.89% CAGR to 2031.
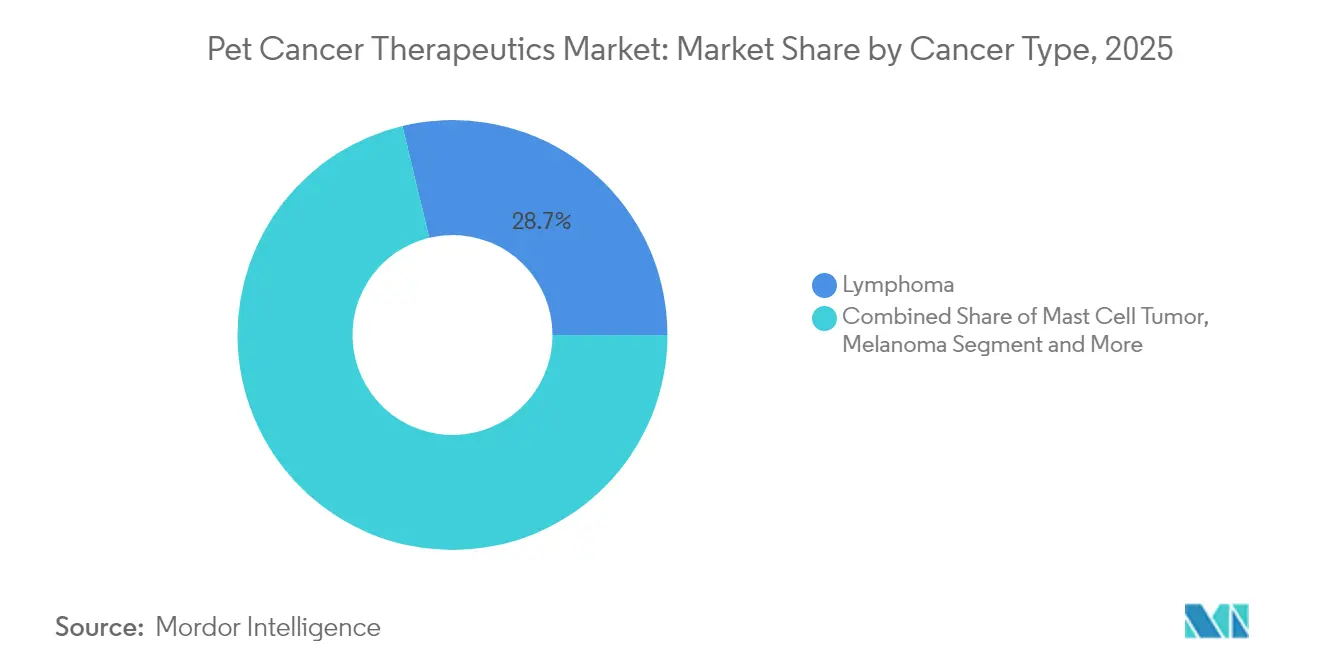
- By cancer type, lymphoma held 28.74% market share in 2025, while osteosarcoma is forecast to record 13.32% CAGR through 2031.
- By mode of administration, injectables contributed 61.88% of the pet cancer therapeutics market size in 2025; oral formulations will grow the fastest at 14.92% CAGR to 2031.
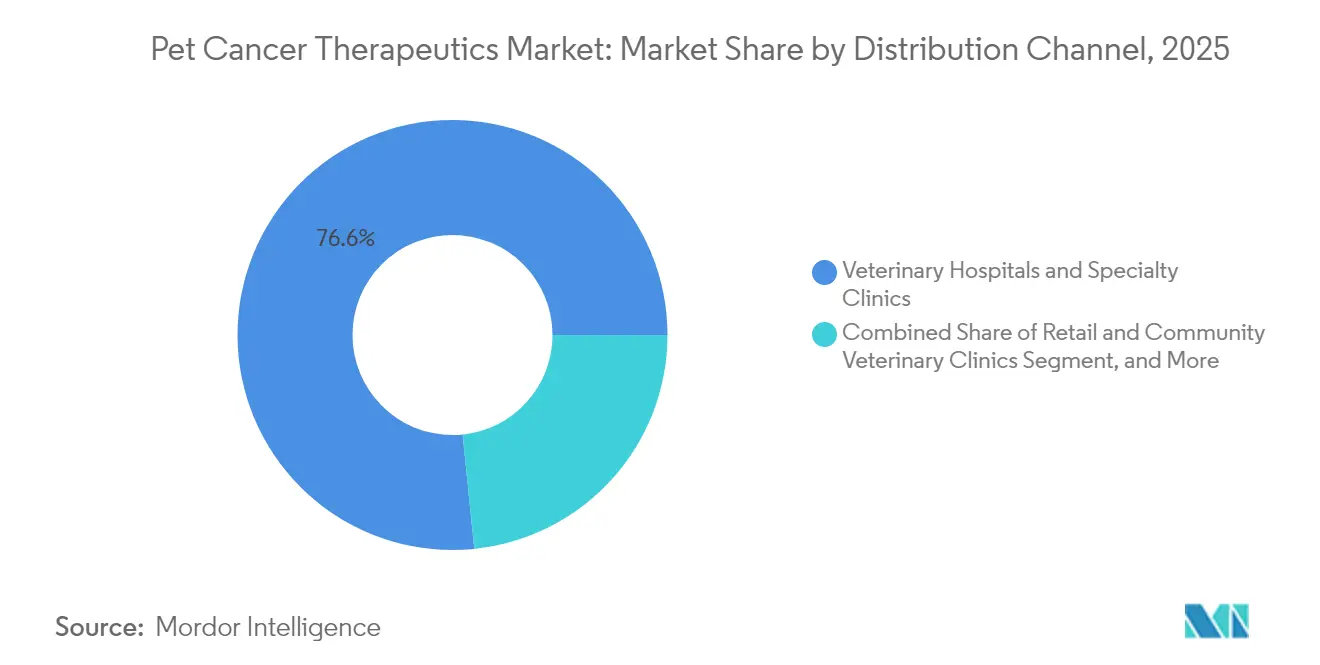
- By distribution channel, veterinary hospitals and specialty clinics claimed 76.62% market share in 2025, yet online pharmacies and tele-oncology platforms are set to rise at 18.05% CAGR to 2031.
- By geography, North America commanded 45.62% of 2025 revenue, whereas Asia-Pacific is estimated to chart a 12.34% CAGR through 2031.
Note: Market size and forecast figures in this report are generated using Mordor Intelligence’s proprietary estimation framework, updated with the latest available data and insights as of 2026.
Market Trends and Insights
Drivers Impact Analysis of Pet Cancer Therapeutics Market*
| Driver | (~) % Impact on CAGR Forecast | Geographic Relevance | Impact Timeline |
|---|---|---|---|
| Veterinary Tele-Oncology Expansion | +9.3% | Asia-Pacific, Latin America | Medium term (2–4 years) |
| Precision Veterinary Oncology Platforms | +5.2% | North America, Europe | Medium term (2–4 years) |
| Monoclonal Antibody Immunotherapies | +4.5% | Global | Long term (≥ 4 years) |
| Pet Humanization and Oncology Awareness | +1.9% | Global | Long term (≥ 4 years) |
| Pet Insurance Covering Oncology | +0.9% | North America, Europe | Short term (≤ 2 years) |
| Companion Animal Tumor Genomics Advances | +0.7% | North America, Europe | Long term (≥ 4 years) |
| Source: Mordor Intelligence | |||
Veterinary Tele-Oncology Expanding Access in Emerging Countries
Shortages of board-certified oncologists in Asia-Pacific and Latin America are mitigated by digital platforms that connect primary veterinarians with specialists. FidoCure’s telemedicine interface supports protocol design and medication logistics across 50-plus markets, enabling standardized care despite geographic gaps.[1] Tele-oncology also integrates e-pharmacies that legally ship therapies, accelerating adoption of novel drugs in second-tier cities.
Growing Adoption of Precision Veterinary Oncology Platforms
Veterinary practices are rapidly embracing genomic testing that matches targeted drugs to the mutational profile of individual tumors. AI-enabled cytology tools, such as Zoetis’ AI Masses, improve diagnostic speed in clinical settings, allowing practitioners to initiate treatment earlier.[2] The convergence of big-data analytics with lower-cost next-generation sequencing is expanding access beyond specialty oncology centers. As predictive algorithms learn from growing datasets, treatment efficacy is expected to increase, thereby reinforcing demand for precision drugs and companion diagnostics. These developments collectively tighten the feedback loop between diagnosis and care, bolstering clinical outcomes and supporting stronger adoption curves across regions with high digital readiness.
Commercialization of Monoclonal Antibody Immunotherapies
Species-specific antibodies are rewriting therapeutic algorithms, offering precision attack on tumor markers while sparing healthy cells. Merck Animal Health’s Gilvetmab an immune checkpoint inhibitor for canine mast cell tumors and melanomas achieved objective response or stable disease in 73% and 60% of cases, respectively.[3] A robust pipeline of anti-PD-1 and anti-PD-L1 candidates is progressing through clinical phases, encouraged by conditional approvals that shorten time to market. Funding has followed: Zoetis’ acquisition of PetMedix signals confidence in canine-exclusive antibody engineering. As cost-of-goods declines, pricing parity with chemotherapy becomes realistic, pushing monoclonals deeper into general practice.
Rise in Pet Humanization and Oncology Awareness Among Pet Owners
Millennial and Gen Z demographics treat companion animals as family members and consume veterinary information on social media. Awareness campaigns highlight early cancer signs, encouraging routine screenings that uncover tumors at treatable stages. These cohorts display higher willingness to explore advanced options and finance care through insurance, credit, or installment plans. Social narratives around survivorship stories amplify perceived therapy value, reinforcing demand for innovative treatments and prompting clinics to invest in oncology infrastructure.
Restraints Impact Analysis of Pet Cancer Therapeutics Market*
| Restraint | (~) % Impact on CAGR Forecast | Geographic Relevance | Impact Timeline |
|---|---|---|---|
| Unharmonized Regulatory Pathways for Autologous Vaccines | –0.6% | Global | Medium term (2–4 years) |
| Limited Reimbursement for Advanced Radiation Modalities | –0.4% | North America, Europe | Short term (≤ 2 years) |
| Shortage of Board-Certified Oncologists | –0.3% | Asia-Pacific, Latin America | Short term (≤ 2 years) |
| Limited Clinical-Trial Infrastructure | –0.2% | Emerging markets | Long term (≥ 4 years) |
| Source: Mordor Intelligence | |||
Unharmonized Regulatory Pathways for Autologous Cancer Vaccines
Although the FDA awards conditional approvals that speed breakthrough medicines to clinics, rules vary widely elsewhere, inflating the cost and complexity of multinational launches. Autologous vaccines, which must be manufactured from each patient’s cells, face divergent sterility, potency, and labeling standards that discourage broad commercialization. Small biotechnology firms shoulder higher compliance spend, delaying expansion and dampening revenue visibility in pivotal early years.
Limited Reimbursement for Advanced Radiation Modalities
High-precision radiation techniques such as FLASH and stereotactic radiation therapy demand capital-intensive machines and specialized teams. Session costs surpass USD 5,000, and insurers often reimburse only partial amounts, shifting expense to owners. Clinics hesitate to invest without predictable case volumes, restricting modality availability to affluent urban centers and widening treatment disparities.
*Our forecasts treat driver/restraint impacts as directional, not additive. The impact forecasts reflect baseline growth, mix effects, and variable interactions.
Pet Cancer Therapeutics Market Segment Analysis
By Therapy:
Immunotherapy Redefines OutcomesChemotherapy remained the largest pillar of the pet cancer therapeutics market in 2025, holding 37.65% of revenue as combination protocols and metronomic regimens retained clinical familiarity. Immunotherapy, however, posted a blazing 14.05% CAGR and is set to narrow the gap by 2031 thanks to approvals of canine-tuned anti-PD-1 antibodies that deliver durable responses in oral adenocarcinoma and other solid tumors. The pet cancer therapeutics market size within immunotherapy is projected to shift the treatment mix toward biologics as owner acceptance rises alongside favorable safety profiles.
The commercialization journey is eased by the FDA’s Veterinary Innovation Program, which offers rolling-review guidance and real-time chemistry, manufacturing, and controls support that compress regulatory timelines. Combination studies pairing monoclonal antibodies with low-dose chemotherapy or oncolytic viruses are underway and may improve complete-response rates. Sustained investor interest is evident in venture rounds flowing to startups building canine-feline antibody libraries.

By Animal:
Canine Dominance but Feline MomentumDogs generated 71.05% of 2025 sales, reflecting both higher cancer incidence and broader therapeutic armamentarium. The pet cancer therapeutics market share of canine products also benefits from decades of oncology research anchored by robust clinical-trial enrollment. Cats, historically underserved due to species-specific tolerability challenges, are now registering an 10.89% CAGR as feline-exclusive formulations emerge.
Advances in sedation protocols and palatable oral suspensions overcome administration hurdles, while growing diagnostic imaging in cat-preferred clinics unveils earlier malignancies. The successful launch of Varenzin-CA1 for anemia signals regulator openness to feline-first pathways, building confidence for oncology candidates in late-stage development.
By Cancer Type:
Lymphoma Leadership, Osteosarcoma SurgeLymphoma held 28.74% of market revenue in 2025, supported by established CHOP-based chemotherapy algorithms and the landmark approval of the oral drug Laverdia-CA1, which streamlines at-home dosing. This indication anchors recurring drug revenue because of chronic management needs. Meanwhile, osteosarcoma commands attention as the fastest-growing niche at 13.32% CAGR, propelled by ECI’s full USDA approval and positive real-world evidence.
Mast cell tumors and melanoma now receive antibody-based interventions that lift overall survival and reinforce the shift to precision medicine. On the horizon, genomic subtyping is expected to subdivide broad histologic labels into actionable micro-segments, paving the way for custom cocktails that strengthen the pet cancer therapeutics market size across diverse malignancies.
By Mode of Administration:
Oral Options Accelerate ConvenienceInjectables still constitute 61.88% of 2025 therapy dollars because cytotoxic and biologic agents rely on parenteral routes for bioavailability. Yet owner preference for home-managed regimens underpins a 14.92% CAGR for oral formulations. The pet cancer therapeutics market size attributable to oral drugs will expand as novel excipients improve stability and taste masking.
Nano-liposomal carriers and controlled-release matrices now enable once-weekly dosing that mitigates stress for both animals and caregivers. Topical and intranasal modalities remain exploratory but could gain ground in small, localized tumors if early pharmacokinetic studies translate into clinical efficacy.
By Distribution Channel:
Digital Ecosystems Disrupt NormsVeterinary hospitals and specialty centers retained 76.62% share in 2025 because complex protocols and infusion-based drugs require in-clinic delivery. Their dominance is supported by corporate roll-ups that standardize oncology service lines across multistate networks. Still, tele-oncology and e-pharmacy platforms are expected to register 18.05% CAGR, buoyed by smartphone ubiquity and policy shifts permitting remote prescribing in several U.S. states.
These platforms integrate electronic health-record uploads, virtual consultations, and overnight drug shipments, fostering continuity of care. For rural communities, mobile clinics partner with tele-oncologists to administer advanced regimens, effectively extending the pet cancer therapeutics market into previously under-served geographies.
Geography Analysis
North America Pet Cancer Therapeutics Market
North America commanded 45.62% of 2025 revenue thanks to early adoption of pet insurance, high specialty-clinic density, and a streamlined conditional-approval framework that accelerates novel drug launches. The PAW Act, now under Congressional review, seeks to offer tax advantages for veterinary expenses and could broaden access once enacted. Universities such as Florida and Colorado State maintain translational oncology programs that funnel scientific breakthroughs into commercial pipelines, further entrenching regional leadership.
Europe Pet Cancer Therapeutics Market
Europe captured moderate market share, though penetration varies sharply. Sweden’s 83% dog-insurance rate fosters robust uptake of premium therapies, whereas southern markets show softer demand due to lower reimbursement levels. Ongoing consolidation by private-equity-backed veterinary chains enhances service standardization but sparks pricing debates as consultation fees rise. The European Medicines Agency is updating its Veterinary Medicinal Products Regulation to create mutual-recognition pathways that could shrink launch timelines for biologicals.
APAC Pet Cancer Therapeutics Market
Asia-Pacific posted the fastest 12.34% CAGR outlook, anchored by China’s expanding middle class and rising pet longevity. Urban clinics in Tier-1 cities record double-digit oncology revenue growth as millennials allocate discretionary income to diagnostics such as CT and MRI. Regulatory capacity is still maturing; however, pilot programs in Japan and Australia allow recognition of selected U.S. or EU safety dossiers, potentially truncating approval cycles for high-need therapeutics. Venture capital is flowing into regional telemedicine start-ups that specialize in oncology triage, positioning Asia-Pacific to leapfrog traditional infrastructure constraints and capture share in the global pet cancer therapeutics market.
Regulatory Landscape
In the United States, pet cancer therapeutics follow the FDA Center for Veterinary Medicine (CVM) New Animal Drug Application framework under 21 CFR Part 514, with oncology-specific development direction covered in CVM Guidance for Industry (GFI) #237 and broader protocol development addressed in GFI #215. These pathways emphasize substantial evidence of effectiveness and target animal safety, alongside human user safety considerations for cytotoxic products. They also shape the report’s emphasis on faster-to-clinic routes such as conditional approvals and rolling-review support for novel oncology candidates.
In Europe, the European Medicines Agency (EMA) and its Committee for Medicinal Products for Veterinary Use (CVMP) operate under the Veterinary Medicinal Products Regulation (EU) 2019/6, and the agency is revising dossier requirements guidance for anticancer medicinal products for dogs and cats to align with this framework. The limited number of centrally authorized veterinary anticancer products increases the value of clearer, harmonized data expectations. Procedures such as accelerated assessment (Article 44(3) of Regulation 2019/6) also remain relevant for products demonstrating significant therapeutic innovation. On the clinical-practice side, the 2026 AAHA Oncology Guidelines for Dogs and Cats act as a key professional standard, shaping staging, treatment selection, and consistent care protocols that influence therapy uptake.
Competitive Landscape
Zoetis leads with a diversified companion-animal portfolio that generated significant revenue, underpinned by strong brand equity and a robust pipeline spanning dermatology to oncology. Its acquisition of PetMedix secures proprietary antibody-engineering platforms, underscoring a strategic pivot toward biologics. Merck Animal Health follows closely, leveraging Gilvetmab’s first-mover advantage in immune checkpoint inhibition to broaden its oncology footprint.
Elanco concentrates on lifecycle management of its small-molecule staples while co-developing next-generation vaccines with start-ups to diversify. Smaller innovators such as ELIAS Animal Health exploit regulatory incentives that favor autologous immunotherapies; the company now partners with 100 authorized centers for ECI infusion, rapidly building installation density. Boehringer Ingelheim’s September 2024 purchase of Saiba Animal Health grants access to therapeutic-vaccine know-how targeting chronic pet diseases, including cancer.
Competitive intensity is magnified by digital-health entrants that bundle genomic diagnostics, tele-oncology, and e-commerce drug delivery. These integrated models create data loops attractive to pharmaceutical partners seeking real-world evidence. As acquisition multiples climb, mid-tier firms may pursue alliances over outright purchases to control capital outlay while securing market access.
Pet Cancer Therapeutics Industry Leaders
-
Boehringer Ingelheim GmbH (Merial)
-
Zoetis
-
ELIAS Animal Health
-
Vivesto AB (AdvaVet)
-
Elanco Animal Health
- *Disclaimer: Major Players sorted in no particular order
Pet Cancer Therapeutics Market Companies Covered in this Report
- AB Science
- Vivesto AB (AdvaVet)
- Boehringer Ingelheim (Merial)
- Elanco
- Zoetis
- Dechra Pharmaceuticals (Anivive)
- Karyopharm Therapeutics
- ELIAS Animal Health
- Torigen Pharmaceuticals
- Virbac
- Norbrook
- Elekta
- QBiotics Group
- Vetoquinol
- KindredBio
- Regeneus Ltd
- Orion Corp (Animal Health)
- Nippon Zenyaku Kogyo (Zenoaq)
- PetCure Oncology
- Heska Corp
- VCA Animal Hospitals (Mars Inc.)
Market Opportunities and Future Outlook
Oral, at-home oncology care and supportive-care add-ons represent a commercialization opportunity where owner convenience and clinic capacity constraints align with formal regulatory acceptance. A specific proof point is the FDA CVM full approval of Anivive Lifesciences Laverdia (verdinexor tablets) in June 2026 as the first oral, at-home treatment for canine lymphoma, expanding the addressable population beyond infusion-centric specialty settings. Adjacent supportive-care development can also support broader protocol adoption: in June 2026, Jaguar Health submitted a New Animal Drug Application to the FDA for crofelemer (Canalevia) to treat chemotherapy-induced diarrhea in dogs, targeting a common adverse-event barrier that can limit adherence to cytotoxic regimens.
Immunotherapy and precision oncology continue to create whitespace in solid tumors and underserved indications, supported by multisite clinical networks and standardized practice frameworks. Vetigenics initiated the CHECKMATE K9 pilot study in June 2025 to evaluate a dual immune checkpoint inhibitor approach in dogs with solid tumors, reinforcing the shift toward species-tailored immuno-oncology beyond hematologic cancers. On the evidence-generation side, Vivesto AB completed recruitment in June 2026 for a Paccal Vet pilot study in dogs with splenic hemangiosarcoma, reflecting ongoing investment in new formulations and trial infrastructure. The 2026 AAHA Oncology Guidelines also provide a shared baseline for diagnosis, staging, and treatment workflows, improving comparability of outcomes across primary care, specialty clinics, and tele-oncology-enabled pathways.
Recent Industry Developments in Pet Cancer Therapeutics Market
- June 2026: Anivive Lifesciences announced that the US FDA Center for Veterinary Medicine granted full approval for Laverdia (verdinexor tablets) for canine lymphoma, positioning it as the first oral, at-home treatment of its kind. The approval expands access beyond infusion-focused specialty sites and supports the shift toward owner-administered regimens that can scale through general practice and online pharmacy fulfillment.
- March 2025: ELIAS Animal Health received full approval from the US Department of Agriculture Center for Veterinary Biologics for ELIAS Cancer Immunotherapy (ECI) for canine osteosarcoma. With availability across 100 authorized centers, the approval strengthened the commercial foundation for autologous immunotherapies and expanded real-world treatment capacity for a high-mortality indication.
- September 2024: Boehringer Ingelheim announced the acquisition of Saiba Animal Health, adding a virus-like particle (VLP) technology platform to its pet therapeutics R&D portfolio for chronic diseases, including cancer-relevant therapeutic vaccine work. The deal expanded capability depth in immunology-led modalities and increased competitive pressure on incumbents as large animal-health players broaden beyond small molecules.
Pet Cancer Therapeutics Market Report Scope and Research Methodology
Market Definition and Coverage
For this study, the market covers therapeutics used to treat cancer in companion animals, including drug therapies and procedure-based oncology care delivered through veterinary clinics and hospitals, and sized as market value in USD.
Scope exclusions: We do not count routine wellness visits, general imaging not tied to a cancer workup, or supportive products sold without an oncology treatment plan.
Segments Covered in This Report
- By Therapy
- Chemotherapy
- Radiation Therapy
- Immunotherapy
- Targeted Small-Molecule TKIs
- Gene Therapy & Oncolytic Viruses
- Other Therapies
- By Animal
- Dog
- Cat
- Other Companion Animals
- By Cancer Type
- Lymphoma
- Mast Cell Tumor
- Melanoma
- Mammary & Squamous-Cell Cancer
- Osteosarcoma
- Other Cancer Types
- By Mode of Administration
- Injectable
- Oral
- Topical
- By Distribution Channel
- Veterinary Hospitals & Specialty Clinics
- Retail & Community Veterinary Clinics
- Online Pharmacies & Tele-Oncology Platforms
- By Geography
- North America
- United States
- Canada
- Mexico
- Europe
- Germany
- United Kingdom
- France
- Italy
- Spain
- Rest of Europe
- Asia-Pacific
- China
- Japan
- India
- Australia
- South Korea
- Rest of Asia-Pacific
- Middle East & Africa
- GCC
- South Africa
- Rest of Middle East & Africa
- South America
- Brazil
- Argentina
- Rest of South America
- North America
Data Sources, Market Sizing, and Validation
Desk Research
Desk research is used to set the care pathway basics and demand drivers, then to identify which therapies are actually used in day-to-day veterinary oncology. Sources reviewed include public references such as the American Veterinary Medical Association (AVMA), the US FDA Center for Veterinary Medicine, the USDA, and peer-reviewed veterinary oncology journals, which help validate definitions, approvals, and treatment practices.
We also cross-check context from national statistics offices (pet ownership and demographics), customs and trade portals (broad pharma trade signals), and company filings and investor presentations (product focus and geographic exposure). A paid subscription database for company financials and news is used to track major launches, M&A, and reported business line commentary. These examples are illustrative only, and many other public sources were also used for data collection, validation, and clarification.
Primary Interviews and Surveys
Primary inputs test desk assumptions with veterinarians, veterinary oncologists, hospital buyers, distributors, and other industry specialists who see treatment patterns directly. Respondent views are collected across the major regions so referral behavior, therapy availability, and pricing differences can be reflected, and then assumptions are adjusted when the feedback points to a consistent gap.
Distribution of primary research fieldwork respondents
| Company type | Respondent position | Region |
|---|---|---|
| Top tier: 29% | CXOs: 16% | APAC: 47% |
| Mid tier: 51% | Functional/Unit leaders: 33% | EMEA: 31% |
| Smaller Players: 20% | Managers: 51% | Americas: 22% |
Market-Sizing & Forecasting
Our sizing starts with a top-down build that reconstructs the treated demand pool by linking pet population and aging indicators to cancer incidence, diagnosis rates, and the share of diagnosed pets that receive active therapy through veterinary care. Once the treatment funnel is set, value is derived using therapy mix and typical course level pricing, which is adjusted by region and setting (general practice versus referral oncology).
To keep the model repeatable, inputs include practical fingerprints such as the dog and cat mix by region, diagnosed case share versus suspected cases, uptake split across chemotherapy, targeted therapy, immunotherapy, and radiation therapy, and price movement tied to inflation and mix shift. Results are corroborated with selective bottom-up approximations such as sampled clinic price lists multiplied by plausible annual caseload ranges, distributor channel checks on fast-moving oncology items, and consistency checks against disclosed product focus in public filings. For forecasting, scenario analysis is applied so the outlook reflects different adoption paths for newer therapies and referral growth, with variable level ranges aligned to what was heard in interviews. Where granular evidence is thin in smaller countries, proxy ratios from similar care systems are applied, and then totals are rebalanced back to the regional funnel so the final sums stay consistent.
Data Validation & Update Cycle
Model outputs are checked against independent signals so obvious errors do not flow into the final numbers, including currency consistency, year-on-year growth reasonableness, and cross-checks against reported clinic capacity additions and meaningful therapy launches. When a variance is large, the underlying drivers are revisited, and follow-up outreach is triggered to confirm whether the gap is due to pricing, utilization, or therapy mix.
Before sign-off, the work is reviewed in steps by another analyst who re-tests sensitive assumptions and recalculates key parts of the model. The report is refreshed annually, and interim updates are done when material events occur, such as a notable regulatory change or a major therapy introduction. Right before delivery, we complete a final pass so clients receive the latest updated view.
Mordor Intelligence's Pet Cancer Therapeutics Market Estimate Compared With Other Published Estimates
Published market sizes can differ even when they use similar words, because the counted therapies, the year used as the starting point, and the way pricing is applied are not always aligned. Gaps also appear when a number is built from broad addressable demand instead of from treated cases that flow through real veterinary care settings.
Therapy mix checks, treated case funnel logic, and regional price normalization are common drivers behind the spread. Some figures expand the definition by blending in adjacent care items, and others keep a narrower therapeutics lens but use older adoption assumptions that do not fully reflect specialty referral growth.
Benchmark comparison
| Source | Market Size | Gaps in Research Methodology |
|---|---|---|
| Mordor Intelligence | USD 0.51 B (2026) | |
| Industry Publisher A | USD 0.45 B (2024) | Uses an earlier base year and a simpler adoption curve, which can understate recent therapy uptake in referral networks and advanced clinics. |
| Global Publisher B | USD 0.43 B (2025) | Broadly includes surgery and palliative care within the market value, which changes the counted revenue pool compared with therapeutics-only sizing. |
Overall, the gap is mostly explained by year alignment and whether non-therapeutic oncology services are included in the counted value. Observed clinic level therapy mix and treated caseload checks are the evidence that ties Mordor Intelligence to the therapeutics demand pool that is actually treated and paid for in veterinary oncology channels.
Key Questions Answered in the Report
How large is the pet cancer therapeutics market today and how fast is it expanding?
The market is valued at USD 505.85 million in 2026 and is forecast to grow at a 9.08% CAGR to reach USD 781.04 million by 2031.
Which treatment category is growing the quickest?
Immunotherapy is the fastest-advancing segment, expected to post a 14.05% CAGR through 2031, outpacing chemotherapy and radiation therapy.
How does pet insurance influence demand for cancer treatments?
With 6.25 million insured pets in North America up 16.7% from 2023 insurance plans that cover up to 90% of oncology costs are making advanced therapies affordable for a much wider owner base.
Which regions offer the strongest opportunities for revenue expansion?
North America holds the largest share at 45.62%, while Asia-Pacific is projected to record the highest regional CAGR of 12.34% between 2026 and 2031.
What impact will tele-oncology have on future market growth?
Online pharmacies and tele-oncology platforms are expected to grow at 18.05% CAGR, extending specialist expertise and drug access to underserved areas and fueling overall market adoption.
Who are the leading companies and how concentrated is the market?
Zoetis, Merck Animal Health, Elanco and ELIAS Animal Health together control major share of the global revenue, indicating a moderately concentrated landscape with room for innovative entrants.