
Polyethylene Terephthalate (PET) Beverage Packaging Market Size and Share
Market Overview
| Study Period | 2020 - 2031 |
|---|---|
| Market Size (2026) | USD 79.62 Billion |
| Market Size (2031) | USD 103.68 Billion |
| Growth Rate (2026 - 2031) | 5.42 % |
| Fastest Growing Market | Asia Pacific |
| Largest Market | Asia Pacific |
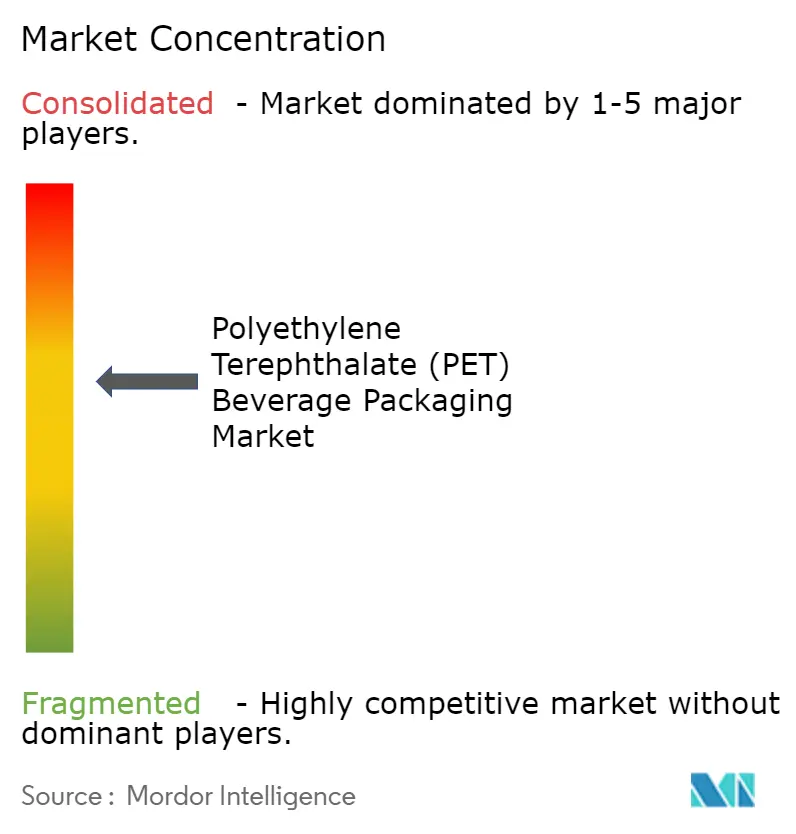
| Market Concentration | Medium |
Major Players *Disclaimer: Major Players sorted in no particular order Image © Mordor Intelligence. Reuse requires attribution under CC BY 4.0. | |
Polyethylene Terephthalate (PET) Beverage Packaging Market Analysis by Mordor Intelligence
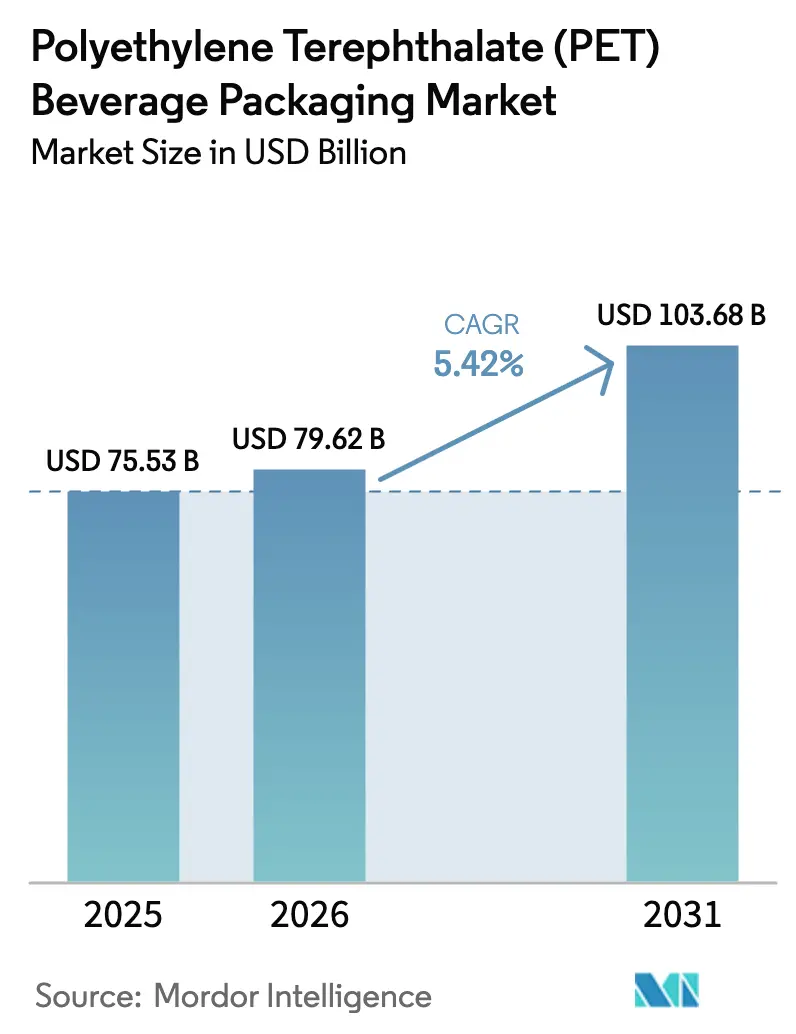
The polyethylene terephthalate (PET) beverage packaging market size is expected to grow from USD 75.53 billion in 2025 to USD 79.62 billion in 2026 and is forecast to reach USD 103.68 billion by 2031 at 5.42% CAGR over 2026-2031. Robust demand comes from PET’s barrier performance, compatibility with high-speed filling lines, and recyclability advantages that help brand owners satisfy tightening environmental mandates. Lightweighting programs that cut gram weight while preserving carbonation retention keep material cost in check and reduce logistics emissions. Regulatory requirements for recycled content, especially in the European Union and India, stimulate rapid capacity additions in food-grade rPET. Consolidation among leading converters increases purchasing leverage for resin and funds investments in chemical recycling. Supply chain risk remains tied to feedstock volatility and geopolitical disruptions, but integrated players offset much of this pressure through long-term contracts and hedging strategies. Altogether, these forces sustain steady growth while positioning sustainability capabilities as the main source of competitive edge in the polyethylene terephthalate (PET) beverage packaging market.
Key Report Takeaways
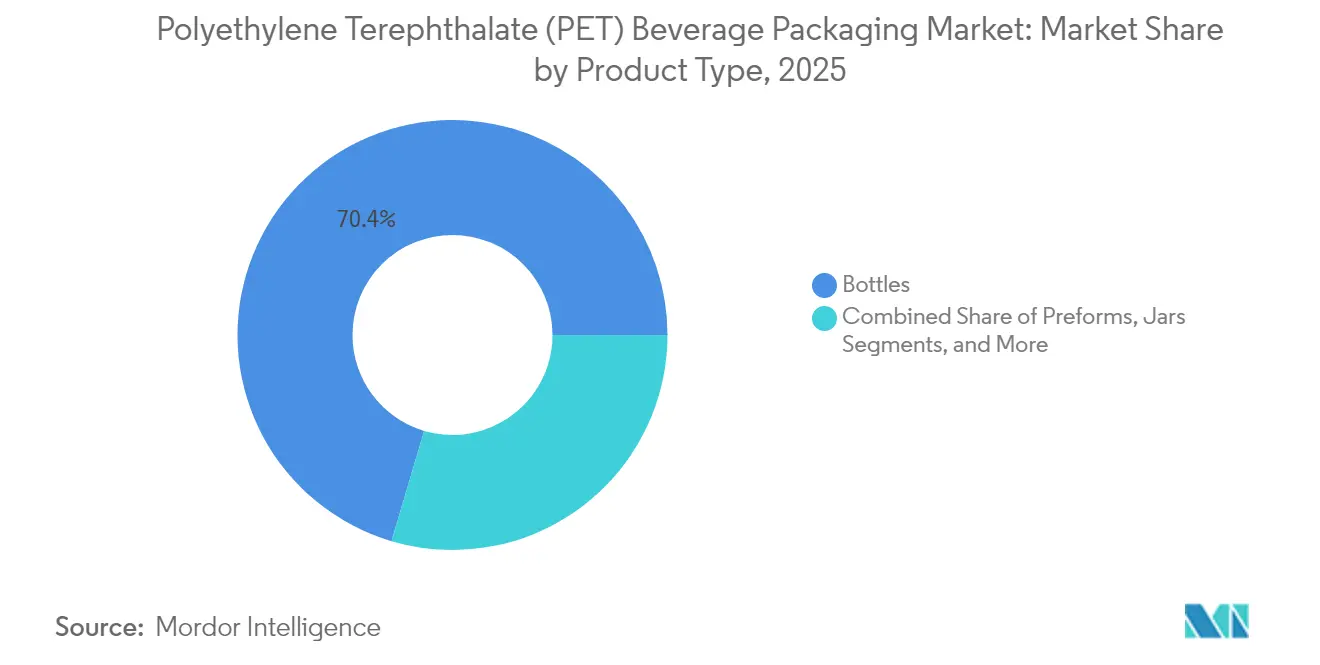
- By product type, bottles led with 70.42% revenue share in 2025; lids/caps and closures record the fastest 7.76% CAGR through 2031.
- By capacity, the 501-1,000 ml range held 38.44% of the polyethylene terephthalate (PET) beverage packaging market share in 2025, while containers ≤ 250 ml expand at a 6.93% CAGR to 2031.
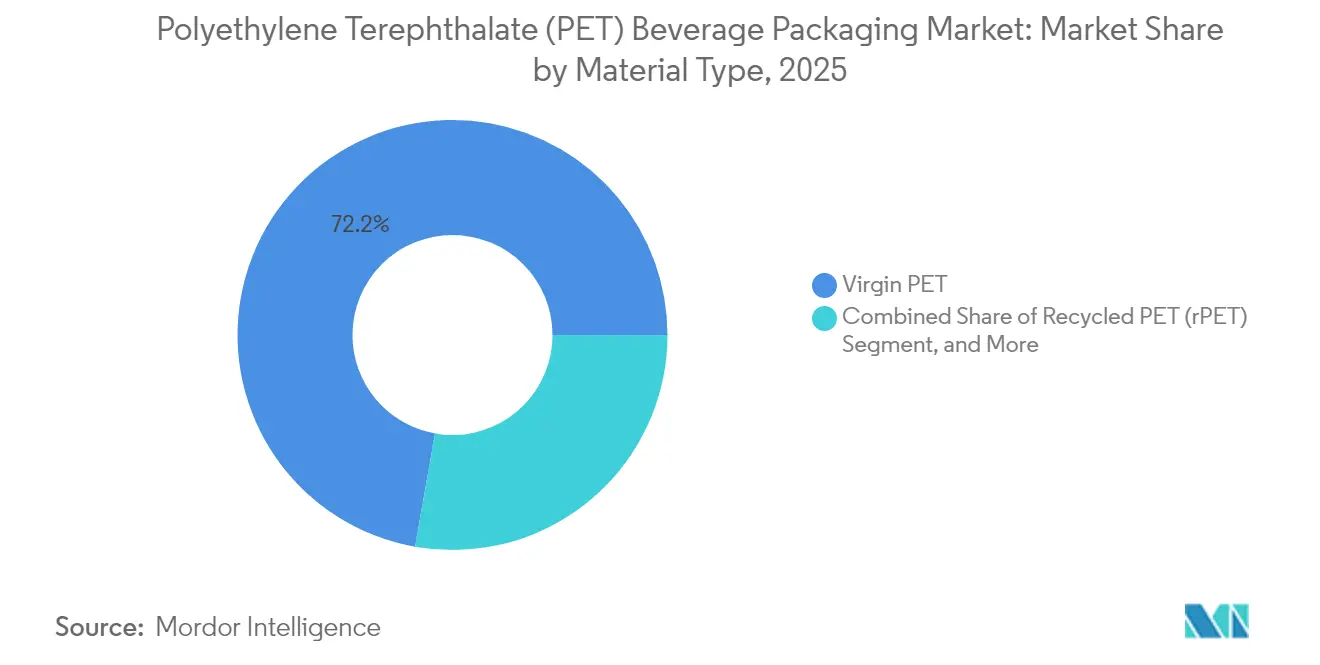
- By material, virgin PET captured 72.21% share in 2025; recycled PET grows at an 8.61% CAGR, the quickest among all materials.
- By end-user industry, water bottles accounted for 34.58% of the polyethylene terephthalate (PET) beverage packaging market size in 2025; energy and sports drinks rise at an 8.21% CAGR through 2031.
- By geography, Asia-Pacific commanded 42.63% share in 2025 and also posts the strongest 6.29% CAGR to 2031.
Note: Market size and forecast figures in this report are generated using Mordor Intelligence’s proprietary estimation framework, updated with the latest available data and insights as of 2026.
Market Trends and Insights
Drivers Impact Analysis of Polyethylene Terephthalate (PET) Beverage Packaging Market*
| Driver | (~) % Impact on CAGR Forecast | Geographic Relevance | Impact Timeline |
|---|---|---|---|
| Superior lightweight-to-strength ratio and clarity | +1.2% | Global, with strongest adoption in North America & Europe | Medium term (2-4 years) |
| Surging demand for recycled and rPET-content bottles | +1.8% | Global, led by EU mandates, expanding to Asia-Pacific | Long term (≥ 4 years) |
| Expansion of bottled water and functional beverage categories | +1.1% | Asia-Pacific core, spill-over to MEA and Latin America | Short term (≤ 2 years) |
| Bio-based PET capacity additions unlocking EPR credits | +0.7% | North America & EU, pilot programs in Japan | Long term (≥ 4 years) |
| EU tethered-cap directive accelerating bottle redesign | +0.5% | Europe primary, potential adoption in California by 2027 | Medium term (2-4 years) |
| On-premise refill programs pivoting to refillable PET | +0.3% | Europe and North America urban centers | Medium term (2-4 years) |
| Source: Mordor Intelligence | |||


Superior lightweight-to-strength ratio and clarity
Coca-Cola’s lightweighting cut the 12–20 oz bottle from 21 g to 18.5 g, saving 3 million t of PET yearly and lowering haulage emissions while safeguarding carbonation standards.[1]Matt Reynolds, “Coke’s ‘First in Decades’ PET Lightweighting Project,” packworld.com Blow-molding refinements orient polymer chains for higher rigidity, letting converters lower resin use without risk of side-wall paneling. Ring Container’s Trimlite cut wide-mouth jar weight by 40% while keeping oxygen barrier, underlining PET’s cost-to-performance edge versus aluminum, which saw price swings during can shortages. Such advances help brands defend margins in markets where packaging can be 20% of delivered product cost. As emerging economies scale soft-drink output, lightweight PET unlocks volume growth without proportional resin demand, further stabilising the polyethylene terephthalate (PET) beverage packaging market.
Surging demand for recycled and rPET-content bottles
The EU’s 25% recycled content rule for 2025 and India’s 30% mandate from April 2025 are forcing brands to lock in supply contracts with recyclers or risk paying price premiums of up to 30%. Europe lifted collection rates to 75% in 2022, allowing average bottle rPET content of 24%.[2]Packaging Europe, “Where is Europe’s PET industry at in 2025?” packagingeurope.com DePoly’s USD 23 million Swiss plant and GR3N’s microwave depolymerisation add virgin-grade feedstock from contaminated waste, narrowing the deficit. Integrated converters that own recycling assets secure feedstock and strengthen negotiation power, fuelling growth in the polyethylene terephthalate (PET) beverage packaging market.
Expansion of bottled water and functional beverage categories
Sports and energy drinks posted 9% retail growth in 2023 as hydration shifted from sports-only to daily wellness, a trend amplified in Asia-Pacific where urban heat drives water purchases.[3]Jessica Jacobsen, “2024 State of the Beverage Industry: Sports Drinks Embrace Everyday Wellness,” bevindustry.com PET’s shatter resistance supports on-the-go consumption and e-commerce delivery, areas where glass breakage risk outweighs its premium perception. Keurig Dr Pepper’s USD 990 million move on GHOST Energy secures distribution heft in a high-margin niche. Portion-controlled high-protein drinks also choose PET for light weight and ease of labeling, pushing demand for specialty preforms and closures.
Bio-based PET capacity additions unlocking EPR credits
Indorama and Suntory commercialised bio-paraxylene bottles in Japan, producing 45 million units in 2024 and earning Extended Producer Responsibility offsets that cut compliance costs. Origin Materials’ biomass-derived PET shows carbon-negative life-cycle scores, turning packaging from emission source to carbon sink. Early adopters secure shelf space with sustainability claims and defend price premiums that shelter R&D payback. Limited supply grants scarcity value, nudging brands to long-term offtake deals and supporting strategic investment flows into the polyethylene terephthalate (PET) beverage packaging market.
Restraints Impact Analysis of Polyethylene Terephthalate (PET) Beverage Packaging Market*
| Restraint | (~) % Impact on CAGR Forecast | Geographic Relevance | Impact Timeline |
|---|---|---|---|
| Single-use-plastic taxes and bans tightening globally | -1.4% | Global, with strictest enforcement in EU and select US states | Short term (≤ 2 years) |
| Volatility in PTA/MEG feedstock prices | -0.9% | Global, with highest impact in Asia-Pacific manufacturing hubs | Short term (≤ 2 years) |
| Aluminum-can substitution in carbonated drinks | -0.6% | North America and Europe premium segments | Medium term (2-4 years) |
| Deposit-return schemes favouring glass in DACH and Nordics | -0.3% | Northern Europe, potential expansion to other EU markets | Medium term (2-4 years) |
| Source: Mordor Intelligence | |||
Single-use plastic taxes and bans tightening globally
Oregon’s Bottle Bill now covers wine, adding a 10-cent deposit that raises handling cost and blunts PET’s lightweight economics. California is considering tethered-cap rules by 2027, nudging global brand lines toward standardised EU-compliant formats. Fragmented regulations force brands to manage multiple packaging variants, driving up inventory and tooling fees. Smaller beverage firms face disproportionate cost pressure, nudging market share toward large multinationals that can navigate compliance complexity.
Volatility in PTA/MEG feedstock prices
April 2025 PET prices rose 1–2 cents per pound even as feedstock costs softened 9% from 2024, illustrating how trade policy, tariffs and anti-dumping actions decouple resin from oil dynamics. Production cuts in China and Europe create artificial scarcity that keeps price floors high. European PET sits at EUR 1,130–1,170 t (USD 1,224–1,268 t). Currency gyrations and shipping disruptions linked to the Russia-Ukraine conflict complicate procurement planning, favouring converters with hedging sophistication and multi-regional plant networks.
*Our forecasts treat driver/restraint impacts as directional, not additive. The impact forecasts reflect baseline growth, mix effects, and variable interactions.
Polyethylene Terephthalate (PET) Beverage Packaging Market Segment Analysis
By Product Type:
Bottles Dominate Despite Closure InnovationBottles accounted for 70.42% of 2025 revenue and remain the backbone of the polyethylene terephthalate (PET) beverage packaging market. The segment benefits from high tooling utilisation, global standardisation, and compatibility with carbonated and still beverages. Origin Materials’ all-PET tethered cap unlocks mono-material recycling, signalling eventual closure migration away from PP and HDPE. The polyethylene terephthalate (PET) beverage packaging market size for bottles is projected to rise alongside functional drinks that demand advanced oxygen barriers.
Closures record the fastest 7.76% CAGR, bolstered by EU legislation and the USD 65 billion opportunity in attached caps. Over 20 converters already qualified PET closure designs for Fortune 500 clients. Mono-material closures promise line-side simplification and remove mixed-polymer contamination, strengthening recycling economics and opening a new frontier of differentiation inside a previously commodity-like segment. Preforms retain importance as traded intermediates, especially in regions where bottle blowing happens close to filling lines, while jars stay niche for premium teas and kombucha.


By Capacity Type:
Small Formats Drive PremiumisationThe 501–1,000 ml range held 38.44% polyethylene terephthalate (PET) beverage packaging market share in 2025 thanks to its versatility across water, soft drinks and ready-to-drink coffees. Yet containers not exceeding 250 ml show the highest 6.93% CAGR, mirroring portion-control and on-the-go consumption. The polyethylene terephthalate (PET) beverage packaging market size for these small formats is forecast to rise as brands deploy premium price points per ounce.
Small bottles help energy drinks and nutraceutical beverages capture impulse purchases at convenience stores. PET’s light weight improves pallet efficiency relative to glass miniatures, while clear walls showcase natural colourants in functional beverages. Larger formats above 1 L cater to family consumption but face refrigerator-door dimension constraints. Growth in e-grocery triggers interest in square cross-sections and handle-less jugs that maximise cube utilisation.
By Material Type:
Recycled Content Mandates Reshape SupplyVirgin PET still controlled 72.21% of 2025 volume, supported by vast polymerisation capacity and predictable quality. Yet recycled PET clocks an 8.61% CAGR as brands race to hit 25% content targets in Europe by 2025 and 30% by 2030. The polyethylene terephthalate (PET) beverage packaging market size for rPET is expanding faster than collection growth, resulting in price premiums that can reach USD 350 t over virgin equivalents.
Food-grade rPET scarcity encourages chemical recycling investments that produce interchangeable polymer at lower impurity thresholds. Early movers secure offtake contracts and lock in margins, while converters without captive recycling build consortia to guarantee supply. Bio-based PET remains niche but commands price premiums due to carbon-negative credentials and EPR credits; its long-term adoption depends on scaling of bio-PX feedstock from waste cooking oil and lignocellulosic biomass.
By End-user Industry:
Functional Categories Outpace TraditionalWater retained 34.58% volume share in 2025, reflecting basic hydration needs in markets with poor municipal supply. Functional, energy and sports drinks, though smaller in absolute litres, post the fastest 8.21% CAGR as consumers seek protein, electrolytes and caffeine on the move. Packaging must withstand low-pH formulations and preserve carbonation in high-pressure energy drinks, making PET the pragmatic choice for performance-oriented brands.
Higher-margin functional drinks support investment in smart closures and embossed designs that reinforce brand storytelling. Carbonated soft drinks face sugar-tax headwinds yet still generate significant PET demand in emerging economies. Alcoholic beverage use of PET is limited but rising for outdoor festivals and aviation, where weight, safety and quick recycling matter more than glass’s premium cues.
Geography Analysis
APAC Polyethylene Terephthalate (PET) Beverage Packaging Market
Asia-Pacific held 42.63% of global revenues in 2025 and expands at 6.29% CAGR. Rising middle-class incomes, rapid urbanisation and retail network penetration lift demand for packaged hydration. China’s anti-dumping duties protect domestic resin producers, while India’s 30% rPET rule from April 2025 accelerates backward integration among global bottlers. Japan and South Korea spearhead labelless bottles that minimise downstream delabelling costs, highlighting regional innovation strength.
North America Polyethylene Terephthalate (PET) Beverage Packaging Market
North America remains the second-largest region with entrenched consumption habits and premium functional drink launches. California’s evolving recycled-content proposals and Oregon’s expanded bottle bill raise compliance complexity. Canada and Mexico supply resin at scale, balancing trade flows when US feedstock prices spike.
Europe Polyethylene Terephthalate (PET) Beverage Packaging Market
Europe is the most regulated landscape, featuring tethered caps and escalating recycled-content thresholds. Collection infrastructure allows 75% retrieval rates, yet rPET demand already overshoots supply, spurring plant investment in Spain, Poland and Germany. Nordic glass-favoured deposit systems present substitution risk, but lightweight refillable PET alternatives begin to appear in retail pilots.
LATAM and MEA Polyethylene Terephthalate (PET) Beverage Packaging Market
Latin America, the Middle East and Africa contribute smaller shares but post solid growth as climate conditions and demographic profiles drive beverage uptake. Currency fluctuations and patchy recycling infrastructure shape entry strategies, prompting converters to partner with local collectors and NGOs to secure feedstock while building brand goodwill.


Regulatory Landscape
Regulation is increasingly framed around circularity outcomes for beverage PET, especially minimum recycled content requirements and recyclability verification. In the European Union, the 25% minimum recycled plastic content requirement for PET beverage bottles (2025) and the 30% threshold (2030) are pushing procurement and compliance programs, while Regulation (EU) 2025/40 (Packaging and Packaging Waste Regulation, PPWR) entered into force on 11 February 2025 and applies from 12 August 2026, tightening packaging design and waste-management obligations across member states.
Implementation is also getting more specific for chemical recycling claims and design evaluation. Commission Implementing Decision (EU) 2026/1425 dated 30 June 2026 sets mass-balance accounting rules for chemically recycled content under the Single-Use Plastics Directive, shaping how brand owners and converters substantiate recycled-content in PET beverage bottles. Parallel harmonization through standards and industry guidance, including CEN EN 18120-4:2026 and EN 18120-10:2026 and protocols used by bodies such as EPBP, Petcore Europe, and RecyClass, is strengthening design-for-recycling expectations for bottles and closures and raising the cost of non-compliant formats.
Value Chain Analysis
The PET beverage packaging value chain starts with upstream feedstocks (PTA and MEG) and polymerization to virgin PET, then moves through preform and bottle manufacturing, closure production, labeling and decoration, and downstream filling by beverage brand owners and co-packers. Scale and integration shape performance: large converters coordinate resin sourcing, high-speed conversion (injection stretch blow molding), and customer qualification, while lightweighting and tethered-cap redesigns increase the need for close collaboration between packaging designers, equipment suppliers, and beverage fillers.
End-of-life collection and recycling are becoming a more consequential midstream loop, connecting deposit-return and collection systems to sortation, washing, and mechanical recycling into food-grade rPET, with chemical recycling pathways taking on more relevance where contamination limits mechanical yields. In Europe, organizations such as Petcore Europe, the European PET Bottle Platform (EPBP), and RecyClass influence specifications and testing approaches that support design-for-recycling and help protect clear and light-blue PET stream purity. The EU's move to formalize mass-balance accounting for chemically recycled content (Implementing Decision (EU) 2026/1425) extends verification requirements through the chain, from recycler outputs to converter documentation and brand-owner claims on pack.
Competitive Landscape
Industry concentration is moderate and moving upward. Amcor’s USD 8.43 billion all-stock merger with Berry Global created a USD 24 billion packaging leader targeting USD 650 million synergy capture. The enlarged scale secures resin procurement discounts and funds technology such as molecular recycling. Silgan’s EUR 838 million (USD 907 million) takeover of Weener Packaging strengthens its closures portfolio, a high-margin segment poised for tethered-cap driven expansion.
Technological moats grow in importance. Origin Materials commercialised fully recyclable PET caps in early 2025, giving bottlers a mono-material solution that simplifies sorting and avoids HDPE contamination. Indorama’s bio-based PET launch ties renewable feedstock to strong brand sustainability narratives. Regional players such as ALPLA, Plastipak and Resilux defend share through proximity to customers, multi-continent plant footprints and agile custom-moulding services.
Strategic moves focus on recycling integration, lightweighting IP and geographic expansion. Companies announce joint ventures with chemical recyclers, sign multi-year offtake with rPET suppliers and retrofit lines for tethered cap production. Smaller converters specialise in short-run, design-heavy bottles serving craft brands, maintaining relevance in a consolidating polyethylene terephthalate (PET) beverage packaging market.
Polyethylene Terephthalate (PET) Beverage Packaging Industry Leaders
Resilux NV
Nampak Ltd
Amcor plc
Berry Global Group Inc.
Silgan Holdings Inc.
- *Disclaimer: Major Players sorted in no particular order
Polyethylene Terephthalate (PET) Beverage Packaging Market Companies Covered in this Report
- Amcor plc
- ALPLA Group
- Berry Global Group Inc.
- Plastipak Holdings Inc.
- Silgan Holdings Inc.
- Resilux NV
- Graham Packaging Company L.P.
- Nampak Ltd
- Retal Industries Ltd
- Indorama Ventures PCL
- Alpek, S.A.B. de C.V.
- Visy Industries Holdings Pty Ltd
- Sidel Group
- KHS GmbH
- Pactiv Evergreen Inc.
- CKS Packaging Inc.
- Altium Packaging LLC
- Esterform Packaging Ltd
- PET Power B.V.
- Zhejiang Zhongsu Packaging Materials Co., Ltd.

Market Opportunities and Future Outlook
A key opportunity is scaling verified, food-grade recycled-content solutions along with the systems to document them, as mandates are already binding and verification requirements are tightening. In the EU, recycled-content targets and the 30 June 2026 Implementing Decision (EU) 2026/1425 on mass-balance accounting for chemically recycled content are increasing demand for traceable rPET and certified chain-of-custody, creating scope for converters and recyclers that can supply audited data packages alongside resin and packaging volumes.
Another opportunity is mono-material and reuse-ready packaging redesign that reduces sorting losses and aligns with reuse and deposit-return programs. Industry design protocols used across Europe (CEN EN 18120-4:2026 and EN 18120-10:2026, along with guidance from EPBP and RecyClass) reinforce demand for bottle and closure formats that complete recyclability evaluation without undermining line performance. On the supply side, consolidation and integration efforts such as Amcor's combination with Berry Global (completed April 2025) provide a route to fund tooling changes, harmonize specifications across regions, and expand portfolios that address tethered caps, durable closures, and lightweight multi-liter handling features aligned with reuse and DRS operations.
Recent Industry Developments in Polyethylene Terephthalate (PET) Beverage Packaging Market
- April 2026: Amcor plc. The Q1 2026 earnings transcript shows USD 38 million in merger synergies, and the company remains on track for at least USD 260 million in total synergies for 2026 following its Berry Global acquisition. The ongoing integration supports stronger procurement efficiencies and expanded cross selling across PET packaging platforms.
- April 2026: Amcor plc. The company announced agreements to sell two noncore businesses for approximately USD 100 million as part of ongoing integration. These divestitures refocus the portfolio on core PET packaging businesses and streamline operations to accelerate synergy realization and R and D efforts in PET packaging.
- April 2026: Amcor plc. In its Q1 2026 earnings transcript, Amcor reported achieving USD 38 million in merger synergies during the quarter and confirmed it is on track to deliver at least USD 260 million in total synergy benefits for the 2026 fiscal year following its April 2025 acquisition of Berry Global Group. The result highlights scale benefits from the merger and reinforces Amcor's position in the global PET beverage packaging market.


Polyethylene Terephthalate (PET) Beverage Packaging Market Report Scope and Research Methodology
Market Definition and Coverage
This market covers packaging made from polyethylene terephthalate (PET) that is used to contain and sell beverages, measured as the value of PET beverage packaging supplied across key beverage end uses and geographies.
Scope exclusions: It excludes non-PET beverage packs such as glass, metal, paper-based cartons, and non-beverage PET applications like food trays, thermoforms, and films.
Segments Covered in This Report
- By Product Type
- Bottles
- Preforms
- Jars
- Lids/Caps and Closures
- Other Products
- By Capacity (Fill Volume) Type
- ≤ 250 ml
- 251 – 500 ml
- 501 – 1,000 ml
- 1,001 – 2,000 ml
- > 2,000 ml
- By Material Type
- Virgin PET
- Recycled PET (rPET)
- Bio-based PET
- Other Material Types
- By End-user Industry
- Water Bottles
- Carbonated Drinks
- Juices and Nectars
- Energy and Sports Drinks
- Alcoholic Beverages
- Functional and RTD Beverages
- Other End-user Industries
- By Geography
- North America
- United States
- Canada
- Mexico
- Europe
- France
- Germany
- Italy
- Spain
- United Kingdom
- Russia
- Rest of Europe
- Asia-Pacific
- China
- India
- Japan
- South Korea
- Australia and New Zealand
- Rest of Asia-Pacific
- South America
- Brazil
- Argentina
- Rest of South America
- Middle East
- Saudi Arabia
- UAE
- Turkey
- Rest of Middle East
- Africa
- South Africa
- Nigeria
- Rest of Africa
- North America
Data Sources, Market Sizing, and Validation
Desk Research
Desk research was used to build the base structure of the market model and to set realistic boundary conditions for PET resin, preforms, and bottle conversion. Public sources such as UN Comtrade trade statistics, USITC DataWeb, Eurostat, and OECD industrial and price indicators helped us understand directionality in PET-related trade flows, beverage output signals, and macro headwinds that affect packaging demand.
We also reviewed industry association publications from plastics and recycling bodies, along with government environmental agencies for recycled content rules and deposit return program updates, since these can shift PET bottle choices. To cross-check company exposure and geographic mix, we relied on annual reports, investor presentations, and trusted press coverage. Where public data was too aggregated, we used a paid subscription database selectively for company financials, patent lookups, and shipment-level import and export screening. These sources are not exhaustive, and many other references were used to collect data, validate assumptions, and clarify unclear points during the research.
Primary Interviews and Surveys
Primary work focused on interviews and short surveys with packaging converters, resin and preform ecosystem participants, recyclers, and downstream beverage stakeholders to confirm what is actually being used and paid for in each region. We used these discussions to validate PET packaging intensity by beverage type, typical pack sizes, the pace of recycled PET adoption (including food-grade constraints), and how pricing is handled through contract cycles and spot movements.
Distribution of primary research fieldwork respondents
| Company type | Respondent position | Region |
|---|---|---|
| Top tier: 37% | CXOs: 14% | APAC: 49% |
| Mid tier: 49% | Functional/Unit leaders: 35% | EMEA: 30% |
| Smaller Players: 14% | Managers: 51% | Americas: 21% |
Market-Sizing & Forecasting
Sizing starts from a top-down reconstruction that links beverage packaging demand to beverage consumption and output signals by region, which are then translated into PET packaging shares and value. To keep the steps repeatable, the model is built around a small set of inputs that can be checked every year, and then totals are split into the relevant cuts.
Key inputs used to shape the model include PET resin price direction, recycled PET availability and regulatory pull for recycled content, bottle lightweighting trends that change grams per pack, mix shifts between still drinks and carbonated drinks that influence barrier and format choices, and regional differences in refill or return schemes that affect one-way PET demand. Results are corroborated using selective bottom-up checks such as sampled converter revenue exposure, channel conversations on pack format mix, and simple volume times average selling price calculations where data is available. Gaps are handled through conservative proxying based on similar markets, and then re-tested in interviews.
Forecasting mainly uses scenario analysis supported by simple regression checks, where the main drivers are beverage demand outlook, pricing pass-through expectations, and recycled PET supply constraints. When assumptions move sharply, the forecast path is re-run so that the final curve matches what industry participants describe as feasible under expected policy and cost conditions.
Data Validation & Update Cycle
Outputs are validated through triangulation across independent signals, so the model is not dependent on a single dataset or one interview viewpoint. Variance checks are run at the region level and at the global roll-up, followed by anomaly reviews that look for breaks versus known resin price movements, trade shocks, and beverage production swings.
Before sign-off, a second analyst review is completed to confirm math consistency, currency handling, and that the scope boundary is applied the same way across geographies. The report is refreshed annually, and interim updates are triggered when a material event occurs such as a major regulation change, a sharp resin price shift, or a step-change in recycled PET supply. Right before delivery, we do a fresh pass to ensure the latest public updates and interview learnings are reflected.
Mordor Intelligence's Pet Beverage Packaging Market Size Measured Against Other Published Estimates
Published market values for PET beverage packaging can vary quite a lot because the boundary is not always set the same way, and because pricing and recycled content assumptions are handled differently across studies. Differences also show up when one estimate is more focused on bottles only, while another estimate blends in preforms, closures, or even broader plastic beverage packs.
By tracking resin price timing, pack-weight changes, and recycled PET penetration updates, Mordor Intelligence keeps the modeled PET beverage packaging value tied to beverage demand signals and then re-checks the total with interview feedback before finalizing it. The gaps usually come from whether recycled content mandates are treated as immediate volume shifts or gradual adoption, how currency conversion timing is selected, and whether aggressive scenarios are reported as the central case.
Benchmark comparison
| Source | Market Size | Gaps in Research Methodology |
|---|---|---|
| Mordor Intelligence | USD 79.62 B (2026) | |
| Global Consultancy A | USD 83.40 B (2026) | This estimate appears to use a broader bill of materials that can implicitly include adjacent PET components beyond primary beverage containers, and it assumes a faster price pass-through in years with resin volatility. |
| Industry Publisher B | USD 75.10 B (2026) | This estimate is consistent with a bottles-only interpretation in some regions and a more conservative uptake path for recycled PET, which reduces value growth when lightweighting is assumed to offset unit volumes. |
The table shows that most of the spread can be explained by scope choices and by how PET pricing and lightweighting are translated into average selling prices over time. When the scope is kept strictly to PET beverage packaging and the key variables are refreshed and re-tested with industry inputs, the final number becomes easier to trace and compare year to year.


Key Questions Answered in the Report
What is the current size of the polyethylene terephthalate (PET) beverage packaging market?
The market is valued at USD 79.62 billion in 2026 and is projected to reach USD 103.68 billion by 2031, growing at a 5.42% CAGR.
Which product segment grows fastest through 2031?
Lids, caps and closures register the quickest 7.76% CAGR, driven by EU tethered-cap rules.
Why is rPET supply so tight?
Recycled content mandates in the EU and India outpace current food-grade rPET output, creating a supply gap that pushes price premiums and sparks investment in chemical recycling.
How does lightweighting benefit beverage brands?
Cutting bottle gram weight lowers resin costs, shrinks logistics emissions and improves profit margins without compromising performance.
Which region offers the highest growth potential?
Asia-Pacific combines the largest 42.63% revenue share with the strongest 6.29% CAGR, thanks to rising incomes and supportive recycling policies.
How are large converters responding to sustainability pressure?
They pursue acquisitions to gain scale, invest in chemical recycling facilities and launch mono-material closures to meet circular economy targets.
Page last updated on:


 Your data is secure and never sold or shared.


