
Market Overview
| Study Period | 2020 - 2031 |
|---|---|
| Forecast Data Period | 2026 - 2031 |
| Base Year Market Size (2025) | USD 510.33 Million |
| Market Size (2026) | USD 531.1 Million |
| Market Size (2031) | USD 648.34 Million |
| Growth Rate (2026 - 2031) | 4.07 % |
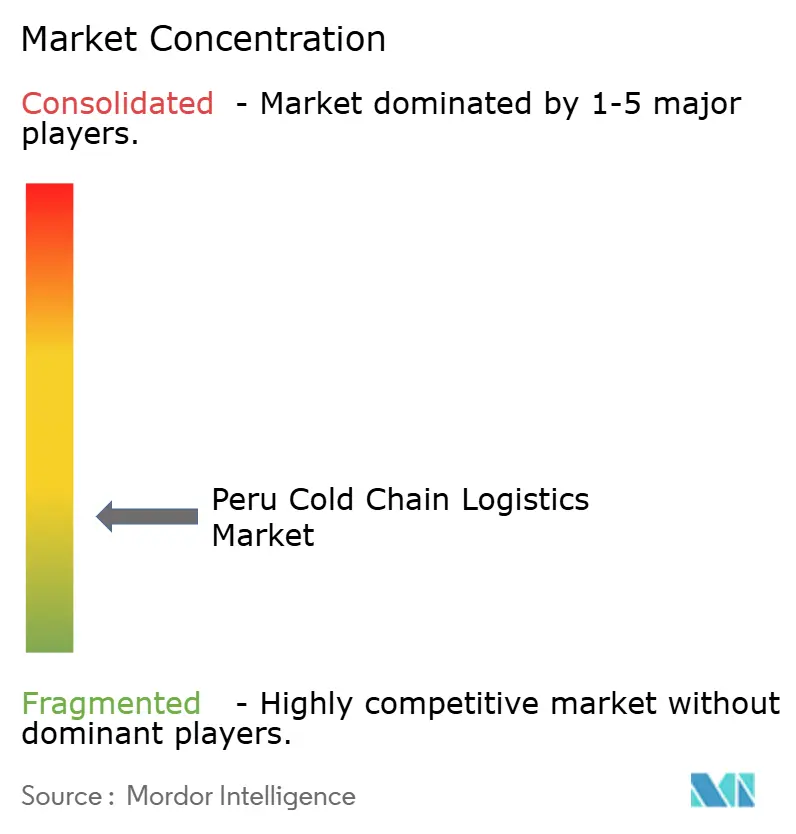
| Market Concentration | Low |
Major Players
*Disclaimer: Major Players sorted in no particular order Image © Mordor Intelligence. Reuse requires attribution under CC BY 4.0. |
|
Peru Cold Chain Logistics Market Analysis by Mordor Intelligence
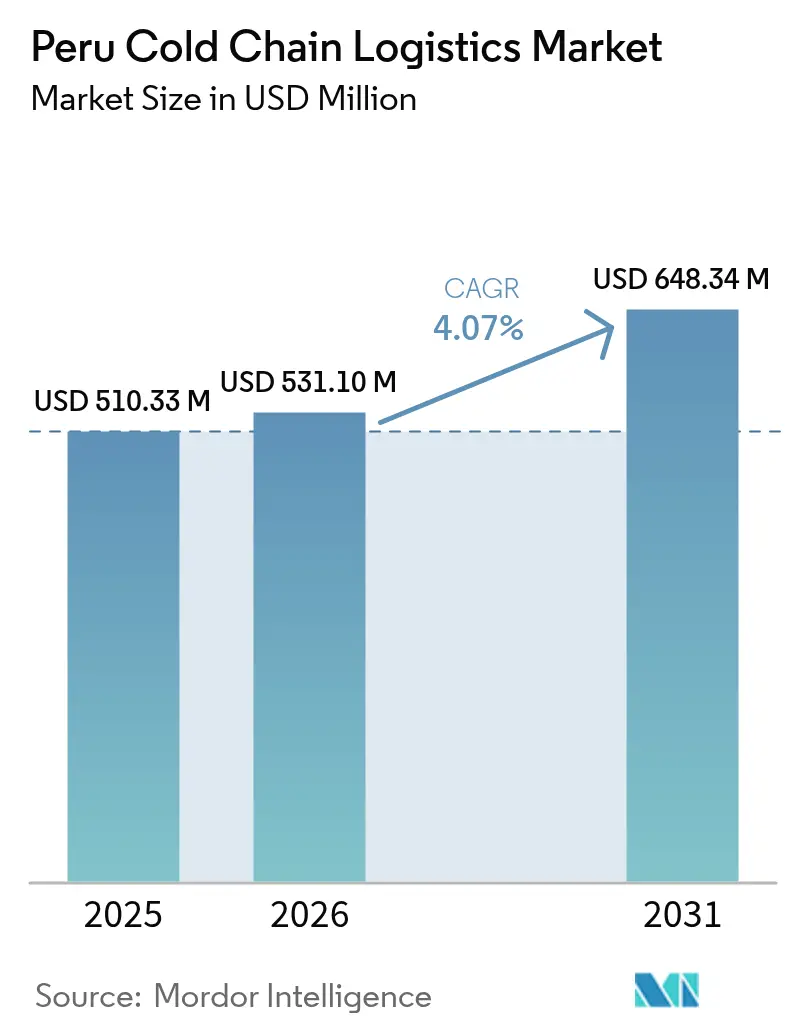
The Peru cold chain logistics market size in 2026 is estimated at USD 531.1 million, growing from 2025 value of USD 510.33 million with 2031 projections showing USD 648.34 million, growing at 4.07% CAGR over 2026-2031. Robust export activity in blueberries, avocados, grapes and seafood keeps utilization rates high across refrigerated storage and transportation assets, while more than USD 1 billion invested in transport corridors during 2024 has lowered average haulage times and reduced temperature-excursion risk. Port upgrades at Callao and the inauguration of Chancay megaport have cut sailing times to major Asian markets by 10 days and trimmed end-to-end logistics costs by over 20%. Digitalization is accelerating as operators deploy IoT sensors, BLE tags and cloud-based analytics to meet increasingly stringent traceability rules in food and pharma supply chains. Competitive intensity is rising because global 3PLs and regional specialists alike view the Peru cold chain logistics market as a natural gateway for South American perishables heading to Asia, Europe and North America.
Key Report Takeaways
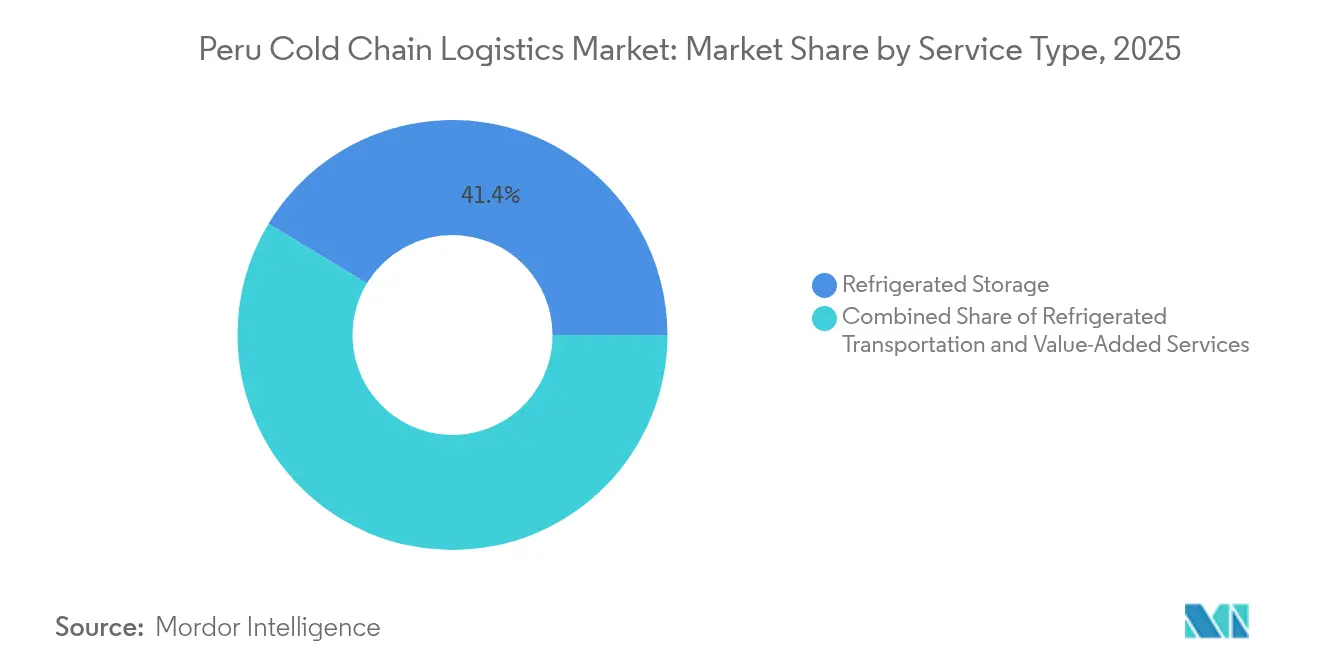
- By service type, Refrigerated Storage led with 41.35% revenue share of the Peru cold chain logistics market in 2025, while Value-Added Services is projected to post the fastest 4.33% CAGR through 2031.
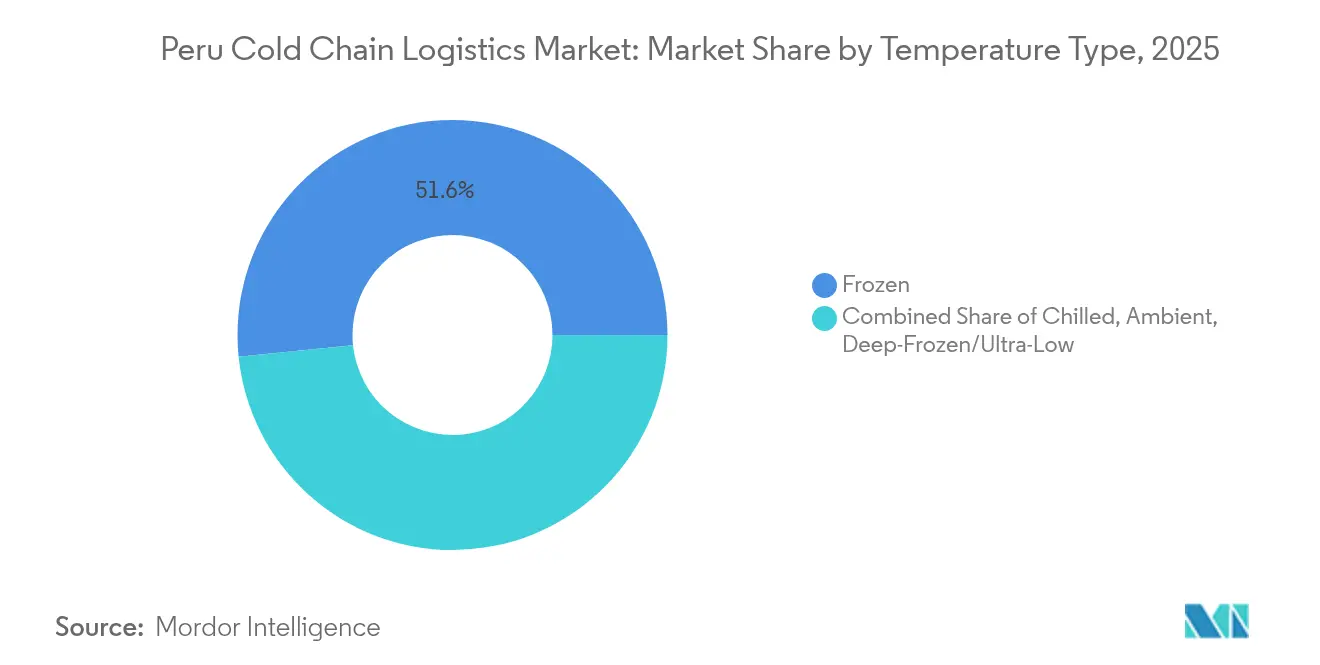
- By temperature type, the Frozen (-18 °C–0 °C) band accounted for 51.62% of Peru cold chain logistics market share in 2025 and is anticipated to expand at a 4.82% CAGR over 2026-2031.
- By application, Fruits & Vegetables held 23.55% share of the Peru cold chain logistics market size in 2025; Ready-to-Eat Meals is set to grow the quickest at a 4.09% CAGR to 2031.
Note: Market size and forecast figures in this report are generated using Mordor Intelligence’s proprietary estimation framework, updated with the latest available data and insights as of 2026.
Peru Cold Chain Logistics Market Trends and Insights
Drivers Impact Analysis*
| Driver | % Impact on CAGR Forecast | Geographic Relevance | Impact Timeline |
|---|---|---|---|
| Export boom in high-value perishables | +1.2% | Lima, Ica, La Libertad | Medium term (2-4 years) |
| Rise of modern retail & e-grocery demand | +0.8% | Lima metro | Short term (≤ 2 years) |
| Infrastructure incentives & port corridor upgrades | +1.0% | Callao-Chancay coast | Long term (≥ 4 years) |
| IoT-enabled refrigeration & monitoring efficiencies | +0.6% | National | Medium term (2-4 years) |
| Biopharma cluster growth | +0.4% | Lima, Arequipa | Long term (≥ 4 years) |
| Climate-driven on-farm cold storage | +0.3% | Coastal desert | Long term (≥ 4 years) |
| Source: Mordor Intelligence | |||


Export boom in high-value perishables drives infrastructure transformation
Blueberry shipments reached 326,000 tons in 2025, giving Peru top global ranking and forcing operators to add pallet positions configured for rapid produce turnover. Counter-seasonal supply programs into the EU and U.S. require vessels with shipboard refrigeration that can hold set-points within ±0.5 °C over 20-day voyages. Avocado exports surged 79.2% in 2024, underscoring the resilience of the Peru cold chain logistics market despite El Nino headwinds. Refrigerated break-bulk services to U.S. East Coast ports cut dwell time versus containerized routes and have slashed spoilage rates below 2%, well under the 4% industry benchmark. Compliance with SENASA and USDA protocols is now a gating factor, so shippers favor third-party logistics partners that offer end-to-end temperature-verified chains of custody. Providers investing in fully automated shuttle systems and high-density mobile racking are grabbing extra throughput capacity ahead of the next expansion wave for the Peru cold chain logistics market[1]"Peru Emerges as a Significant Market for U.S. Agricultural Products." U.S. Department of Agriculture, fas.usda.gov.
Modern retail expansion accelerates last-mile cold chain innovation
Organized grocery chains have announced 300 new outlets annually, and Peru’s e-commerce grocery sales rose 35% in 2023, widening the urban fulfillment footprint. Consumers are willing to pay premiums of 7.1% (chicken), 5.8% (pork) and 5.3% (beef) for certified food-safety attributes, a signal that quality-assured cold logistics can command margin uplift. Same-day delivery specialists deploy AI route-optimization to cut urban drop windows below 90 minutes, which is reshaping warehouse networks toward micro-fulfillment hubs closer to demand centers. Digital-wallet penetration is forecast to hit 28% of in-store payments by 2027, enabling instant proof-of-delivery workflows and real-time temperature records accessible via QR codes. These dynamics favor integrated providers that can combine multi-temperature storage, pick-and-pack, and last-mile fleet services within the Peru cold chain logistics market[2]"Annex 5.1 Specifications for cold treatment and location of sensors in approved self-refrigerated containers according to destination country", NAHSP, gob.pe.
Infrastructure incentives create logistics-corridor advantages
Government-backed spending of USD 1 billion in 2024 plus the USD 1.6 billion Longitudinal de la Sierra highway tender are rewiring freight flows from highland farms toward dual ports at Callao and Chancay. DP World’s USD 400 million berth extension has lifted cold-cargo capacity by 33% and lowered average truck turnaround to 11 hours. The Chancay megaport, majority-owned by Cosco, offers anticipated SEZ tax relief that could shave 4-5 percentage points off operating costs for qualifying 3PLs. Railway spurs totaling 545 kilometers are in feasibility study and would enable reefers to shift from diesel road haulage to electric traction, a potential 28% energy-cost saving at 2024 tariff levels. By reinforcing corridor reliability, these projects underpin the long-run competitiveness of the Peru cold chain logistics market.
IoT integration transforms temperature monitoring and compliance
Multi-SIM cellular gateways now link up to 200 BLE probes per trailer, streaming real-time telemetry at five-minute intervals and automatically generating excursion alerts for dispatch teams. 5G-ready platforms, such as Reefer Runner, apply predictive analytics based on door-open events and ambient forecasts to recommend pre-cool settings that reduce compressor cycles by 12%. Algorithms using customer-segmentation matrices enhance demand forecasts, allowing operators to re-allocate dock slots and labor shifts dynamically in peak harvest weeks. Smart phase-change gel packs and self-cooling labels lengthen passive protection windows so producers can route select SKUs through conventional courier networks without dry ice. Warehouse-as-a-Service models integrate cloud orchestration, robotics and autonomous forklifts, giving customers on-demand pallet positions while letting facility owners monetize unused cubic volume. Early adopters are positioning the Peru cold chain logistics market as a testbed for scalable “cold-chain-as-a-platform” ecosystems.
Restraints Impact Analysis*
| Restraint | % Impact on CAGR Forecast | Geographic Relevance | Impact Timeline |
|---|---|---|---|
| High energy costs & grid unreliability | -0.7% | Industrial zones | Short term (≤ 2 years) |
| Poor road connectivity causing temperature excursions | -0.5% | Andes & jungle corridors | Medium term (2-4 years) |
| Shortage of natural-refrigerant technicians | -0.3% | Urban centers | Long term (≥ 4 years) |
| Volatile reefer freight rates | -0.4% | Export ports | Short term (≤ 2 years) |
| Source: Mordor Intelligence | |||
Energy costs and grid reliability constrain operational efficiency
Electricity output hit 60,728 GWh in 2024, but a 3.3% annual demand rise through 2030 will strain reserve margins and lift spot prices for large-capacity users. Hydro accounts for 51.8% of generation and is vulnerable to drought cycles, raising outage risk during El Nino years. Diesel-backup gensets safeguard temperature integrity yet add 7-9 cents per kWh to effective energy cost, squeezing margins for small warehouses. Battery-energy storage pilot projects in Lima have trimmed grid-peak draws by 15% but high capex slows adoption. Until national-grid reliability improves, the Peru cold chain logistics market will favor operators with capital depth to invest in microgrid solutions or long-term PPAs with renewable developers.
Technical skills gap limits natural-refrigerant adoption
An SNI survey found 63% of industrial firms struggled to recruit qualified technicians in 2024[3]“Top 10 logistics and refrigerated storage providers in LATAM 2024,” ACR Latinoamerica, acrlatinoamerica.com. National training programs cover HFC systems but lag on ammonia, CO₂ and propane curricula, delaying upgrades to low-GWP equipment. Importers face week-long waits for certified commissioning engineers, driving up project costs. Regional initiatives like R-TRADE have trained 1,200 technicians since 2023 yet penetration remains below the 4,000 required by 2027. As environmental rules tighten, a bottleneck in skilled labor could cap modernization speed in the Peru cold chain logistics market.
*Our forecasts treat driver/restraint impacts as directional, not additive. The impact forecasts reflect baseline growth, mix effects, and variable interactions.
Segment Analysis
By Service Type: Storage Infrastructure Dominates Amid Value-Added Growth
Refrigerated Storage controlled 41.35% of Peru cold chain logistics market share in 2025, largely because exporters need multi-week buffering to synchronize harvest windows with vessel departures. Within this segment, private dedicated facilities for large agro-exporters are rising faster than public multi-client stores as producers seek tighter quality control. Value-Added Services, although only 11.62% of 2025 revenue, is forecast to deliver a 4.33% CAGR, fueled by bundled repacking, ripening and labeling requests from North American supermarket chains.
Diversification into packaging design, ethylene-management and in-house customs brokerage lets 3PLs defend margins in a market where base pallet storage rates have fallen 8% since 2023. Road haulage remains the dominant transport mode, yet planned rail connectors to Chancay could divert up to 12% of future reefer volumes. Warehouse-as-a-Service platforms enable customers to book cubic meters on a monthly basis, lowering entry barriers and increasing asset utilization across the Peru cold chain logistics market.


By Temperature Type: Frozen Segment Leads Across Share and Growth
The Frozen band (-18 °C–0 °C) captured 51.62% of the Peru cold chain logistics market in 2025 and is projected to log a 4.82% CAGR to 2031. Growth is anchored in rising exports of IQF mango, passion fruit and diced avocado to European re-processors seeking affordable raw material. Frozen pallet turnover averages 17 days versus 9 days for chilled SKUs, translating into higher fixed-capacity utilization for warehouse operators.
Chilled (0 °C–5 °C) continues to serve fresh blueberries and Hass avocados bound for the EU and U.S., requiring rapid cross-docking at port-centric facilities. Deep-frozen below -20 °C is still niche but strategic, covering biologics, clinical trial supplies and select seafood. Operators with variable-frequency drive compressors and two-stage cascade systems are cutting power consumption by 11%, sharpening competitiveness in the Peru cold chain logistics market.
By Application: Fruits and Vegetables Foundation Supports Ready-to-Eat Innovation
Fruits & Vegetables held 23.55% revenue share of the Peru cold chain logistics market in 2025, reflecting the country’s leadership in counter-seasonal berry, grape and asparagus exports. Export packers demand humidity-controlled rooms to prevent weight loss, pushing warehouse design toward hybrid evaporative-cooling plus mechanical refrigeration.
Ready-to-Eat Meals, although a small base, is forecast to clock the highest 4.09% CAGR, propelled by Lima’s app-based food delivery boom and a youthful demographic seeking convenience. Meal-kit brands are outsourcing pick-and-pack with time-window guarantees under 60 minutes, stimulating investment in urban dark-stores and insulated rider boxes. The expansion into value-added SKUs diversifies revenue streams and fortifies the resilience of the Peru cold chain logistics market.
Geography Analysis
Lima-Callao anchors more than 60% of national cold-storage capacity, owing to proximity to maritime gateways and the densest concentration of modern retail outlets. Port congestion truck queues stretched 12 kilometers in early 2025 has raised the premium for operators with overflow yards and off-dock container chassis pools. The USD 2.4 billion airport expansion adds dedicated pharma coolers and is forecast to lift perishables air-cargo throughput by 25% between 2025-2030.
Northern coastal regions such as La Libertad and Lambayeque are scaling packhouse capacity to service a combined 326,000-ton blueberry pipelines. Irrigation megaprojects will bring another 300,000 hectares online, making these zones hotspots for on-farm precooling clusters. Southern corridors, tied to mining exports, could pivot to agri-food once the USD 7 billion Corio port comes online, offering exporters an alternative to Callao congestion. The Andes spine still lags on road quality; temperature excursions above 5 °C remain common on eight-hour hauls, underlining why the Peru cold chain logistics market is heavily coastal.
Regulatory Landscape
Peru's cold chain compliance framework is split by product type and overseen by multiple authorities: DIGESA (MINSA) for processed foods, SENASA (MIDAGRI) for primary agricultural and livestock products, and SANIPES (PRODUCE) for hydrobiological products. Food safety requirements are anchored in the Food Safety Law framework (Decreto Legislativo No. 1062 and its regulation), while exporters and logistics providers translate this into practice through sanitary and phytosanitary authorizations, facility approvals, and documentary controls tied to specific commodities and destinations.
For export perishables, SENASA procedures and technical annexes define cold chain requirements, including cold treatment protocols and mandatory monitoring through authorized temperature sensors placed in self-refrigerated containers according to destination-country rules (for example, programs used for table grapes, citrus, and blueberries). In healthcare logistics, MINSA approved the updated Health Technical Standard for immunizations cold chain management (NTS No. 242-MINSA/DGIESP-2026) in March 2026, tightening handling, transport, and distribution controls for vaccines across public and private entities and raising the compliance bar for temperature-controlled logistics supporting immunization supply chains.
Value Chain Analysis
The Peru cold chain logistics value chain starts with growers, fisheries, and food manufacturers that need on-farm or plant-level pre-cooling, grading, and packing, then moves to specialized cold storage (public multi-client and private dedicated sites), refrigerated transport (road-dominant, supported by sea and air gateways), and value-added services such as labeling, repacking, ripening management, and customs documentation. Export-forwarding nodes around Lima-Callao and northern agro-export corridors connect to reefer shipping lines and air cargo handlers, where compliance steps like sanitary authorizations and temperature-record continuity influence provider selection and pricing.
Recent investments point to more vertical integration and port-adjacent specialization. Maersk opened a 17,500 square meter integrated packing and cold storage hub in Olmos (Lambayeque) in July 2025 to consolidate fruit export flows. IceStar entered Peru in June 2025 by acquiring Fripusa in Paita (Piura), with an announced plan to expand capacity from 5,500 to 12,000 pallet positions over 24 months. On the regulatory-operational interface, SENASA initiatives enabling cold treatment in ship holds, initiated with phytosanitary certification activities at Paracas in December 2024, create an alternative pathway for exporters when container availability or port constraints tighten. Industry bodies such as Frio Aereo, ASIPAR, and CONUDFI serve as coordination points for standards adoption, training, and export-process alignment across shippers, terminals, and logistics operators.
Competitive Landscape
The market exhibits moderate fragmentation: the top five providers control roughly 55% of pallet positions, led by Emergent Cold’s 157 million ft³ regional network. Ransa is targeting 14% revenue growth in 2025 via bolt-on acquisitions that broaden geographic reach while avoiding risky mega-mergers. DHL Supply Chain invested USD 3.7 million to expand its Huachipa multi-temperature campus, adding dock doors configured for electric-vehicle fleets.
Technology is the new battleground; IoT visibility platforms and cloud-based YMS modules are now standard bid requirements from produce exporters and pharma shippers. Smaller warehouses must either join capacity marketplaces or risk sub-50% utilization during off-season months. Strategic whitespace exists in on-farm storage and in GDP-validated ultra-cold rooms below -80 °C, segments where incumbents are yet to scale. Overall, competition remains disciplined, but service bundling and regional M&A will continue reshaping the Peru cold chain logistics market.
Peru Cold Chain Logistics Industry Leaders
-
Emergent Cold LatAm
-
South Pacific Logistics
-
TIMCO SAC
-
DHL Supply Chain
-
Ransa Comercial
- *Disclaimer: Major Players sorted in no particular order

Market Opportunities and Future Outlook
Export-grade compliance and node-level integration create whitespace for providers that can bundle temperature-controlled infrastructure with certification-ready processes. In agro-exports, SENASA cold treatment and sensor-placement requirements for specific fruits, together with destination-country protocols, increase demand for validated monitoring, auditable chains of custody, and specialized handling at ports and inland consolidation points. The shift toward integrated packing plus cold storage is already reflected in market actions such as Maersk's July 2025 opening of an integrated hub in Olmos (Lambayeque), which supports a service model that reduces handoffs and shortens the time from harvest to export departure.
Healthcare and high-assurance cold chain is another opportunity area, shaped by policy updates and equipment deployment. MINSA's March 2026 approval of the updated immunizations cold chain technical standard (NTS No. 242-MINSA/DGIESP-2026) raises operational requirements for vaccine conservation and distribution across public and private entities, favoring logistics operators that can document temperature control end-to-end and manage qualified equipment at each tier. Supply chain security and facilitation programs such as SUNAT's OEA (Operador Economico Autorizado) also create differentiation potential for logistics companies through reduced customs friction and increased shipper confidence on time- and temperature-sensitive export lanes.
Recent Industry Developments
- June 2026: Emergent Cold LatAm communicated a Peru strategy centered on organic expansion after integrating Frialsa Peru, with attention on adding capacity in northern production regions such as Piura. The stance signaled disciplined capital deployment and put emphasis on scaling existing networks and service performance rather than near-term acquisitions, influencing competitive behavior in multi-client cold storage.
- July 2025: Maersk opened a 17,500 square meter integrated packing and cold storage hub in Olmos (Lambayeque) to support exports of avocados, blueberries, and mangoes. The facility added upstream consolidation and value-added handling closer to farms, tightening control over quality and transit times for high-value perishables.
- July 2024: Emergent Cold LatAm inaugurated a modern cold warehouse in Callao with around 79,000 cubic meters of volume and about 12,000 pallet positions. The added capacity strengthened port-centric storage and cross-docking capability, supporting exporters that prioritize fast vessel connections and temperature-verified custody near Peru's main maritime gateway.


Research Methodology Framework and Report Scope
Market Definition and Coverage
For this study, the market covers paid services that move or store temperature-sensitive goods in Peru under controlled conditions, mainly refrigerated transportation and temperature-controlled warehousing, along with common value-added handling linked to cold storage operations.
Scope exclusions: We exclude in-house cold rooms used only inside production sites or retail stores, and we also exclude standard dry logistics that does not maintain a controlled temperature.
Segmentation Overview
-
By Service Type
-
Refrigerated Storage
- Public Warehousing
- Private Warehousing
-
Refrigerated Transportation
- Road
- Rail
- Sea
- Air
- Value-Added Services
-
Refrigerated Storage
-
By Temperature Type
- Chilled (0-5 °C)
- Frozen (-18-0 °C)
- Ambient
- Deep-Frozen / Ultra-Low (less than-20 °C)
-
By Application
- Fruits and Vegetables
- Meat and Poultry
- Fish and Seafood
- Dairy and Frozen Desserts
- Bakery and Confectionery
- Ready-to-Eat Meals
- Pharmaceuticals and Biologics
- Vaccines and Clinical Trial Materials
- Chemicals and Specialty Materials
- Other Applications
Data Sources, Market Sizing, and Validation
Desk Research
Desk work started with mapping Peru's cold chain demand base and the physical supply network that enables it, and then turning those signals into inputs that can be checked year to year. We reviewed public trade and food system indicators that explain how much perishable product needs controlled handling, and then matched this with visible logistics capacity and utilization cues.
Common sources used include official Peru trade statistics and customs releases, FAO agri-food datasets, World Bank macro and trade indicators, and the UN Comtrade database for product flows, along with publications from cold chain and logistics associations where available. We also used company annual reports, investor presentations, and reputable local press to track facility expansions, route additions, and service mix changes. Where needed, we referenced paid subscriptions focused on company financials and intelligence, plus shipment-level import and export datasets to sanity-check activity levels around key perishable categories. These examples are not exhaustive, and many other public and proprietary sources were used to collect data, validate assumptions, and clarify open questions.
Primary Interviews and Surveys
We speak with Peru-based cold-storage operators, refrigerated transport providers, exporters, food distributors, pharmaceutical logistics specialists, and procurement managers. Their input helps test utilization, tariffs, route costs, service coverage, and gaps in operator data within Peru. We then triangulate these responses with desk research and adjust the relevant assumptions before finalizing the results.
Distribution of primary research fieldwork respondents
| Company type | Respondent position |
|---|---|
| Top tier: 30% | CXOs: 15% |
| Mid tier: 50% | Functional/Unit leaders: 35% |
| Smaller Players: 20% | Managers: 50% |
Market-Sizing & Forecasting
The model is built around a top-down demand reconstruction, where Peru's perishable production and trade flows are converted into a temperature-controlled handling requirement and then allocated across transport and warehousing services. To keep the totals realistic, we corroborated results with selective bottom-up approximations, including a sampled set of cold storage capacity additions, observed utilization ranges, and a simple ASP times volume check for major corridors.
Key inputs included perishables export and import trends, cold storage capacity announcements and commissioning timelines, typical warehouse utilization bands, refrigerated transport fleet availability by mode, and average service price progression (storage per pallet position per day and transport per trip equivalents). Where gaps appeared, assumptions were filled using closest observable proxies, such as category-level trade volumes and known peak-season behavior for seafood and fresh produce, and then they were re-checked in interviews.
For forecasting, we mainly used scenario analysis anchored on macro demand drivers and infrastructure ramp-up timing, since expansions can arrive in steps rather than smoothly. The scenarios were tuned with expert views on capacity ramp, energy cost pressure, compliance requirements, and how quickly shippers shift from ambient to controlled services.
Data Validation & Update Cycle
Validation was done by triangulating the modeled values against independent signals such as perishable trade momentum, announced cold storage capacity, and visible network changes in key logistics corridors. Outliers were flagged when the implied utilization or implied pricing moved outside reasonable bands, and then the model was revisited until the drivers made practical sense.
Before sign-off, the numbers go through multi-step analyst reviews that compare year-on-year movements with known events like new facility openings, regulatory shifts, and disruptions in the supply chain. Reports are refreshed annually, and interim updates are made when a material event changes demand or capacity. Right before delivery, we do a fresh pass so clients receive the latest updated view rather than an older snapshot.
Mordor Intelligence's Peru Cold Chain Logistics Market Size Compared Against Other Published Estimates
Published market sizes for Peru cold chain logistics often differ because studies do not always count the same services, and they also apply different price and utilization assumptions for storage and transport. Timing can also change the current-year value, since newer capacity additions and demand swings can shift near-term performance more than expected.
By tracking service-type splits and refreshing pricing and utilization checks each year, Mordor Intelligence keeps the Peru total tied to refrigerated warehousing plus temperature-controlled transportation, while avoiding adjacent categories like dry logistics that can inflate the value.
Benchmark comparison
| Source | Market Size | Gaps in Research Methodology |
|---|---|---|
| Mordor Intelligence | USD 510.33 M (2025) | |
| Industry Publisher A | USD 134.63 M (2025) | This estimate appears to apply a narrower value pool, which may undercount transport activity or exclude common value-added cold handling, thereby pulling the total down versus a full cold chain services view. |
| Trade Journal B | USD 510.00 M (2025) | This number is described in the context of cold storage warehouses, so it likely reflects storage-only revenue or throughput rather than end-to-end cold chain logistics, which can shift the interpretation even if the headline value looks similar. |
Taken together, the spread mainly comes from what is counted as part of the market, and whether transport services and value-added handling are included alongside storage. Using clear service boundaries and repeatable checks on demand signals, capacity, utilization, and price movement helps keep the final number traceable and easier to reconcile across updates.


Key Questions Answered in the Report
How fast is the Peru cold chain logistics market expected to grow between 2026 and 2031?
It is projected to rise from USD 531.1 million to USD 648.34 million at a 4.07% CAGR.
Which service type holds the largest revenue share today?
Refrigerated Storage leads with 41.35% of 2025 revenue.
What segment is witnessing the fastest expansion in temperature bands?
The Frozen range (-18 °C–0 °C) is forecast to log a 4.82% CAGR through 2031.
How are infrastructure projects influencing cold chain competitiveness?
Port and highway upgrades have cut transit times and slashed logistics costs by over 20%, boosting service reliability.
What restrains faster modernization of cold-storage facilities?
High energy costs, grid unreliability and a shortage of technicians trained on natural refrigerants slow equipment upgrades.
Page last updated on:


 Your data is secure and never sold or shared.


