
Personal Robots Market Size and Share
Market Overview
| Study Period | 2020 - 2031 |
|---|---|
| Market Size (2026) | USD 39.21 Billion |
| Market Size (2031) | USD 77.35 Billion |
| Growth Rate (2026 - 2031) | 14.57 % |
| Fastest Growing Market | Asia Pacific |
| Largest Market | North America |
| Market Concentration | Medium |
Major Players.webp) *Disclaimer: Major Players sorted in no particular order Image © Mordor Intelligence. Reuse requires attribution under CC BY 4.0. | |
Personal Robots Market Analysis by Mordor Intelligence
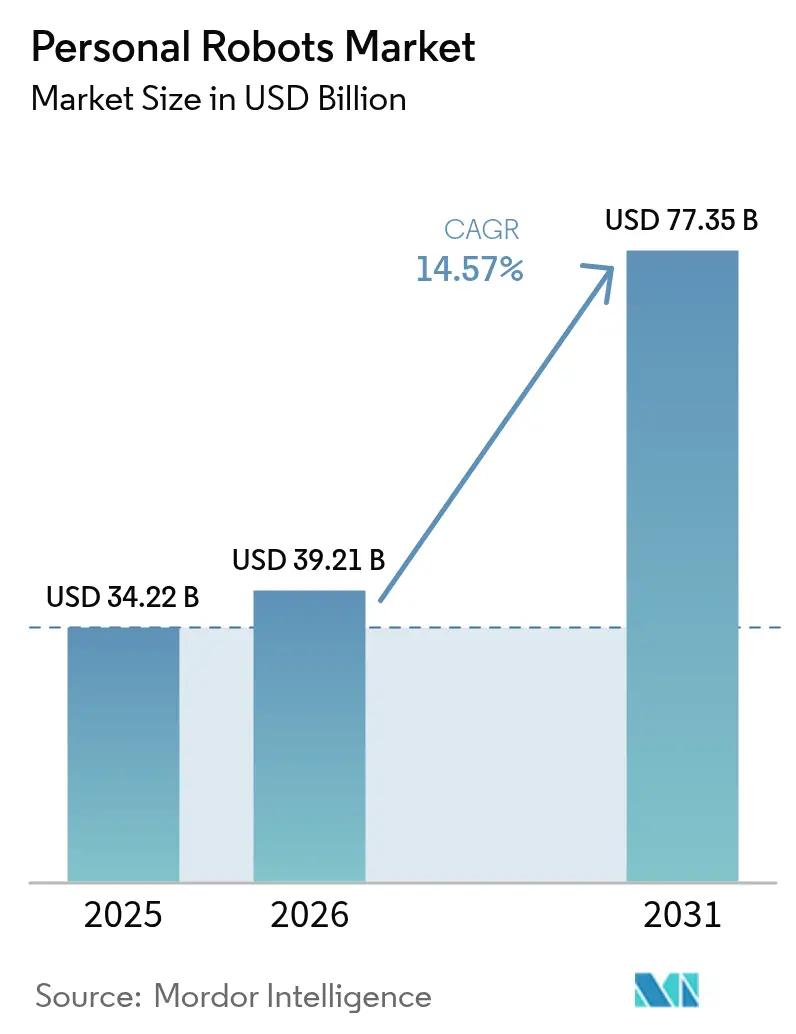
The personal robots market size was valued at USD 34.22 billion in 2025 and estimated to grow from USD 39.21 billion in 2026 to reach USD 77.35 billion by 2031, at a CAGR of 14.57% during the forecast period (2026-2031). Growth rides on three converging forces: affordable on-device AI, aging societies that need care assistance, and navigation software that lets robots move safely around cluttered homes. Vacuum cleaners remain the primary revenue engine, proving that consumers trust autonomous devices and are willing to let them roam freely. Asian manufacturers dominate component supply, giving the region cost advantages that accelerate global adoption. Meanwhile, cloud-based software and subscription add-ons have begun to reshape revenue models, turning one-time hardware sales into recurring income streams.
Key Report Takeaways
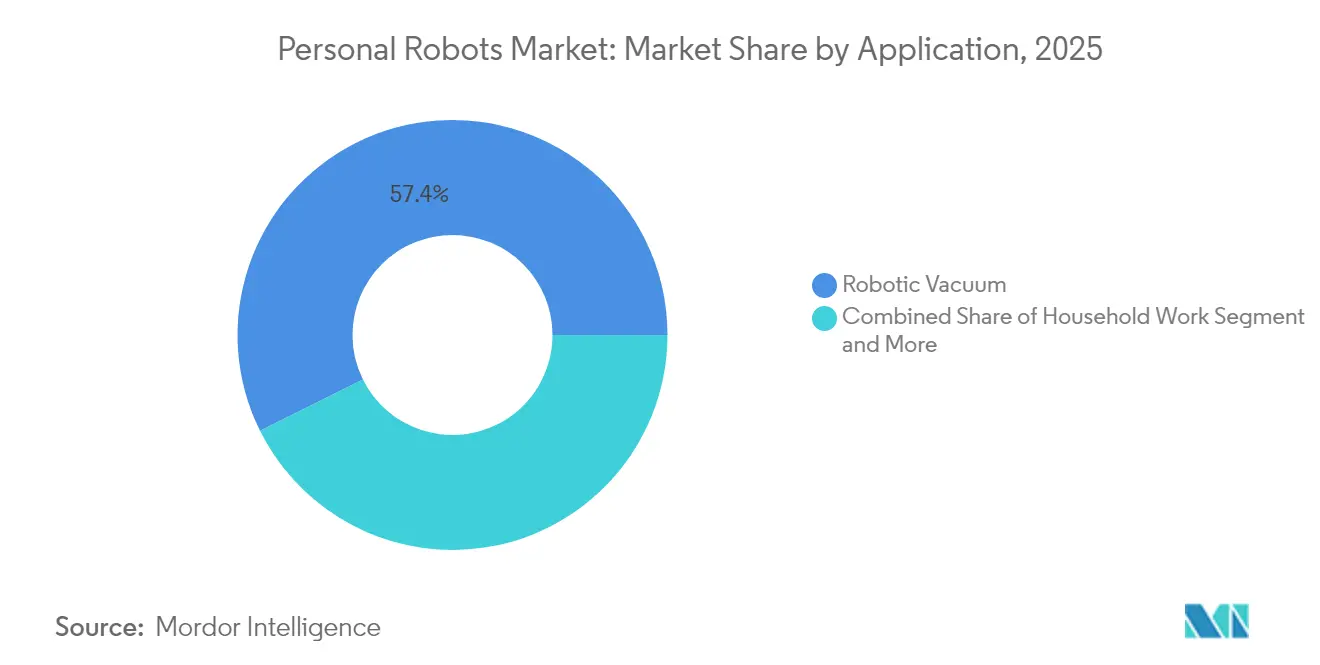
- By application, household work still commanded 57.35% of the personal robots market share in 2025, but elderly & handicap assistance is forecast to post the fastest 23.2% CAGR to 2031.
- By mobility, mobile wheeled designs held 66.20% revenue share in 2025; humanoid bipedal systems are poised for the quickest 28.4% CAGR through 2031.
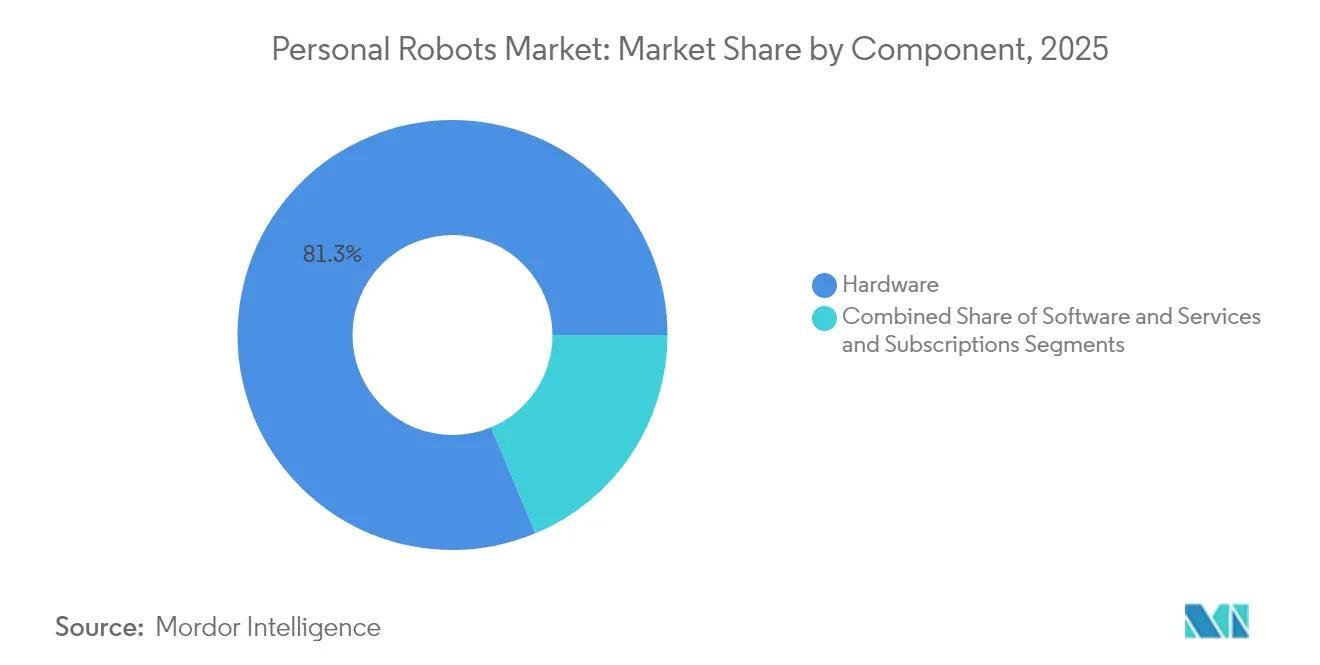
- By component, hardware accounted for 81.30% of the personal robots market size in 2025, while services and subscriptions are expanding at 21.6% CAGR.
- By control interface, app-controlled units led with 43.40% share in 2025, yet fully autonomous robots are accelerating at 26.9% CAGR.
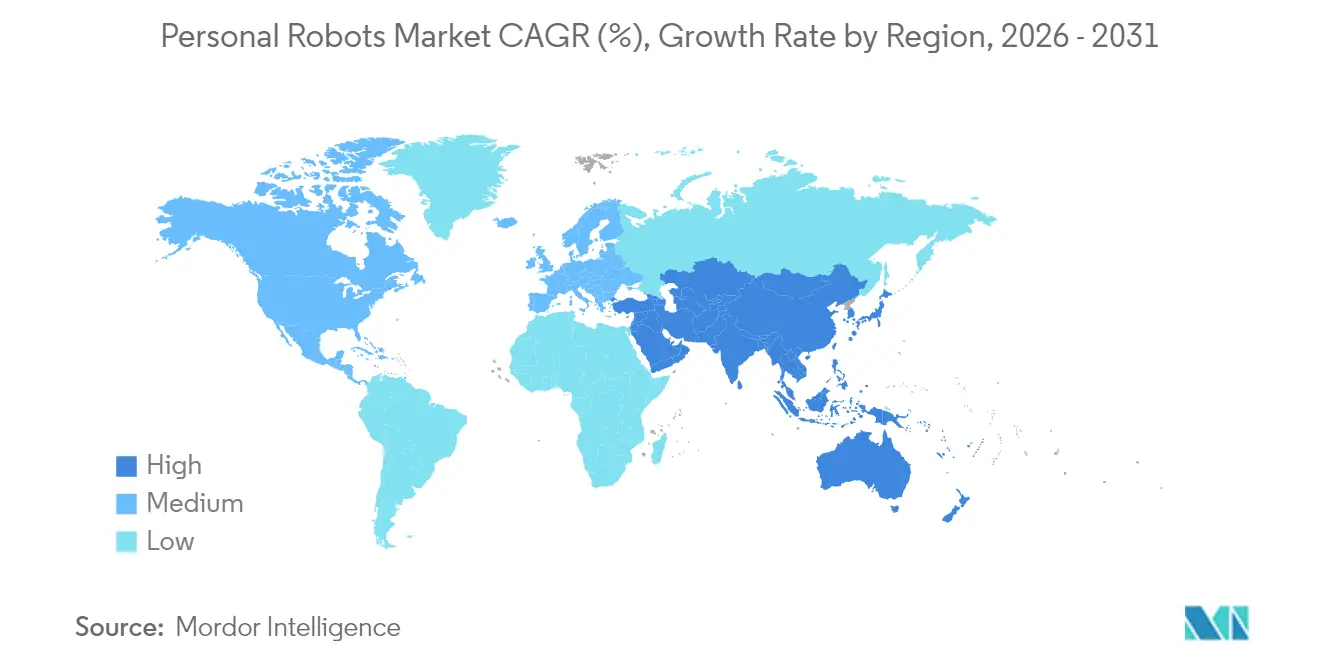
- By geography, Asia-Pacific secured 34.60% revenue share in 2025; the Middle East is the fastest-growing region with a 19.1% CAGR out to 2031.
- Ecovacs, Roborock and iRobot together captured nearly one-third of 2024 shipments, yet iRobot’s Q4 2024 revenue fell 45%, signaling intensifying price pressure.
Note: Market size and forecast figures in this report are generated using Mordor Intelligence’s proprietary estimation framework, updated with the latest available data and insights as of 2026.
Market Trends and Insights
Drivers Impact Analysis of Personal Robots Market*
| DRIVER | (~) % IMPACT ON CAGR FORECAST | GEOGRAPHIC RELEVANCE | IMPACT TIMELINE |
|---|---|---|---|
| Boom in household robotic vacuum adoption | 3.2% | Global, with strongest penetration in North America and Europe | Short term (≤ 2 years) |
| Increased availability of low-cost AI processors | 2.8% | APAC core manufacturing, spill-over to global markets | Medium term (2-4 years) |
| Integration with smart-home ecosystems | 2.1% | North America and EU leading, expanding to APAC urban centers | Medium term (2-4 years) |
| Ageing-in-place initiatives in OECD countries | 3.5% | OECD countries, with early gains in Japan, Germany, South Korea | Long term (≥ 4 years) |
| Hospital pilot programs for in-room delivery | 1.4% | North America and EU healthcare systems | Medium term (2-4 years) |
| Open-source ROS-based platforms lowering entry barriers | 1.8% | Global, with concentration in tech hubs | Short term (≤ 2 years) |
| Source: Mordor Intelligence | |||
Boom in Household Robotic Vacuum Adoption
Robotic vacuums normalized the very idea of letting an autonomous device roam inside private spaces, lowering psychological and technical barriers for more complex helpers. Chinese vendors scaled production and undercut prices, pushing iRobot into a 45% revenue slide in Q4 2024 while Ecovacs logged RMB 16.54 billion in sales[1]Dyson, “Dyson 360 Vis Nav robot vacuum cleaner,” dyson.com and Roborock RMB 11.95 billion in the same year. Premium players kept margins by touting performance; Dyson’s 360 Vis Nav model ships with six-times competitor suction at a USD 799.99 price, proving that high-spec niches can coexist with mass adoption.
Increased Availability of Low-Cost AI Processors
Specialized chips from Qualcomm and NVIDIA are halving core component costs, trimming a humanoid bill-of-materials from USD 35,000 in 2025 to as low as USD 13,000 by 2030-35.[2]Bank of America Institute, “Transformation: Humanoid Robots 101,” institute.bankofamerica.com The new economics let startups like Figure AI move domestic pilots up by two years, while China’s UBTech readies mass production for Walker S2 units in late 2025.
Integration with Smart-Home Ecosystems
Robots now serve as mobile nodes in a multi-device household. Amazon’s million-robot milestone and Samsung’s USD 180 million stake in Rainbow Robotics show that big-tech is racing to fold robots into existing IoT frameworks. SwitchBot’s K20 Plus Pro can convert from vacuum to air purifier or delivery cart using modular add-ons,[3]SwitchBot, “K20 Plus Pro Modular Robot,” switch-bot.com underscoring a shift from hardware specs to seamless ecosystem performance.
Ageing-in-Place Initiatives in OECD Countries
Governments face shrinking caregiver pools and soaring medical bills. Japan’s METI and AMED fund pilot deployments, while research indicates hospital falls alone cost USD 50 billion each year—an expense that preventive robotics can meaningfully cut. Field studies in Australian nursing homes confirm that staff accept robots once training and workflow changes are in place.
Restraints Impact Analysis of Personal Robots Market*
| RESTRAINTS | (~) % IMPACT ON CAGR FORECAST | GEOGRAPHIC RELEVANCE | IMPACT TIMELINE |
|---|---|---|---|
| Data-privacy concerns around home mapping | -2.3% | EU and North America regulatory environments | Short term (≤ 2 years) |
| High replacement cost of batteries and sensors | -1.8% | Global, with higher impact in price-sensitive markets | Medium term (2-4 years) |
| Fragmented global safety standards | -1.5% | Global, with regional compliance variations | Long term (≥ 4 years) |
| Limited SLAM accuracy in cluttered Asian apartments | -0.9% | APAC urban centers, particularly dense housing markets | Medium term (2-4 years) |
| Source: Mordor Intelligence | |||
Data-Privacy Concerns Around Home Mapping
Strict regimes such as GDPR require explicit consent for the maps and behavioral data robots collect. A January 2025 YouGov poll found privacy ranked as the top barrier for 48% of Americans considering a household robot, just ahead of reliability worries at 49%. Firms now spend heavily on on-device processing, data localization and user-controlled sharing to satisfy regulators.
High Replacement Cost of Batteries and Sensors
Consumables can equal 20-40% of a unit’s lifetime cost. Lithium-ion packs run USD 200-800 and LiDAR sensors USD 1,000-3,000, forcing owners into expensive mid-life overhauls. Annual upkeep typically adds 5-12% of purchase price, driving suppliers toward modular designs and predictive maintenance to soften sticker shock—yet those measures raise initial R&D spend.
*Our forecasts treat driver/restraint impacts as directional, not additive. The impact forecasts reflect baseline growth, mix effects, and variable interactions.
Personal Robots Market Segment Analysis
By Application:
Cleaning Dominance Yields to Care InnovationHousehold work robots generated the largest slice of 57.35% in the personal robots market in 2025. Vacuum cleaners deliver clear time savings and predictable outcomes, sustaining user trust and high repeat-buy intent. Entertainment robots such as Mixi’s CES-winning Romi have broadened category visibility. Meanwhile, elderly & handicap assistance is scaling fastest at a 23.2% CAGR as hospitals pilot in-room delivery and families seek reliable toileting, medication and fall-alert support.
The revenue shift illustrates a maturing category moving from convenience to necessity. As unit tasks diversify, subscription software for mapping, AI upgrades and diagnostics further expands the personal robots market size for service providers.


By Mobility:
Wheeled Systems Bridge to a Bipedal FutureIn 2025, mobile wheeled designs captured 66.20% of total value thanks to efficient power draw and affordable parts. Stationary models remain niche, focused on security or local telepresence.
Humanoid bipedal forms are the growth story, climbing at 28.4% CAGR through 2031. Figure AI’s USD 2.6 billion valuation and Genesis AI’s USD 105 million seed round highlight investor belief that bipedal machines will navigate human-built spaces with minimal modification, ultimately lifting the personal robots market share for bipedal systems as balance control and AI reasoning mature.
By Component:
Hardware Foundation Enables Software InnovationHardware still owned 81.30% of 2025 outlays, reflecting the capital intensity of motors, sensors and frames. Falling sensor prices and AI chips have expanded addressable use-cases, yet safety, styling and tactile requirements keep BOMs high.
Services and subscriptions—mapping, firmware, cloud AI, remote diagnostics—are rising at 21.6% CAGR. Recurring packages lengthen product life, create stickier brands and incrementally grow the personal robots market size without large new hardware investments.
By Control Interface:
Autonomy Advances Despite App DominanceApp-centric control led with 43.40% in 2025, leveraging familiar smartphone UX patterns. Voice interfaces surged once Alexa and Google Assistant enabled plug-and-play skill integration.
Full autonomy now records the fastest 26.9% CAGR. Multi-modal perception and large language models let robots interpret casual requests, a prerequisite for elderly care where users may lack technical fluency. Toyota’s alliance with Hyundai’s Boston Dynamics to apply generative AI shows manufacturers converging on hands-free operation.
Geography Analysis
APAC Personal Robots Market
Asia-Pacific held 34.60% of 2025 revenue, buoyed by China’s component scale and Japan’s elderly-care pilots. China’s humanoid robot market hit USD 2.9 billion in 2024 and is projected to soar past USD 46 billion by 2031 at a 48.6% CAGR, dwarfing global growth rates. Government subsidies, mature supply chains and cultural comfort with robotics sustain leadership. South Korea’s 5G infrastructure supports vision-heavy applications, while India’s urban middle class presents long-run volume upside once price points fall.
North America Personal Robots Market
North America remains influential in AI research, venture funding and premium tiers. The United States recorded USD 0.56 billion in humanoid robot sales in 2024, and the region holds 47.5% of global humanoid revenue today. Interest levels are healthy—38% of Americans like the idea of a household robot—but 32% still cap their budget below USD 500, evidence of elasticity challenges that vendors must address through feature bundling or financing plans.
Middle East Personal Robots Market
The Middle East is the fastest-growing region at 19.1% CAGR through 2031. Oil-funded diversification programs, retail expansion to USD 386.9 billion by 2028 and young tech-forward populations underpin demand. UAE and Saudi Arabia have carved out robotics test zones, while Israel’s startup ecosystem supplies AI talent. Turkey’s USD 20 billion home robotics spend in 2024 confirms appetite across non-Gulf economies, reinforcing the region’s role as an early target for premium and service-rich offerings.

Regulatory Landscape
Personal robots face a dual compliance burden that blends product safety rules with emerging AI governance, with notable focus in the EU and the United States. In Europe, the Machinery Regulation (EU) 2023/1230 becomes mandatory from January 20, 2027, and it explicitly addresses AI-enabled safety functions and cyber-safety for machinery placed on the market. This affects how vendors engineer safety-related control, software update pathways, and security-by-design for connected home robots.
Standardization is also tightening around household-use performance and human-robot interaction. EN IEC 62849:2026 (published January 16, 2026) adds performance evaluation methods for robots for household and similar use, supporting more consistent benchmarking and procurement requirements. In the United States, the Consumer Product Safety Commission (CPSC) has increased attention on robotics-related consumer hazards, including an April 2025 staff recommendation to ASTM F15.22 to develop safety requirements for robotic toys, pointing to higher expectations for robots with physical interaction capabilities in consumer environments.
Value Chain Analysis
The personal robots value chain runs from component suppliers (sensors, motors, actuators, batteries, and compute/AI chips) to subsystem integration (navigation stacks, control electronics, and safety software), followed by OEM assembly and downstream channels such as e-commerce, electronics retail, and direct-to-consumer. Post-sale revenue is increasingly tied to services and subscriptions, including mapping updates, diagnostics, and feature unlocks. Asia-Pacific stays central to cost and availability because a large share of key parts are produced and integrated in the region, reinforcing the report observation that Asian manufacturers dominate component supply and influence global pricing.
As robots broaden from single-task cleaners to more capable mobile and humanoid platforms, scaling depends on specialist component bottlenecks and the manufacturing partners that can remove them. Upstream activities are crowded with component and technology suppliers, while finished-goods OEMs are fewer. Critical mechanical elements such as precision reducers and gearboxes often operate as limiting nodes for higher-DOF robots. To move from prototypes into larger-volume builds, sourcing increasingly shifts toward multi-region, ISO-certified supply bases and contract manufacturers that can handle electromechanical assembly and quality systems, while OEM differentiation centers on software, autonomy, and ecosystem integrations that can be monetized as recurring services.
Competitive Landscape
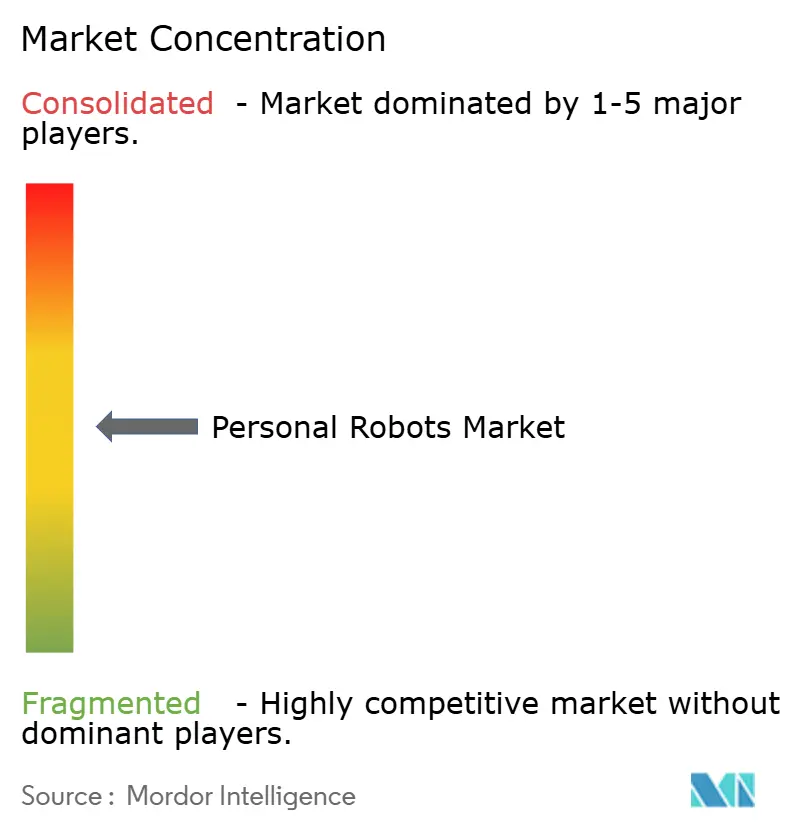
Market structure is moderately fragmented: the top five vendors control just under 50% of shipments. iRobot’s steep 45% Q4 2024 revenue slide revealed how quickly share can swing when lower-cost rivals match feature sets. Ecovacs and Roborock leveraged RMB-scale supply chains to grow 2024 sales to RMB 16.54 billion and RMB 11.95 billion respectively. Samsung secured a USD 180 million position in Rainbow Robotics, an indicator that consumer-electronics giants prefer acquisition over ground-up R&D.
Strategy falls into three lanes. First, premium performance illustrated by Dyson’s 360 Vis Nav that uses six-times competitor suction. Second, ecosystem integration typified by Amazon’s Astro tying into Ring security and Alexa voice. Third, cost leadership, dominated by Chinese firms iterating at lightning pace.
Emerging white-space is visible in logistics and healthcare. GXO Logistics inked a multi-year contract with Agility Robotics for warehouse bipedals, the first sizeable commercial rollout. Software is the new frontier: Figure AI’s valuation hinges on its Helix AI model, not on actuators, while Apptronik teams with Google DeepMind to fuse Gemini reasoning into its Apollo bots.
Personal Robots Industry Leaders
Sony Corporation
Honda Motor Company, Ltd.
Ecovacs Robotics Inc.
iRobot Corporation
Samsung Group
- *Disclaimer: Major Players sorted in no particular order
Personal Robots Market Companies Covered in this Report
- iRobot Corporation
- Ecovacs Robotics Co., Ltd.
- Roborock Technology Co., Ltd.
- Samsung Electronics Co., Ltd.
- Dyson Technology Limited
- Honda Motor Co., Ltd.
- Sony Group Corporation
- Amazon.com, Inc. (Astro)
- Neato Robotics Inc. (Vorwerk)
- UBTECH Robotics Corp.
- Temi USA Inc.
- Segway Inc. (Ninebot)
- FandP Robotics AG
- Gecko Systems International Corp.

Market Opportunities and Future Outlook
Recurring software, service, and subscription layers create a clear whitespace for vendors that have historically relied on one-time hardware sales, particularly in household work where vacuum cleaners already serve as a trusted entry point. The report data indicates that services and subscriptions grow faster than hardware within the category. At the same time, consumer concerns around privacy and home mapping support a second opportunity: selling robots that reduce cloud dependence via on-device AI, data localization options, and user-controlled sharing, while still delivering premium navigation and smart-home integration.
A second opportunity is expanding beyond utility-only devices into companionship and human-centered interaction, backed by visible product moves from established players. ECOVACS launched LilMilo in May 2026 as an emotional AI companion robot, showing that major household-robot brands are testing categories beyond cleaning. In parallel, formal evaluation and safety standards for household robots, such as EN IEC 62849:2026, provide a clearer path for vendors to market differentiated performance and safety, which can improve distribution access in mature markets where compliance and trust shape purchase decisions.
Recent Industry Developments in Personal Robots Market
- July 2026: iRobot introduced the Roomba Electro Plus alongside a new generation of Roomba robots, expanding its floor-care lineup and feature set. This refresh targets competitive pressure from lower-cost rivals by updating the platform and giving consumers clearer upgrade paths within the brand.
- January 2026: EN IEC 62849:2026 was published, establishing updated performance evaluation methods for robots used in household settings. It supports more consistent benchmarking and procurement criteria in mature markets.
- November 2024: Honda announced the commercialization of its autonomous robotic lawn mower under the Honda ProZision brand. Productization of outdoor household robotics adds an adjacent pathway for personal-robot adoption and pushes vendors to extend navigation and safety capabilities beyond indoor environments.


Personal Robots Market Report Scope and Research Methodology
Market Definition and Coverage
For this report, the personal robots market covers robots bought or used mainly by individuals for day-to-day tasks, learning, entertainment, mobility assistance, and basic in-home help. The market value is measured as revenues from hardware, integrated software, and related robot components sold into personal use cases.
Scope exclusions: We exclude industrial robots used on factory floors, and robots that are strictly built for commercial facilities and institutional workflows.
Segments Covered in This Report
- By Application
- Household Work
- Entertainment and Social Companion
- Elderly and Handicap Assistance
- Home Security and Surveillance
- Education and Research
- By Mobility
- Stationary
- Mobile Wheeled
- Humanoid Bipedal
- By Component
- Hardware
- Software
- Services and Subscriptions
- By Control Interface
- App-Controlled
- Voice-Controlled
- Gesture / Vision-Controlled
- Fully Autonomous
- By Geography
- North America
- United States
- Canada
- Mexico
- Europe
- United Kingdom
- Germany
- France
- Italy
- Rest of Europe
- Asia-Pacific
- China
- Japan
- India
- South Korea
- Rest of Asia-Pacific
- Middle East
- Israel
- Saudi Arabia
- United Arab Emirates
- Turkey
- Rest of Middle East
- Africa
- South Africa
- Egypt
- Rest of Africa
- South America
- Brazil
- Argentina
- Rest of South America
- North America
Data Sources, Market Sizing, and Validation
Desk Research
Desk work starts with building the demand picture and the technology context, because personal robots span multiple form factors and price tiers. We mainly referenced public sources such as the International Federation of Robotics (IFR) releases, U.S. Bureau of Labor Statistics and U.S. Census trade series, Eurostat trade and household indicators, OECD demographic and household data, and patent publications from major patent offices.
To convert this context into model inputs, we also reviewed public materials such as company annual reports, investor presentations, product manuals, and regulatory notices tied to wireless and battery safety, plus credible press coverage of launches and shipment milestones. Where needed, we used paid subscriptions for company financials and intelligence, patent lookups, and shipment-level import and export tracking to sanity-check volumes and pricing. These sources are illustrative, and we used additional references for cross-checks, clarification, and validation.
Primary Interviews and Surveys
Primary work was used to pressure test what the desk findings imply in real purchasing behavior and channel movement, especially for robot vacuum cleaners, companion robots, and assistive devices. We spoke with a mix of OEM-side leaders, component suppliers, distributors and retailers, and service partners to confirm pricing ladders, mix shifts, and adoption barriers across regions. We triangulated inputs across APAC, EMEA, and the Americas so that one geography did not drive the global model by accident.
Distribution of primary research fieldwork respondents
| Company type | Respondent position | Region |
|---|---|---|
| Top tier: 39% | CXOs: 20% | APAC: 46% |
| Mid tier: 40% | Functional/Unit leaders: 34% | EMEA: 34% |
| Smaller Players: 21% | Managers: 46% | Americas: 20% |
Market-Sizing & Forecasting
Sizing is built using a top-down approach where household penetration and replacement cycles are mapped to an addressable device base, then translated into annual unit demand before value is derived. To keep it grounded, the totals were corroborated with selective bottom-up checks, such as sampling leading product price bands, channel checks on promotional intensity, and partial supplier roll-ups for key components.
Key model inputs include installed base and replacement timing for cleaning robots, average selling price (ASP) trends by major robot categories, the share of connected and app-controlled models, battery and sensor cost movement that influences entry price points, and region-level household and aging population indicators that affect assistive demand. Forecasting relies on scenario analysis supported by expert views, where adoption accelerates or softens based on affordability, feature upgrades (navigation and on-device AI), and the pace of new launches. Where unit data was patchy for smaller categories, we filled gaps by linking demand to comparable consumer electronics adoption curves, and then rechecked the implied price and mix with interview feedback.
Data Validation & Update Cycle
Validation is handled through multiple checks, so the final numbers do not depend on one assumption. We compare outputs against independent signals like trade flows, company revenue disclosures, and the expected relationship between units, ASP, and regional adoption levels, then investigate variances before sign-off.
If an anomaly is found, we revisit the inputs, and relevant experts are re-contacted to confirm whether it reflects a real market shift or a modeling artifact. The report is refreshed annually, and interim updates are made when there are material events such as step changes in pricing, major product recalls, or demand shocks. Before delivery, a final analyst pass is completed so clients receive the latest updated view.
Mordor Intelligence's Personal Robots Market Size Versus Other Published Estimates
Published numbers for personal robots often vary because the product boundary is not consistent, and some sources mix personal use with wider service robotics revenue. Differences also come from how fast prices are assumed to fall, which year is used as the anchor, and whether forecasts are built from unit adoption signals or from broader spend pools.
The benchmark table shows a higher 2026 value than the 2024 figures from other sources, and in Mordor Intelligence's model the scope is centered on personal activities such as household work, education, and entertainment, with cleaning robots used as a key revenue engine. This avoids blending broader commercial service use cases or narrower device lists into the personal-robots definition.
Benchmark comparison
| Source | Market Size | Gaps in Research Methodology |
|---|---|---|
| Mordor Intelligence | USD 39.21 B (2026) | |
| Trade Journal A | USD 11.16 B (2024) | Uses an earlier base year and a type and end user framing that can undercount fast scaling categories when the mix shifts quickly, and the year to year price progression is not clearly tied to replacement cycles. |
| Global Consultancy A | USD 8.75 B (2024) | Broader category labels are shown, but the inclusion of adjacent robot classes and residential versus commercial splits is not fully transparent, which can shift what is counted as personal robots and change the total. |
Taken together, the spread is mainly explained by year selection and by what is counted as a personal robot versus an adjacent service robot category. By tying the model to adoption and replacement behavior, and then checking the implied ASP and mix with real channel feedback, the sizing stays traceable to clear variables and repeatable steps.


Key Questions Answered in the Report
What is the current value of the personal robots market?
It is valued at USD 39.21 billion in 2026 and projected to reach USD 77.35 billion by 2031.
Which application dominates spending today?
Household work robots, mainly vacuum cleaners, accounted for 57.35% of 2025 revenue.
Which mobility type is growing fastest?
Humanoid bipedal robots lead growth with a 28.4% CAGR through 2031 as balance control and AI reasoning mature.
Why is Asia-Pacific ahead in adoption?
The region combines manufacturing scale, government support and cultural acceptance, giving it a 34.60% revenue lead in 2025.
What restrains faster uptake in North America and Europe?
Consumer privacy concerns surrounding home mapping and data handling impose regulatory and design costs that slow rollout.
How are vendors shifting their revenue models?
Firms now package cloud mapping, AI upgrades and predictive maintenance as subscriptions, boosting recurring income streams alongside hardware sales.
Page last updated on:


 Your data is secure and never sold or shared.


