
Personal Protective Equipment Market Size and Share
Market Overview
| Study Period | 2021 - 2031 |
|---|---|
| Market Size (2026) | USD 35.19 Billion |
| Market Size (2031) | USD 65.33 Billion |
| Growth Rate (2026 - 2031) | 13.17% CAGR |
| Fastest Growing Market | Middle East |
| Largest Market | Asia Pacific |
| Market Concentration | Medium |
Major Players *Disclaimer: Major Players sorted in no particular order Image © Mordor Intelligence. Reuse requires attribution under CC BY 4.0. | |
Personal Protective Equipment Market Analysis by Mordor Intelligence
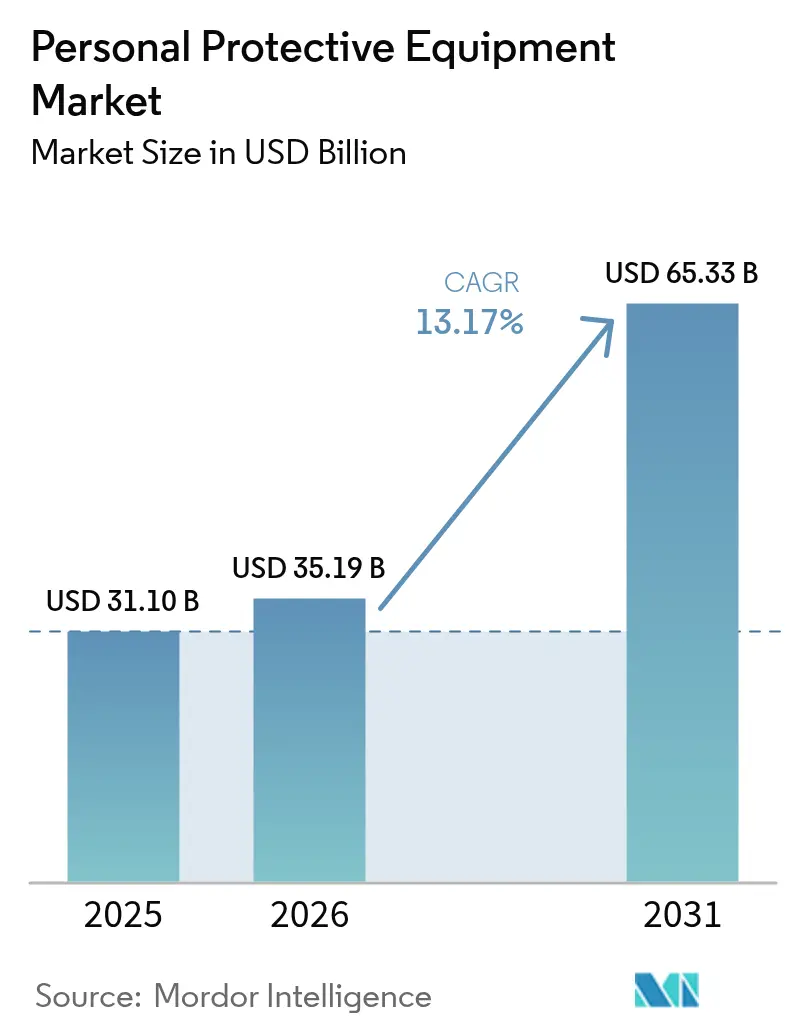
The personal protective equipment market size is expected to grow from USD 31.10 billion in 2025 to USD 35.19 billion in 2026 and is forecast to reach USD 65.33 billion by 2031 at 13.17% CAGR over 2026-2031. Continuous regulatory tightening, higher employer liability exposure, and a widespread corporate commitment to zero-harm cultures are propelling demand across both mature and emerging economies. Rapid miniaturisation of sensors, falling connectivity costs, and increased cloud analytics adoption are turning formerly passive gear into data-rich safety nodes, sharpening the value proposition beyond basic protection. Mounting sustainability expectations are reshaping material choices and lifecycle models, while consolidation among tier-one suppliers is realigning bargaining power across the value chain. Collectively, these forces position the personal protective equipment market for sustained double-digit expansion during the second half of the decade.
Key Report Takeaways
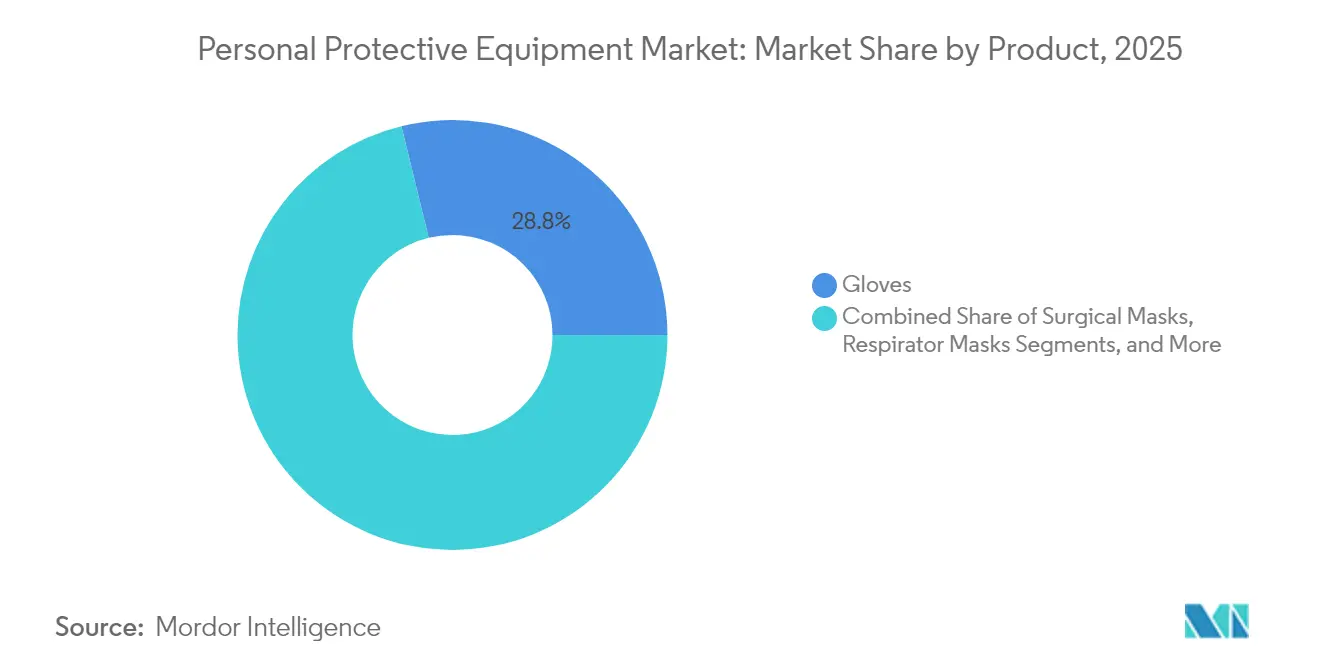
- By product category, Gloves led with 28.82% of personal protective equipment market share in 2025, while Respiratory Protection is set to expand at a 12.48% CAGR to 2031.
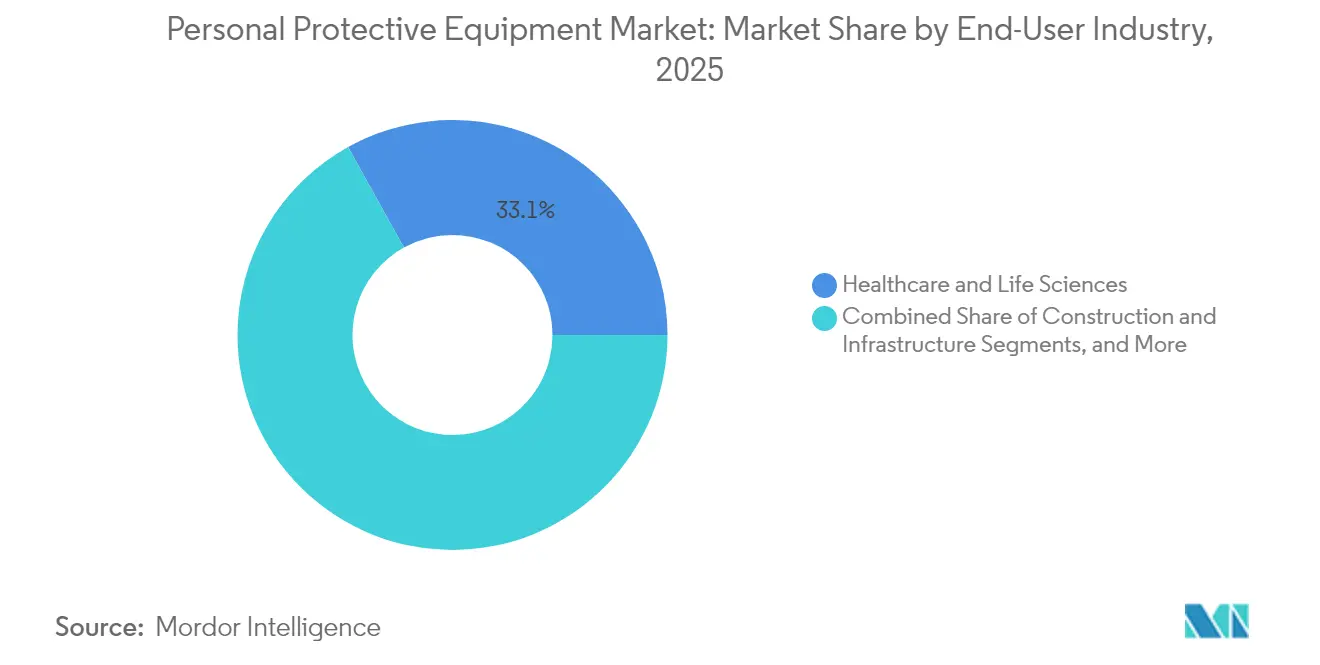
- By end-user industry, Healthcare and Life Sciences held 33.07% revenue share in 2025; Semiconductor Manufacturing registers the highest projected CAGR at 12.18% through 2031.
- By distribution channel, Direct Institutional Contracts controlled 46.45% of the personal protective equipment market size in 2025, whereas E-commerce and Digital Marketplaces are advancing at a 14.90% CAGR.
- By geography, Asia-Pacific commanded 39.05% of the personal protective equipment market size in 2025; the Middle East is forecast to grow the fastest at a 13.86% CAGR between 2026 and 2031.
Note: Market size and forecast figures in this report are generated using Mordor Intelligence’s proprietary estimation framework, updated with the latest available data and insights as of 2026.
Global Personal Protective Equipment Market Trends and Insights
Drivers Impact Analysis*
| Driver | (~) % Impact on CAGR Forecast | Geographic Relevance | Impact Timeline |
|---|---|---|---|
| Accelerated Workplace-Safety Mandates in Asian Manufacturing Hubs | +3.10% | Asia, with spillover effects in North America and Europe | Medium term (2-4 years) |
| Stricter EU Ecodesign and Circularity Rules for Disposable PPE | +2.40% | Europe, with global supply chain implications | Long term (≥ 4 years) |
| Rapid Digitalisation of Industrial PPE Procurement via B2B Marketplaces in North America | +2.00% | North America, with gradual adoption in Europe and Asia | Short term (≤ 2 years) |
| Integration of IoT-Enabled Smart PPE for Real-Time Worker Monitoring in Oil and Gas | +1.60% | Global, with early adoption in North America and Middle East | Medium term (2-4 years) |
| Boom in Clean-Room Expansion for Semiconductor Fabs (Respiratory and Garment Demand) | +1.30% | Asia and North America, with emerging presence in Europe | Medium term (2-4 years) |
| Defence Modernisation Programs Driving Military-Grade Ballistic PPE in Middle East | +1.10% | Middle East, with spillover to North America and Europe | Long term (≥ 4 years) |
| Source: Mordor Intelligence | |||


Accelerated workplace-safety mandates in Asian manufacturing hubs
China’s updated Work Safety Law obliges high-risk sectors to deploy connected PPE that streams exposure data in real time, boosting premium-grade demand across the region [1]National Institute of Standards and Technology, “Health and Safety in the Semiconductor Industry,” nist.gov. India’s Occupational Safety, Health and Working Conditions Code is generating similar momentum, prompting Mallcom to invest INR 100 crore (USD 12 million) to expand domestic capacity. Local suppliers are therefore pivoting from low-cost competition toward performance differentiation, raising average selling prices and tightening compliance across supply chains.
Stricter EU ecodesign and circularity rules for disposable PPE
The EU’s new Extended Producer Responsibility schemes force manufacturers to finance end-of-life collection and recycling of masks and gloves, accelerating R&D in biodegradable polymers. Early pilot programs have recovered up to 60% of materials in single-use categories, turning compliance into a branding advantage for companies such as UVEX and 3M Deutschland.
Rapid digitalisation of industrial PPE procurement via B2B marketplaces in North America
Specialised online exchanges now shorten the quotation-to-order cycle from days to minutes, with industry revenues from GPO-mediated e-sourcing reaching USD 6.3 billion in 2024. Visual-commerce tools, including 3-D configurators, cut product-return rates by enabling virtual fit checks before purchase.
Integration of IoT-enabled smart PPE for real-time worker monitoring in oil and gas
Connected gas detectors and exoskeletons have reduced heat-stress incidents by 25% and musculoskeletal injuries by 20% in pilot programs [2]Source: Ezekiel Smart et al., “Smart PPE and Wearable Technology for Enhancing Worker Safety in the Oil and Gas Industry,” irejournals.com. Devices such as the Blackline Safety G7 feed telemetry into predictive-analytics platforms that alert supervisors before hazardous thresholds are breached.
Restraints Impact Analysis*
| Restraint | (~) % Impact on CAGR Forecast | Geographic Relevance | Impact Timeline |
|---|---|---|---|
| Environmental Push-back on Single-Use Synthetic Polymers in Europe | -1.90% | Europe, with growing influence in North America | Long term (≥ 4 years) |
| Volatile Nitrile and Latex Prices Disrupting Glove Supply Economics | -1.50% | Global, with highest impact in Asia | Short term (≤ 2 years) |
| Compliance Fatigue Among SMEs in Emerging Markets | -1.20% | Asia, Africa, South America | Medium term (2-4 years) |
| Fragmented Certification Standards Hindering Cross-border Trade | -0.90% | Global, with particular impact on emerging markets | Long term (≥ 4 years) |
| Source: Mordor Intelligence | |||
Environmental Push-Back on Single-Use Synthetic Polymers in Europe
Healthcare alone has doubled disposable PPE use since 2005, amplifying landfill pressures and carbon footprints. Advocacy groups now spotlight the climate impact of petro-chemical gloves and masks, prompting hospitals to insert sustainability clauses into tender documents. Alternatives such as bio-based polyhydroxyalkanoate gloves are promising but still cost a premium and struggle to meet stringent filtration or tensile requirements. Manufacturers therefore face a profitability squeeze as they pursue parallel R&D paths while maintaining current production lines to satisfy mandatory performance standards. The net effect is a medium-to-long-term drag on margin expansion, particularly for firms heavily weighted toward high-volume disposables.
Volatile Nitrile and Latex Prices Disrupting Glove Supply Economics
Spot nitrile prices swung more than 150% over the past 18 months, ripping through contract negotiations and exposing smaller converters to working-capital stress. Healthcare providers reported procurement spikes of 200–300% during the worst tightness, forcing some to ration usage. Asian producers, which supply the bulk of global volume, faced energy-cost surges and shipping bottlenecks, reinforcing price gyrations. Larger brands are responding with multi-region feed-stock strategies and forward-buy hedges, yet the unpredictability still erodes forecasting accuracy and clouds investment timing for additional lines.
*Our forecasts treat driver/restraint impacts as directional, not additive. The impact forecasts reflect baseline growth, mix effects, and variable interactions.
Segment Analysis
By Product: Smart technology transforms respiratory protection
Respiratory Protection is projected to grow at a 12.48% CAGR through 2031, powered by smart filters with embedded biometric sensors that warn users of abnormal breathing patterns. Gloves retained 28.82% personal protective equipment market share in 2025, supported by cut-resistant fibres and touchscreen-compatible coatings that suit digital shop-floor workflows.
Design improvements now emphasise breathability and weight reduction; Johns Hopkins experts recommend investment in reusable elastomeric respirators to replace legacy single-use models. As buyers evaluate gear on lifecycle cost rather than ticket price, premium variants-often IoT-enabled-are gaining shelf space across institutional and e-commerce channels.


By End-User Industry: Semiconductor expansion drives specialised demand
Semiconductor fabs are forecast to expand PPE outlays at a 12.18% CAGR to 2031, reflecting the build-out of globally subsidised chip capacity and stringent cleanroom standards. Healthcare and Life Sciences held 33.07% revenue in 2025 and remains the baseline volume anchor for masks, gowns, and examination gloves.
Oil and gas operators deploying real-time monitoring harnesses have cut overall accident rates by 40%, demonstrating quantifiable ROI that accelerates C-suite approval for premium gear. Food processors seek PPE that balances cut resistance with low linting to avoid foreign-material recalls, while defence agencies demand multi-threat ensembles that withstand flame, chemicals, and ballistics in a single configuration .
By Distribution Channel: Digital Platforms Revolutionise Procurement
E-commerce and digital marketplaces are scaling at a 14.90% CAGR, the highest among channels, as safety officers embrace self-service portals that integrate into enterprise resource-planning stacks. The personal protective equipment market size transacted through online specialist platforms is expected to exceed USD 13.24 billion by 2031, doubling its 2025 baseline. Direct Institutional Contracts nevertheless retain 46.45% share due to locked-in service agreements and bundled training offerings.
Industrial distributors are counter-punching against online erosion by embedding safety consultancy, on-site vending machines, and vendor-managed inventory into their value propositions. Visual-commerce toolkits, including 3-D fit checks, are shortening sampling cycles, a critical advantage when lead times for some custom gloves stretch beyond 12 weeks. Retail DIY channels service small contractors and a swelling consumer cohort more attuned to personal safety in home workshops, yet remain peripheral to enterprise-scale PPE flows.
Geography Analysis
Asia-Pacific held 39.05% of the personal protective equipment market in 2025, underwritten by its outsized manufacturing footprint and expanding construction pipeline. China’s chemical, electronics, and ship-building clusters drive bulk orders, while India’s medical-device sector is on track to reach USD 20.51 billion by 2029, boosting domestic demand for cleanroom-grade consumables. Governments are scaling fiscal incentives for local PPE production, reducing import dependence and enhancing supply-chain resilience.
North America maintains a robust position characterised by stringent OSHA oversight and early adoption of smart PPE in oil and gas and healthcare. Federal funding for semiconductor expansion is set to lift demand for contamination-control garments, reinforcing the region’s premium-product bias. Europe’s market is pivoting toward eco-compliance, with circularity deadlines pressuring suppliers to offer take-back schemes and recycled-content portfolios. These sustainability prerequisites act as soft trade barriers that encourage regional sourcing.
The Middle East is the fastest-growing pocket, forecast at a 13.86% CAGR to 2031 on the back of USD 2 trillion worth of mega-projects across Saudi Arabia and the UAE. National regulations now require internationally certified PPE for site workers, opening avenues for premium brands. South America exhibits uneven adoption; Brazil is raising enforcement after high-profile industrial incidents, while fiscal constraints temper acceleration elsewhere. Africa presents a long-horizon opportunity: industrialisation and mining expansion are stepping up enforcement of safety codes, yet supply chains remain nascent, favouring first movers able to localise last-mile distribution.


Regulatory Landscape
Personal protective equipment requirements are tightening through periodic updates to core standards and conformity pathways. In the European Union, Regulation (EU) 2016/425 remains the primary framework, and the European Commission updated the list of harmonised standards via Commission Implementing Decision (EU) 2026/1279 (adopted June 12, 2026), incorporating revisions such as EN 397:2025 for industrial safety helmets and EN ISO 12312-1:2022 for eye and face protection. This update reinforces the presumption-of-conformity route for CE-marked PPE.
Beyond product compliance, trade and occupational frameworks are increasingly affecting sourcing and documentation. In Canada, proposed amendments published in the Canada Gazette, Part I (June 2026) aim to align federal OHS regulations with provincial and territorial PPE technical standards (including personal flotation devices), pushing suppliers toward more consistent labeling and technical-file practices across jurisdictions. In the United States, USTR actions signaled continued tariff and forced-labor scrutiny for medical equipment supply chains in 2026, which raises the value of origin traceability and supplier due diligence for global PPE importers and distributors.
Value Chain Analysis
The PPE value chain draws on petrochemical and fiber inputs (nitrile butadiene rubber, latex, specialty polymers, nonwovens, aramids), component manufacturing (filters, valves, lenses, helmet shells, harness hardware), and downstream assembly and finishing (dipping lines for gloves, meltblown/nonwoven conversion, garment cutting and sealing). Certification and testing cover fit, filtration, impact, and flame or chemical performance, and distribution takes place through direct institutional contracts, industrial distributors, and digital marketplaces. Brand owners and tier-one suppliers are increasingly pairing smart PPE deployments with training, fit-testing support, and connected-device software, shifting value capture from unit sales toward service and compliance workflows.
Recent supply-chain actions point to continued localization and resilience efforts, alongside persistent raw-material dependencies. Mallcom India commissioned a new INR 100 crore Sanand, Gujarat facility with NBR and PU glove dipping lines (July 2026), aimed at strengthening domestic availability. In the United States, initiatives to restart domestic nitrile glove production have advanced through partnerships such as a Chillicothe, Ohio project tied to qualification steps for government procurement, while broader bottlenecks still link back to imported feedstocks and the difficulty of securing long-term purchase commitments that make capacity upgrades financially viable.
Competitive Landscape
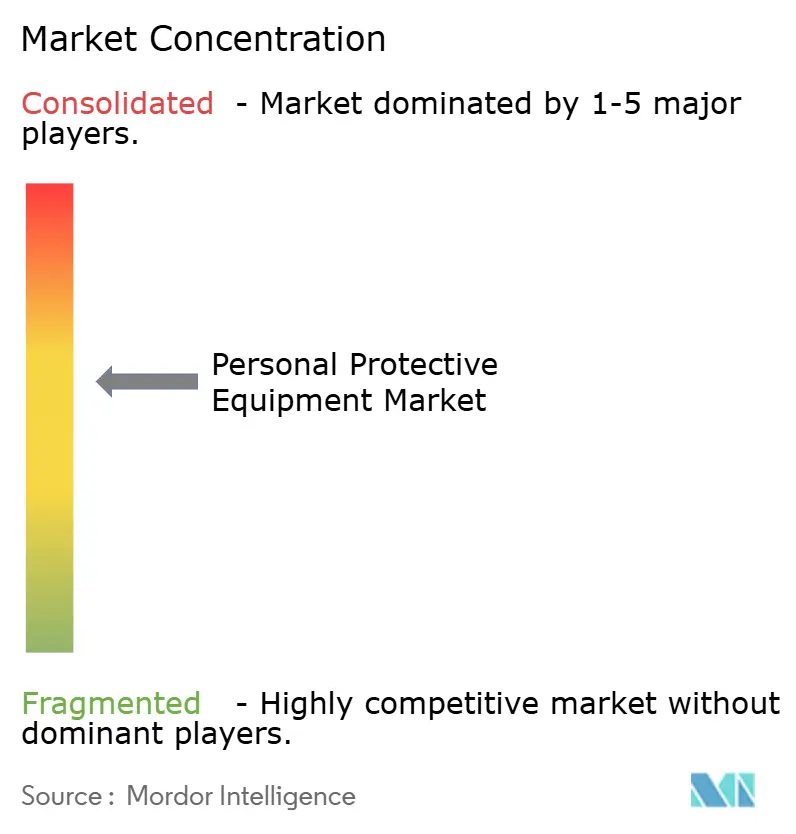
The competitive arena is moderately consolidated, with the top five suppliers controlling roughly 40% of global revenue. Protective Industrial Products’ USD 1.325 billion acquisition of Honeywell’s PPE division augmented its head-to-toe portfolio and deepened its exposure to high-margin respiratory lines. Kimberly-Clark’s USD 640 million divestiture of its professional-grade unit to Ansell signals a sharpening strategy around core consumer franchises, while granting Ansell greater cleanroom leverage. Portfolio optimisation is the dominant theme as conglomerates shed non-core assets and specialist players scale through targeted bolt-ons.
Differentiation is shifting from unit cost to data-enabled services and circular credentials. Smart-helmet producers now bundle subscription-based analytics dashboards that visualise compliance metrics, anchoring sticky recurring revenue. Material innovators are exploring graphene-infused fabrics with superior cut resistance at lower weight, positioning against commoditised aramids. Industry-association conformity protocols such as ANSI/ISEA 125-2014 raise the documentation bar, advantaging firms with end-to-end quality management and in-house testing labs.
White-space opportunities reside in closed-loop collection for high-volume consumables and in industry-specific niches such as battery-cell production, which requires dual chemical and antistatic protection. Barriers to entry are rising as regulatory filings, fit-testing data, and cyber-security certifications inflate compliance budgets. Consequently, small-cap innovators frequently pursue licensing or joint development with tier-ones rather than stand-alone scale-ups.
Personal Protective Equipment Industry Leaders
3M Company
Honeywell International Inc.
Ansell Ltd
DuPont de Nemours Inc.
Kimberly-Clark Corporation
- *Disclaimer: Major Players sorted in no particular order

Market Opportunities and Future Outlook
Compliance-driven product refresh cycles are creating near-term whitespace for suppliers that can turn new standards into faster-to-certify portfolios and clearer documentation. The EU harmonised-standards update under Implementing Decision (EU) 2026/1279 (June 2026) increases the premium on proactive conformity management for helmets and eyewear. The EU internal market emergency procedures under Regulation (EU) 2024/2748 (in force from May 29, 2026) also offer a mechanism for common specifications during an activated emergency, rewarding manufacturers with strong notified-body readiness and scalable, auditable quality systems.
Digitized compliance and inventory control are also becoming purchase criteria, supporting opportunities for platforms and suppliers that reduce wastage and improve traceability. Matrix Design Africa, for example, showcased its ppe2go Cloud PPE management platform at A-OSH Expo 2026 (June 2026), reflecting demand for tooling that connects issuance, stock levels, and policy adherence. On the supply side, capacity investments like Mallcom India operationalizing its Sanand glove facility (June 2026) support import-substitution tenders where domestic availability is weighted, while trade enforcement and supply-chain transparency receive greater attention, increasing the value of supplier mapping and product-level data readiness in institutional contracts.
Recent Industry Developments
- March 2026: 3M entered into a definitive agreement with Bain Capital to acquire Madison Fire & Rescue for USD 1.95 billion and combine it with 3M's Scott Safety business to form a new fire and safety venture. 3M planned to retain 50.1% ownership and receive USD 700 million in cash, signaling a portfolio move toward specialized safety solutions with scaled channels in industrial and emergency-response end markets.
- May 2025: Honeywell completed the sale of its Personal Protective Equipment business to Protective Industrial Products for USD 1.325 billion in an all-cash transaction. The exit reshaped competitive positioning by transferring a broad PPE portfolio to a pure-play acquirer and freeing Honeywell to reallocate investment toward aviation, automation, and energy-transition priorities.
- July 2024: Ansell completed the acquisition of Kimberly-Clark's Personal Protective Equipment business, bringing brands such as Kimtech and KleenGuard into its portfolio. The combination strengthened Ansell's reach in cleanroom, laboratory, and industrial safety categories and expanded cross-selling potential through its global distribution footprint.


Research Methodology Framework and Report Scope
Market Definition and Coverage
This market is defined as the revenue generated from the sale of personal protective equipment used to reduce exposure to workplace and healthcare hazards, covering commonly used protective wear and devices that are purchased for employee and patient safety.
Scope exclusions: We exclude general workwear and fashion apparel that are not designed, certified, or marketed for protective performance.
Segmentation Overview
- By Product
- Surgical Masks
- Respirator Masks
- N-Series (N95, N99, N100)
- P-Series (P95, P99, P100)
- R-Series (R95, R99, R100)
- FFP1
- FFP2
- FFP3
- Gloves
- Disposable (Latex)
- Disposable (Nitrile)
- Industrial Re-usable
- Suits and Coveralls
- Aprons and Gowns
- Protective Eyewear and Face Shields
- Hearing Protection
- Earplugs
- Earmuffs
- Protective Footwear
- Safety Shoes
- Rubber Boots
- Helmets and Hard Hats
- Fall Protection
- Harnesses and Lanyards
- Fire-Resistant and Arc-Flash Clothing
- By End-User Industry
- Healthcare and Life Sciences
- Manufacturing (Heavy and Light)
- Construction and Infrastructure
- Oil and Gas, Mining and Metals
- Chemicals and Pharmaceuticals
- Food and Beverage Processing
- Transportation and Logistics
- Military, Law Enforcement and Homeland Security
- By Distribution Channel
- Direct Institutional Contracts
- Industrial Distributors and Wholesalers
- E-commerce and Digital Marketplaces
- Retail (DIY and Hardware Stores)
- By Geography
- North America
- United States
- Canada
- Mexico
- South America
- Brazil
- Argentina
- Rest of South America
- Europe
- Germany
- France
- United Kingdom
- Italy
- Spain
- Nordics (Sweden, Norway, Denmark, Finland, Iceland)
- Benelux (Netherlands, Belgium, Luxembourg)
- Central and Eastern Europe (Poland, Czech Republic, Russia, Others)
- Middle East and Africa
- Saudi Arabia
- United Arab Emirates
- Turkey
- South Africa
- Nigeria
- Kenya
- Rest of Middle East and Africa
- APAC
- China
- Japan
- India
- South Korea
- ASEAN-5 (Indonesia, Thailand, Malaysia, Vietnam, Philippines)
- Australia
- New Zealand
- Rest of APAC
- North America
Data Sources, Market Sizing, and Validation
Desk Research
Desk research was used to set market context, align definitions, and establish starting points for demand and supply checks. Public and official sources were reviewed to understand safety regulations, workplace injury patterns, industrial activity, and healthcare usage signals that influence PPE consumption.
Typical sources included US Bureau of Labor Statistics injury and occupational data, OSHA standards and guidance, NIOSH respirator resources, CDC infection prevention guidance, Eurostat manufacturing indicators, and UN Comtrade trade statistics for relevant HS codes. We also reviewed company annual reports, investor presentations, trade association publications, and reputed business press, then used paid subscriptions for company financials and patent lookups when disclosures were limited. The sources listed here are illustrative only, and many other public references were also used for cross-checking and clarification.
Primary Interviews and Surveys
Primary work was used to pressure-test assumptions that are hard to read from public data, especially category mix, channel margins, and the pace of price normalization after supply shocks. We spoke with manufacturers, distributors, procurement heads, and safety managers across key end users (healthcare, manufacturing, construction). Inputs were triangulated across major regions so we could account for regional adoption and compliance differences.
Distribution of primary research fieldwork respondents
| Company type | Respondent position | Region |
|---|---|---|
| Top tier: 39% | CXOs: 12% | APAC: 45% |
| Mid tier: 47% | Functional/Unit leaders: 32% | EMEA: 32% |
| Smaller Players: 14% | Managers: 56% | Americas: 23% |
Market-Sizing & Forecasting
Sizing starts with a top-down build where industrial employment, healthcare activity, and trade and production signals are used to reconstruct the addressable PPE demand pool. We then convert that pool into value using category-level pricing logic. To keep totals realistic, we corroborate the outcome with selective bottom-up checks, such as sampled supplier revenue splits, channel markups, and ASP times volume sanity checks for high-volume items.
Key inputs used in the model include workplace injury incidence and compliance intensity, healthcare procedure and infection-control usage patterns, industrial output and construction activity, import dependence for selected PPE categories, and observed price movement for disposable items with high turnover. Where direct volume data is patchy, gaps are handled using proxy units, for example worker counts by industry and replacement cycles, and then adjusted after interview feedback.
For forecasting, scenario analysis was applied with a base case built from macro and sector indicators, and with variables tuned based on what procurement and supply-side experts shared about stocking behavior, regulatory enforcement, and expected ASP normalization. The forecast is reviewed for internal consistency so category growth does not outpace the end-user activity signals that drive consumption.
Data Validation & Update Cycle
Outputs are validated through multiple passes that check arithmetic accuracy, compare results against independent signals such as trade values, industrial activity, and safety compliance indicators, and flag unusual jumps in category mix or pricing. If a variance cannot be explained by a documented driver, we revisit assumptions and trigger targeted callbacks with relevant respondents.
Before sign-off, a separate analyst reviews key assumptions, and then the dataset is checked again for currency consistency and year-on-year continuity. Reports are refreshed annually, and interim updates are made when material events occur such as new safety mandates, supply disruptions, or sharp price swings. Before delivery, a final refresh pass is completed so clients receive the latest updated view.
Mordor Intelligence's Personal Protective Equipment Market Size Versus Other Published Estimates
Published market sizes for PPE often do not line up because the scope is drawn differently and the pricing logic is not always visible, especially for high-volume disposable items. Differences also come from how firms treat channel margins, currency timing, and how frequently assumptions are refreshed after demand shocks.
Some public figures fold in adjacent categories like general workwear, long-term service contracts, or parts of industrial uniforms sold through retail. In Mordor Intelligence, the count is limited to protective equipment categories used for hazard prevention, and value is built using category mix, channel pathway, and price normalization checks that are re-tested through primary feedback.
Benchmark comparison
| Source | Market Size | Gaps in Research Methodology |
|---|---|---|
| Mordor Intelligence | USD 31.10 B (2025) | |
| Trade Journal A | USD 56.64 B (2024) | This estimate appears to include a wider set of PPE-related offerings, and the basis year reflects a different pricing environment, which can inflate totals if disposable-category ASPs are not normalized. |
| Industry Report B | USD 62.00 B (2025) | The total likely reflects a broader definition that can blend protective equipment with adjacent workwear and retail-led categories, and it may apply uniform growth rates without explicit channel and category mix checks. |
The spread in the table mostly comes down to category inclusion and how pricing is treated for fast-moving items that swing with supply conditions. By keeping the scope tied to protective performance and then cross-checking prices and mix through repeatable steps, the final number stays easier to trace back to clear demand drivers.


Key Questions Answered in the Report
What is the current value of the personal protective equipment market?
The personal protective equipment market stands at USD 35.19 billion in 2026 and is projected to reach USD 65.33 billion by 2031.
Which product segment is growing the fastest?
Respiratory Protection is the fastest-growing segment, expected to expand at a 12.48% CAGR through 2031 on the back of smart-filter innovations.
How significant is Asia in the global landscape?
Asia accounted for 39.05% of personal protective equipment market share in 2025, driven by large-scale manufacturing and stricter safety mandates.
Why are smart PPE solutions gaining traction?
Embedded sensors provide real-time monitoring that has proven to cut incidents by up to 25%, enabling predictive safety management and lowering insurance exposure.
Page last updated on:


