
Global Personal Mobility Devices Market Size and Share
Market Overview
| Study Period | 2020 - 2031 |
|---|---|
| Market Size (2026) | USD 15.71 Billion |
| Market Size (2031) | USD 21.11 Billion |
| Growth Rate (2026 - 2031) | 6.09 % |
| Fastest Growing Market | Asia Pacific |
| Largest Market | North America |
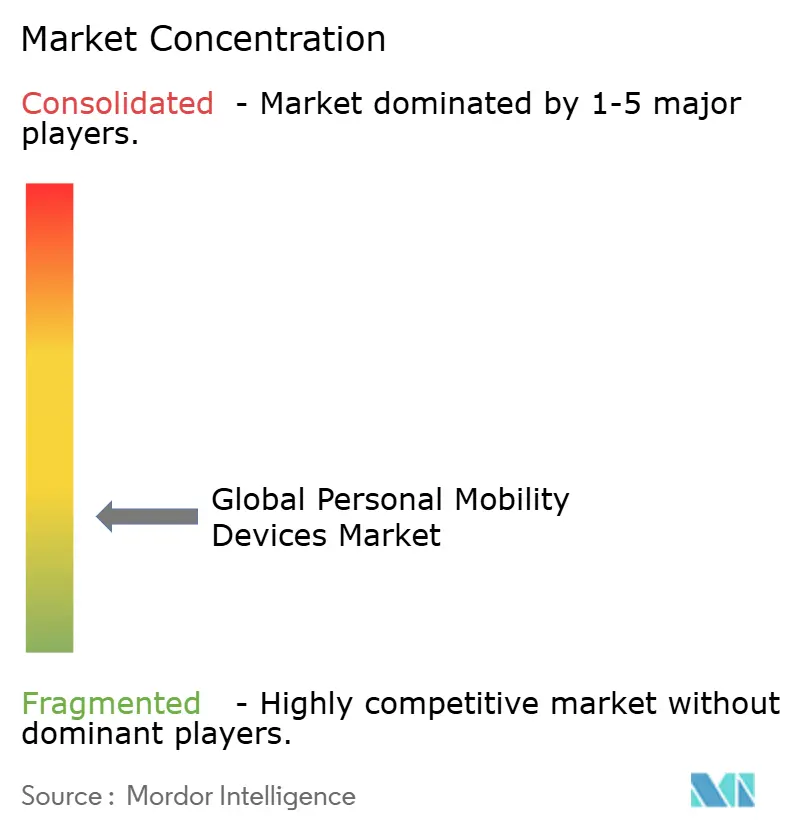
| Market Concentration | Low |
Major Players *Disclaimer: Major Players sorted in no particular order Image © Mordor Intelligence. Reuse requires attribution under CC BY 4.0. | |
Global Personal Mobility Devices Market Analysis by Mordor Intelligence
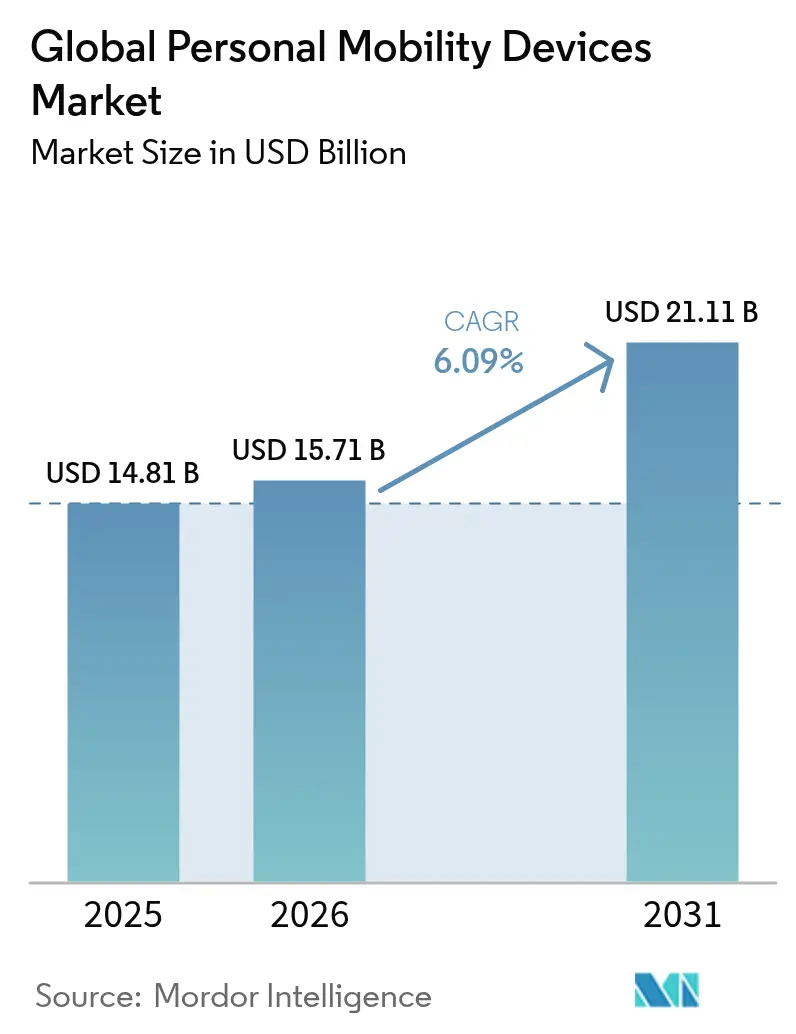
The personal mobility devices market size was valued at USD 14.81 billion in 2025 and estimated to grow from USD 15.71 billion in 2026 to reach USD 21.11 billion by 2031, at a CAGR of 6.09% during the forecast period (2026-2031). Demand accelerates as home-care reimbursement expands, AI-driven wheelchairs reach mainstream price levels, and battery density improvements extend powered-device range. Wheelchairs remain the volume backbone, while mobility scooters gain traction among seniors who want independence outdoors. Manual devices still outsell powered units, yet power-assist technologies narrow the affordability gap and tempt first-time buyers. North America retains leadership thanks to established coverage rules, but the personal mobility devices market in Asia-Pacific grows fastest as its elderly population swells and consumer spending power rises.
Key Report Takeaways
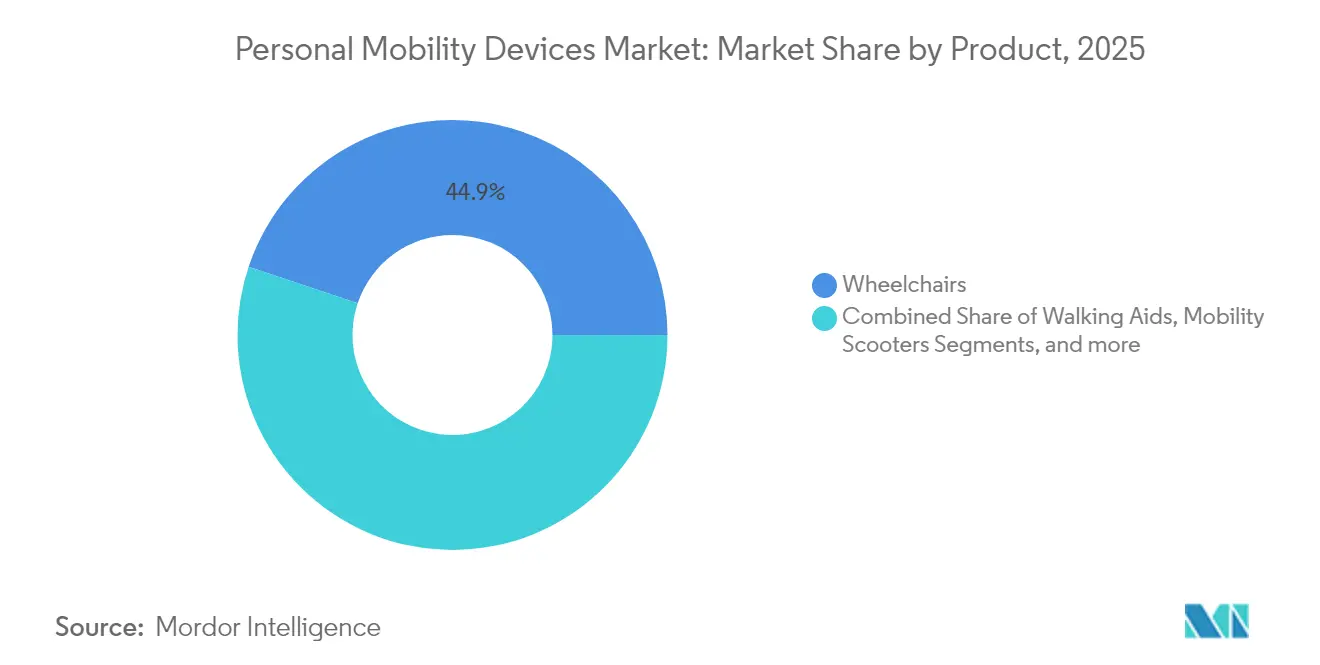
- By product category, wheelchairs led with 44.85% revenue share in 2025; mobility scooters are forecast to expand at a 6.48% CAGR to 2031.
- By technology, manual devices held 50.10% of the personal mobility devices market share in 2025, while powered solutions are projected to post the highest CAGR at 6.4% through 2031.
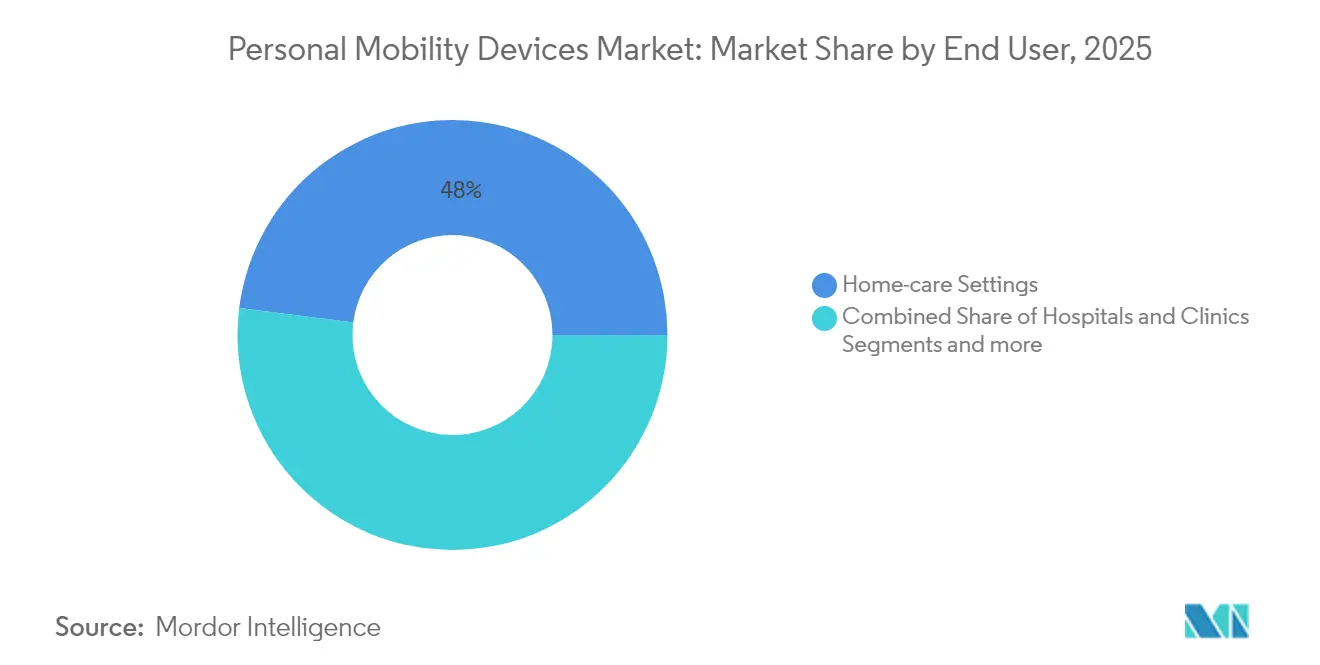
- By end user, home-care settings accounted for 48.00% of the personal mobility devices market size in 2025 and remain dominant, whereas rehabilitation and long-term care centers are advancing at a 6.45% CAGR to 2031.
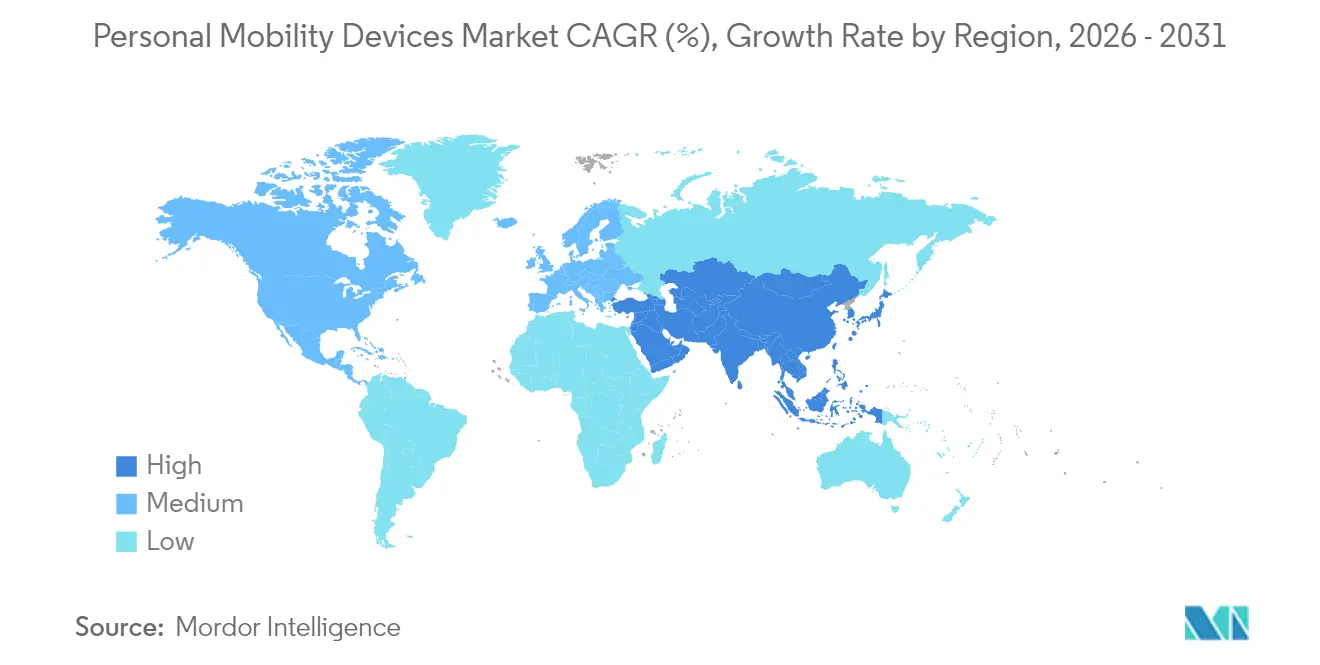
- By geography, North America commanded 38.40% share of the personal mobility devices market in 2025; Asia-Pacific records the strongest CAGR at 6.66% to 2031.
- By distribution channel, offline retail captured 70.60% share in 2025, while the e-commerce segment is set to grow at 6.78% CAGR through 2031.
Note: Market size and forecast figures in this report are generated using Mordor Intelligence’s proprietary estimation framework, updated with the latest available data and insights as of 2026.
Market Trends and Insights
Drivers Impact Analysis of Global Personal Mobility Devices Market*
| Driver | % Impact on CAGR Forecast | Geographic Relevance | Impact Timeline |
|---|---|---|---|
| Aging-in-place preference & home-care reimbursement expansion | +1.2% | North America & EU, expanding to APAC | Medium term (2-4 years) |
| Surge in robotic & AI-driven wheelchairs reaching commercial price points | +0.8% | Global, with early adoption in North America & Japan | Long term (≥ 4 years) |
| Mini-mobility regulation easing for scooters & e-kick devices in OECD cities | +0.6% | OECD countries, spillover to emerging markets | Short term (≤ 2 years) |
| Growing geriatric population & chronic disease prevalence | +1.4% | Global, concentrated in APAC & North America | Long term (≥ 4 years) |
| Battery density breakthroughs lifting range & payload of powered devices | +0.7% | Global, manufacturing concentrated in APAC | Medium term (2-4 years) |
| Rapid e-commerce penetration in DME retail | +0.5% | Global, led by North America & EU | Short term (≤ 2 years) |
| Source: Mordor Intelligence | |||
Aging-in-Place Preference & Home-Care Reimbursement Expansion
Medicare’s 2025 Home Health Prospective Payment System now reimburses 80% of approved mobility device costs, aligning coverage with community-based care goals. U.S. private insurers mirror this structure, guaranteeing continuity across commercial plans. Streamlined telehealth evaluations further reduce administrative friction, which brings purchasing decisions earlier in the disability journey. European payers adjust in parallel, adding personal mobility devices to home-adaptation budgets. As reimbursement spreads across Asia-Pacific, independent living purchases become integral to retirement planning.
Surge in Robotic & AI-Driven Wheelchairs Reaching Commercial Price Points
WHILL’s autonomous chairs already ferry travelers across major U.S. airports, proving that lidar, depth cameras, and drive-by-wire systems meet safety and cost targets. Japanese nursing homes deploy similar fleets to ease staff workloads. Component price declines invite midsize manufacturers to license navigation stacks rather than build them from scratch. Insurers have begun covering autonomous options when they remove the need for human attendants, suggesting a virtuous cycle of data collection and actuarial validation.
Mini-Mobility Regulation Easing for Scooters & E-Kick Devices in OECD Cities
Regulatory modernization accelerates device uptake. Australia permits personal mobility devices on shared paths under updated Road Rules. Quebec authorizes motorized mobility aids on public roads once they meet specific lighting and brake standards. Japan’s transport ministry sets dimensional ceilings that guarantee train access for scooters. These moves legitimize powered devices in dense urban areas, expanding total addressable riders within the personal mobility devices market.
Growing Geriatric Population & Chronic Disease Prevalence
Asia’s elderly headcount is expected to reach 923 million by mid-century, raising demand for supportive technologies. Chronic conditions such as diabetes and osteoarthritis often restrict movement long before retirement age, extending product lifecycles. Rising disposable income in China and Thailand prompts families to purchase premium chairs rather than rely on hospital-supplied loaners. Western markets still grow, but sheer demographic momentum in Asia-Pacific defines future volume.
Restraints Impact Analysis of Global Personal Mobility Devices Market*
| Restraint | % Impact on CAGR Forecast | Geographic Relevance | Impact Timeline |
|---|---|---|---|
| High out-of-pocket cost amid limited insurance coverage outside Tier-1 markets | -0.9% | Emerging markets, rural areas in developed countries | Medium term (2-4 years) |
| Safety recalls & rising litigation on lithium-ion fire risk | -0.6% | Global, concentrated in North America & EU | Short term (≤ 2 years) |
| Re-use / refurbished equipment suppressing new unit sales in OECD | -0.4% | OECD countries, particularly North America & EU | Long term (≥ 4 years) |
| Supply-chain exposure to rare-earth motor magnets | -0.3% | Global, manufacturing concentrated in APAC | Medium term (2-4 years) |
| Source: Mordor Intelligence | |||
High Out-of-Pocket Cost Amid Limited Insurance Coverage Outside Tier-1 Markets
In the United States a beneficiary still pays 20% of an approved device, which may equate to several months of Social Security income. Coverage gaps are wider in Latin America and parts of Southeast Asia where national plans exclude durable medical equipment. Private insurers demand clinical validation, adding evaluation charges that push total expense beyond household budgets. Rural patients face added travel costs for fitting sessions, reinforcing inequity between urban and remote populations.
Safety Recalls & Rising Litigation on Lithium-Ion Fire Risk
The U.S. Consumer Product Safety Commission recalled 7,250 RELiON batteries after overheating incidents. Permobil removed SmartDrive speed dials following hundreds of complaints that linked malfunctions to injuries. Plaintiffs now target both manufacturers and cell suppliers, driving up insurance premiums and slowing market introductions of next-generation chemistries. Regulators consider broader certification regimes that may extend product cycles and raise compliance costs.
*Our forecasts treat driver/restraint impacts as directional, not additive. The impact forecasts reflect baseline growth, mix effects, and variable interactions.
Global Personal Mobility Devices Market Segment Analysis
By Product:
Wheelchairs Anchor Demand While Scooters AccelerateWheelchairs captured 44.85% of 2025 revenue, underscoring their foundational role in the personal mobility devices market. Manual variants remain the first choice for hospitals and budget-constrained buyers, while powered models appeal to users seeking independence over longer distances. WHILL’s joystick-free mid-wheel platform exemplifies a design pivot toward intuitive control. Mobility scooters follow with a 6.48% CAGR forecast to 2031, fueled by retirees who need a stable outdoor solution for shopping and leisure. Stair and platform lifts create household vertical access, gaining share as multi-story homes retrofit for aging residents. Competition now centers on out-of-box connectivity, seat ergonomics, and transportability rather than simple speed specifications.
Growth drivers vary by sub-segment. Manual chair sales rely on consistent reimbursement and refurbishment programs that place second-life units in emerging economies. Powered chair demand tracks battery breakthroughs that reduce weight without sacrificing torque. Scooters benefit from liberalized sidewalk rules in many OECD cities. Lift installations correlate with real-estate trends toward multi-level living spaces. Manufacturers that serve each niche through modular platforms can cross-sell accessories and lock in service revenue.

By Technology:
Manual Dominates but Power-Assist Narrows the GapManual designs held 50.10% market share in 2025 due to low price, simple maintenance, and universal insurance recognition. Lightweight aluminum frames and quick-release wheels keep the category competitive for active users. Powered systems, however, should grow at 6.4% CAGR on the back of denser batteries and falling electronics costs. Power-assist kits such as Sunrise Medical’s Empulse line transform a standard chair into a hybrid, providing a bridge for consumers hesitant about full electrification. Research into cobalt-free lithium-ion chemistries promises lower materials risk and extended cycle life.
Future design language blends energy-harvesting hubs, smartphone-based controls, and over-the-air diagnostics. As weight and price converge, insurers may eventually grade benefit levels on functionality rather than drive system. Suppliers who integrate open APIs for remote monitoring position themselves for value-based care contracts that reimburse on mobility outcomes rather than device acquisition alone.
By End User:
Home-Care Prevails but Institutional Demand Gains SpeedHome-care environments accounted for 48.00% of the personal mobility devices market size in 2025. Households value equipment that folds for storage, negotiates tight hallways, and links to telehealth portals. Medicare’s 80% reimbursement ceiling underpins U.S. consumption, while analogous programs in the EU support a thriving repair ecosystem. Rehabilitation and long-term care centers are projected to grow at 6.45% CAGR as population aging increases post-acute residency periods. Facilities adopt fleet management dashboards to track utilization and preventive maintenance, cutting downtime for high-end powered chairs.
Hospitals and clinics remain steady buyers of rugged, infection-control-compliant devices. Procurement teams favor standardized platforms that share parts across multiple wards. Autonomous wheelchairs inside Japanese nursing homes already reduce staff transfers and collect route analytics for facility planners. As service models mature, manufacturers may sell uptime guarantees rather than units, aligning incentives with institutional cost-containment objectives.
By Distribution Channel:
Physical Stores Retain Primacy but Digital Gains TrustOffline suppliers controlled 70.60% of 2025 revenue because fitting accuracy still governs clinical outcomes. Certified dealers measure seat width, back-angle, and footrest length, then submit documentation to payers. They also install stair lifts and train users on safe transfers. Even so, e-commerce is forecast to log a 6.78% CAGR to 2031. Digital storefronts compress search costs, showcase video tutorials, and bundle financing plans. Remote approval portals match CMS prior-authorization workflows, removing paper bottlenecks.
Hybrid models blur lines between channels. Many retailers now schedule virtual show-and-tell sessions before an in-home fitting. Some manufacturers operate direct-to-consumer websites for standardized products like rollators but route complex powered chairs through brick-and-mortar partners. Marketplace differentiation therefore hinges on omnichannel execution rather than a strict online-versus-offline dichotomy within the personal mobility devices market.
Geography Analysis
North America Personal Mobility Devices Market
North America led with 38.40% share in 2025 as Medicare coverage and ADA regulations created predictable volumes for suppliers. The personal mobility devices market benefits from an aging Baby Boomer cohort that prioritizes active lifestyles. Autonomous chair pilots at Los Angeles International Airport and Miami International Airport highlight early adoption appetite. Canada supports growth via provincial equipment loan programs, and Mexico expands public-insurance formularies, though price sensitivity is greater south of the border.
APAC Personal Mobility Devices Market
Asia-Pacific delivers the fastest CAGR at 6.66% through 2031. China’s middle class purchases powered scooters for suburban travel, while Japan pioneers robotic chairs to cope with caregiver shortages. India’s public-private partnerships scale low-cost manual chairs nationwide, yet premium demand rises in metro hospitals. Government initiatives fund domestic battery cell factories, aiming to cut import dependency and stabilize the personal mobility devices market supply chain. Southeast Asian nations revise import tariffs on medical devices, broadening market access for global brands.
EMEA and South America Personal Mobility Devices Market
Europe holds a sizeable yet slower-growing base. Universal healthcare plans reimburse most mobility aids, but refurbished equipment prolongs replacement cycles. The European Commission’s 2024 guidance on light electric vehicle standards harmonizes cross-border product certification, easing pan-EU distribution. Middle East and Africa show early-stage adoption tied to hospital construction booms and newly introduced mandatory health insurance in Gulf Cooperation Council states. South America progresses steadily as Brazil expands long-term care benefits and Argentina subsidizes domestic wheelchair production.
Regulatory Landscape
Personal mobility devices sold through medical channels are governed by a combination of medical-device frameworks, reimbursement rules, and (for certain powered small-format aids) active-mobility road and battery-safety regimes. In the European Union, Regulation (EU) 2017/745 (MDR) continues to shape technical documentation and post-market obligations, and the MDR digital infrastructure tightened with EUDAMED: the registration module became mandatory for all new MDR and IVDR devices on May 28, 2026. This increases the importance of accurate device identification and nomenclature mapping during market entry.
Safety and performance compliance is also moving through standards updates and battery-focused oversight. In June 2026, the European Commission published Implementing Decision (EU) 2026/1231, updating harmonized standards for medical devices, including revisions affecting EN ISO 10993 biocompatibility and EN 60601-1 electrical safety. In the United States, FDA device pathways continue to apply for mobility aids marketed as medical devices, for example, a powered mobility scooter was cleared in February 2025 under 21 CFR 890.3800. Separately, the U.S. Consumer Product Safety Commission issued a June 2026 notice of proposed rulemaking aimed at lithium-ion battery-powered micromobility products, signaling a shift from voluntary UL-based conformance toward mandatory federal requirements. That change can affect battery-pack design, supplier qualification, and retail documentation for powered mobility categories.
Value Chain Analysis
The value chain runs from upstream materials and components, such as aluminum frames, seating foams, electronics, motors, and lithium-ion battery packs, to midstream manufacturing and final assembly, which often blends in-house frame fabrication with outsourced electronics and battery modules. Downstream, certified fitting and distribution through durable medical equipment dealers and institutional channels remains central, because measurement, seating configuration, and payer paperwork often require dealer involvement. E-commerce continues to expand for standardized products and accessories, where sizing and clinical documentation are comparatively simpler.
Supply risk is concentrated in energy-storage and motor subsystems. Battery-grade materials and permanent-magnet supply chains remain heavily tied to Asia, with China maintaining a dominant position in rare earth production and permanent magnet supply, and also processing a large share of key battery materials. This concentration increases the impact of logistics disruptions and trade friction on powered wheelchairs, scooters, and hybrid power-assist kits that depend on consistent cell availability and semiconductor inputs. At the ecosystem level, battery makers and mobility OEMs are formalizing technical collaborations, for example, CALB and Ninebot announced a May 2026 cooperation on high-performance lithium battery technology for short-distance mobility. These battery partnerships and qualified component sourcing increasingly influence time-to-market, compliance readiness, and product cost stability.
Competitive Landscape
The personal mobility devices market remains moderately fragmented. Permobil, Invacare, and Sunrise Medical together account for a large slice of wheelchair revenue, yet numerous regional firms populate scooter and rollator niches. MIGA Holdings acquired Invacare’s North American operations in 2024, allowing Invacare to refocus on Europe and Asia-Pacific. Sunrise Medical bought Nuprodx and Ride Designs to control the high-margin seating segment[1].
Technology investment differentiates leaders. Permobil’s 14,000-square-meter innovation center unites R&D with automated production lines to compress design-to-market cycles[2]. WHILL leverages edge computing to run obstacle-avoidance algorithms locally, reducing latency in crowded terminals. Competitors explore rare-earth-free motors to mitigate supply shock risks flagged by the U.S. Department of Energy[3]. Firms with in-house electronics and battery packs shield themselves from component shortages, while those reliant on contract assemblers face cost volatility.
Service strategies evolve. Subscription models bundle devices, software updates, and maintenance into monthly fees, smoothing revenue. Extended warranties, cloud-based diagnostics, and remote firmware pushes strengthen brand stickiness. As autonomous functionality expands, intellectual-property portfolios around localization algorithms and sensor fusion rise in strategic value. Consolidation is expected to continue, especially if mid-tier brands struggle to fund required software talent.
Global Personal Mobility Devices Industry Leaders
-
Invacare Corporation
-
Ottobock
-
Drive DeVilbiss Healthcare
-
Stryker Corporation
-
GF Health Products Inc.
- *Disclaimer: Major Players sorted in no particular order
Global Personal Mobility Devices Market Companies Covered in this Report
- Pride Mobility Products
- Invacare
- Drive DeVilbiss Healthcare
- Sunrise Medical
- Permobil AB
- GF Health Products
- Stryker
- Ottobock
- Medline Industries
- Arjo AB
- Kaye Products
- Rollz International
- Performance Health
- WHILL Inc.
- Golden Technologies
- Amigo Mobility International
- Afikim Electric Vehicles
- Permobil Group (ROHO)
- TOPRO AS
- Yadea Technology Group
Market Opportunities and Future Outlook
Battery safety requirements and formal access rules create whitespace for manufacturers and retailers that can document compliant battery packs, chargers, and safe-use ecosystems. The U.S. Consumer Product Safety Commission opened a June 2026 rulemaking proposal that would require lithium-ion micromobility products to meet UL 2849, UL 2272, and UL 2271. This would move the market toward auditable, standard-linked safety performance rather than voluntary adoption. City-level rulemaking can also reshape demand and product design for motorized personal mobility aids: Singapore set new personal mobility aid dimension and weight limits and tightened operating rules effective June 1, 2026. That regulatory clarity supports portfolios engineered to fit defined envelopes and enables retailers to rationalize assortments around compliant SKUs.
Reimbursement and public accessibility programs offer a second opportunity lane that ties into lightweight materials, clinical coding, and built-environment upgrades. In the United States, H.R. 1703 (Choices for Increased Mobility Act of 2025) advanced in May 2026 with direction to establish Medicare billing codes for ultralightweight manual wheelchairs using titanium or carbon fiber construction. That supports clearer pathways for premium manual configurations when adopted. Public-sector accessibility spending can similarly expand deployment settings that require mobility solutions: the Federal Transit Administration announced USD 686 million for FY 2026 under the All Stations Accessibility Program to upgrade rail-station accessibility. This broadens the set of projects that need compatible mobility aids, transfer equipment, and accessible design integration across major systems.
Recent Industry Developments in Global Personal Mobility Devices Market
- July 2026: WHILL launched the Modo Breeze, a carbon-fiber ultralight electric wheelchair positioned at a lower price point than many powered alternatives. The product push highlights ongoing material substitution toward carbon fiber to reduce carry weight and widen powered-chair adoption beyond traditional clinical buyers.
- June 2026: Ottobock signed a definitive agreement to sell its Human Mobility business unit, including manual and power wheelchairs and seating solutions, to DHCare. The transaction reorganizes competitive positions in core wheelchair categories and gives the acquirer a larger installed base to scale distribution, parts, and service capabilities.
- December 2025: Invacare America introduced the ASL iON Integrated Drive Control System for power wheelchairs, adding Bluetooth connectivity and multi-device integration. The launch reinforces the shift toward connected control architectures that support accessory ecosystems and differentiated user interfaces in powered mobility.
Global Personal Mobility Devices Market Report Scope and Research Methodology
Market Definition and Coverage
For this study, the personal mobility devices market covers revenues from newly manufactured assistive devices that help people move safely in daily life, mainly when mobility is limited due to age, injury, or disability. Our view is global and values are tracked as product sales rather than service usage.
Scope exclusions: recreational e-scooters, exoskeletons, rental fleets, and after-sales service revenues are excluded from the market totals.
Segments Covered in This Report
- By Product
- Wheelchairs
- Manual Wheelchairs
- Powered Wheelchairs
- Robotic/Autonomous Wheelchairs
- Walking Aids
- Canes & Crutches
- Walkers & Rollators
- Mobility Scooters
- 3-Wheel
- 4-Wheel
- Stair Lifts & Platform Lifts
- Wheelchairs
- By Technology
- Manual
- Powered
- Hybrid / Power-assist
- By End User
- Hospitals & Clinics
- Home-care Settings
- Rehabilitation & Long-term Care Centers
- By Distribution Channel
- Offline
- E-commerce
- By Geography
- North America
- United States
- Canada
- Mexico
- Europe
- Germany
- United Kingdom
- France
- Italy
- Spain
- Rest of Europe
- Asia-Pacific
- China
- Japan
- India
- South Korea
- Australia
- Rest of Asia-Pacific
- Middle East and Africa
- GCC
- South Africa
- Rest of Middle East and Africa
- South America
- Brazil
- Argentina
- Rest of South America
- North America
Data Sources, Market Sizing, and Validation
Desk Research
Desk research started with pinning down what counts as an assistive mobility device, then mapping demand-side and supply-side signals that can be checked repeatedly. Public sources such as the World Health Organization, the US CDC, and national health ministries were used to frame mobility-limitation prevalence, aging trends, and injury-related mobility needs by country.
We also reviewed illustrative sources such as US Census Bureau population tables, UN demographic statistics, and trade or customs portals where medical device imports and exports are visible at a high level. To keep the model grounded in what is being sold and reimbursed, we relied on company annual reports and investor presentations, association websites relevant to assistive technology, and reputable press coverage of policy and accessibility updates. Select paid database subscriptions were used to standardize company financials, track patent activity, and cross-check import and export shipment signals where public detail was thin. These desk sources are not exhaustive, and additional references were used to collect data, validate assumptions, and clarify definitions.
Primary Interviews and Surveys
Primary work was used to pressure-test demand drivers and pricing logic, especially where public data does not separate manual versus powered devices cleanly. We spoke with stakeholders across manufacturers, distributors, home care providers, and clinical procurement roles, and regional coverage was balanced across APAC, EMEA, and the Americas so currency, reimbursement, and channel mix differences could be normalized.
Distribution of primary research fieldwork respondents
| Company type | Respondent position | Region |
|---|---|---|
| Top tier: 39% | CXOs: 13% | APAC: 47% |
| Mid tier: 46% | Functional/Unit leaders: 29% | EMEA: 31% |
| Smaller Players: 15% | Managers: 58% | Americas: 22% |
Market-Sizing & Forecasting
Sizing was built with a top-down approach where demographic and care-setting signals were reconstructed into an addressable demand pool, then converted into device spending using adoption and replacement patterns. In practice, we start with country-level mobility-limitation and aging indicators, align them to care settings (home care, long-term care, and clinical use), and then apply purchase frequency and mix assumptions for key assistive devices.
To keep totals realistic, results were corroborated with selective bottom-up approximations, including sampled price points by device class, distributor and retailer channel checks, and supplier revenue roll-ups where disclosures exist. Inputs that mattered most included the shift toward powered devices, average selling price progression by manual versus powered categories, reimbursement and accessibility policy changes, replacement cycles for wheelchairs and scooters, and the online versus offline channel mix. For forecasting, we used scenario analysis supported by expert views on policy timing and the pace of electrification, then blended scenarios into a base case that best matched observed shipment and spending signals. When small-country gaps appeared, values were interpolated using nearby market peers with similar age structure and care access, then rechecked against trade and pricing sanity ranges.
Data Validation & Update Cycle
Validation was done through several passes so the final numbers do not depend on one data stream. We compared outputs against independent signals like demographic trajectories, trade directionality, and reported growth commentary from public filings, then investigated outliers until a clear reason was found.
Before sign-off, assumptions are reviewed by another analyst and large variances are traced back to inputs such as price, mix, and replacement timing. When primary feedback suggests a meaningful shift (for example, a reimbursement adjustment or a sudden channel disruption), we re-contact sources and rerun the impacted parts of the model. The report is refreshed annually, and interim updates are made when material events change demand or pricing. Right before delivery, a final review pass is completed so clients receive the most current view available.
Mordor Intelligence's Personal Mobility Devices Market Size Compared Against Other Published Estimates
Published market sizes for personal mobility devices can look far apart, even when the growth direction is similar, because the underlying product list and revenue boundary are not always the same. Differences also show up when one estimate uses a later base year, a different currency timing, or a more aggressive view of powered-device adoption.
The benchmark table shows a clear spread that mainly comes from scope choices, where some publications fold adjacent categories into the total, or count service and rental activity as part of the market. In Mordor Intelligence's model, the total is limited to newly manufactured assistive mobility devices sold to mobility-impaired users, with recreational e-scooters, exoskeletons, rentals, and after-sales services excluded, which can pull the number away from broader definitions.
Benchmark comparison
| Source | Market Size | Gaps in Research Methodology |
|---|---|---|
| Mordor Intelligence | USD 15.71 B (2026) | |
| Industry Publisher A | USD 13.17 B (2025) | Uses an earlier base year and a narrower product framing centered on wheelchairs, walking aids, and mobility scooters, which can undercount lifts and platform-related device revenues when those are treated separately. |
| Data Provider B | USD 13.85 B (2024) | Leans on a broader device basket that can include adjacent categories like medical beds and add-on products, and its CAGR period and base year differ, which shifts the starting point and implied price-mix trajectory. |
Taken together, the table suggests that year selection and what gets counted as a device sale are the two biggest reasons totals differ. By tying the model to repeatable demand signals like aging, care-setting mix, and replacement cycles, and then validating prices and mix through interviews, our estimate stays transparent and easier to reconcile across countries.
Key Questions Answered in the Report
What is the current size of the personal mobility devices market?
The personal mobility devices market size stands at USD 15.71 billion in 2026 and is projected to reach USD 21.11 billion by 2031 at a 6.09% CAGR.
Which product category generates the most revenue?
Wheelchairs lead the product mix with 44.85% revenue share in 2025, underscoring their foundational role across care settings.
What region is growing the fastest?
Asia-Pacific posts the highest regional CAGR at 6.66% through 2031, driven by rapid population aging and rising household incomes.
How are reimbursement policies affecting demand?
Expanded home-care reimbursement in markets such as the United States now covers 80% of approved device costs, boosting uptake among seniors.
What technology trends are reshaping the industry?
Autonomous navigation, power-assist systems, and rare-earth-free motors are ushering in lighter, smarter devices that demand less caregiver intervention.
Are online channels overtaking traditional suppliers?
E-commerce grows at 6.78% CAGR as buyers appreciate home delivery and transparent pricing, yet physical dealers remain vital for fitting and after-sales service.