
Performing Art Companies Market Size and Share
Market Overview
| Study Period | 2020 - 2031 |
|---|---|
| Market Size (2026) | USD 2.88 Billion |
| Market Size (2031) | USD 3.72 Billion |
| Growth Rate (2026 - 2031) | 5.22 % |
| Fastest Growing Market | Asia-Pacific |
| Largest Market | North America |
| Market Concentration | Low |
Major Players *Disclaimer: Major Players sorted in no particular order Image © Mordor Intelligence. Reuse requires attribution under CC BY 4.0. | |
Performing Art Companies Market Analysis by Mordor Intelligence
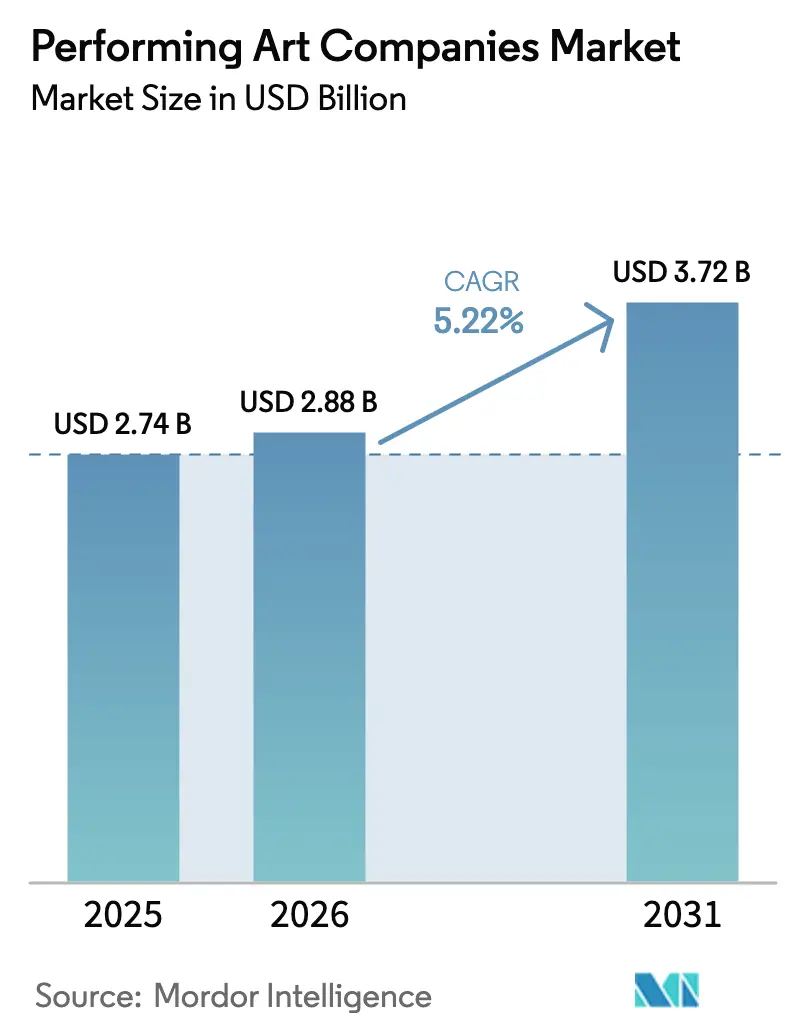
Performing Art Companies Market size in 2026 is estimated at USD 2.88 billion, growing from 2025 value of USD 2.74 billion with 2031 projections showing USD 3.72 billion, growing at 5.22% CAGR over 2026-2031.
The live events industry is witnessing a robust recovery, with ticket sales in North America, the United Kingdom, and Ireland rebounding to 93% of 2019 levels. This recovery highlights the strong consumer demand for in-person cultural experiences, emphasizing the sector's resilience and the continued prioritization of live entertainment by audiences [1]Spektrix, “Ticket Sales Dashboard,” spektrix.com . Corporate sponsorships, government tax incentives, and immersive technology adoption provide additional momentum, while selective consolidation and dynamic pricing strengthen venue economics. At the same time, climate-related disruptions, streaming substitution, and rising production costs present structural headwinds that temper the growth trajectory. The performing art companies market continues to reward players that reduce operating risk, leverage data-driven pricing, and cultivate differentiated audience experiences.
Key Report Takeaways
- By type of performing art, music and opera led with 43.25% of performing art companies' market share in 2025, whereas Dance is projected to expand at a 9.35% CAGR to 2031.
- By venue, traditional theatres accounted for 52.20% of the performing art companies market size in 2025, while Stadiums will post the fastest 7.82% CAGR through 2031.
- By ticket pricing tier, mid-range seats captured 53.60% of the performing art companies market revenue in 2025; Premium tickets represent the fastest-growing band at 6.95% CAGR to 2031.
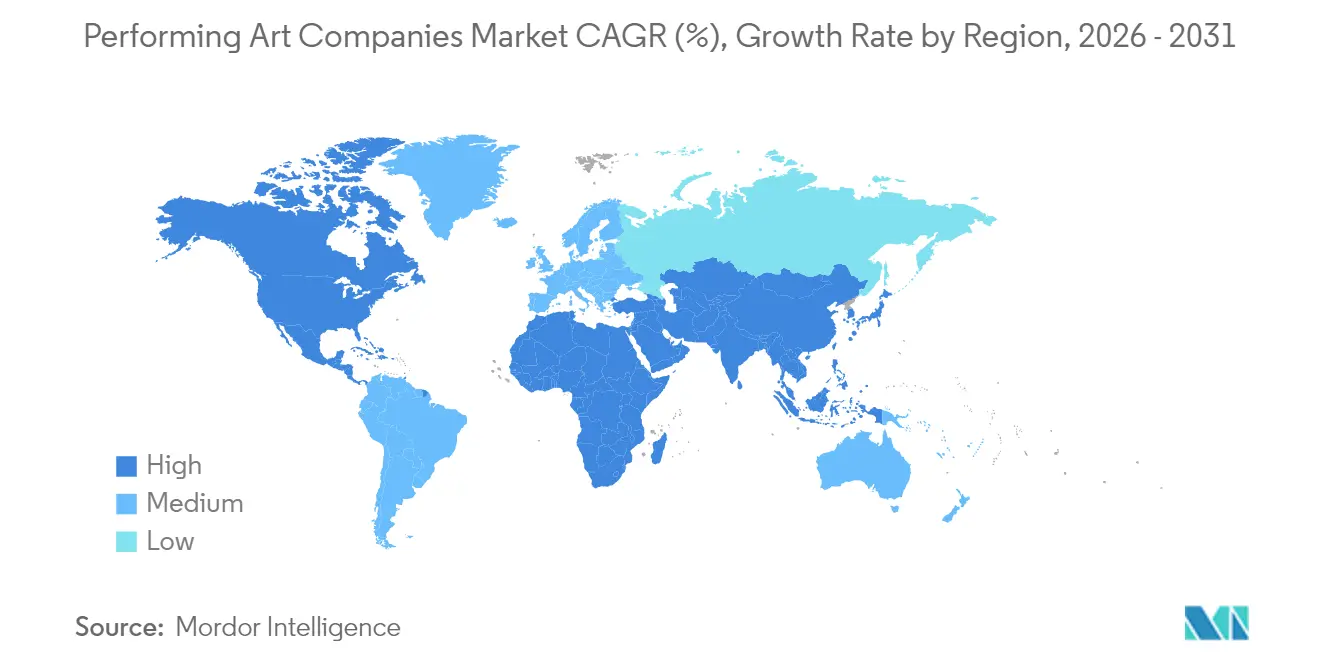
- By region, North America held 37.40% of the performing art companies market share in 2025; Asia-Pacific is set to register the highest 8.05% CAGR through 2031.
Note: Market size and forecast figures in this report are generated using Mordor Intelligence’s proprietary estimation framework, updated with the latest available data and insights as of 2026.
Market Trends and Insights
Drivers Impact Analysis of Performing Art Companies Market*
| Driver | (~) % Impact on CAGR Forecast | Geographic Relevance | Impact Timeline |
|---|---|---|---|
| Post-pandemic rebound in live event attendance | +0.8% | Global; strong in the UK & Ireland | Short term (≤ 2 years) |
| Rise of digital ticketing & dynamic pricing | +0.5% | North America & EU; expanding to APAC | Medium term (2-4 years) |
| Growing corporate sponsorship & brand partnerships | +0.4% | Global metros | Medium term (2-4 years) |
| Government cultural funding & tax incentives | +0.3% | UK, Australia, Brazil, the Middle East | Long term (≥ 4 years) |
| Immersive XR-enabled hybrid performances | +0.2% | North America & EU lead | Long term (≥ 4 years) |
| Expansion in emerging megacities | +0.6% | APAC core; MEA, Latin America spill-over | Long term (≥ 4 years) |
| Source: Mordor Intelligence | |||
Post-pandemic rebound in live event attendance
Live entertainment has re-emerged as a cultural mainstay as consumers seek community experiences unavailable through digital platforms. Ticket sales in the United Kingdom and Ireland now surpass pre-COVID benchmarks, and North America is nearing full recovery. Festival footprints illustrate this resurgence; Edinburgh Festival sold 2.6 million tickets across 3,746 shows in 2024, signalling that large-scale programming can thrive despite cost pressures [2]Culture Hive, “Chicago Symphony Orchestra on Dynamic Pricing,” culturehive.co.uk. Continued momentum depends on venues sustaining health protocols without diminishing the communal atmosphere that differentiates live performance. Operators that invest in customer-confidence measures and seamless on-site experiences are capturing disproportionate demand, reinforcing the performing arts companies’ market as a resilient post-pandemic growth avenue.
Rise of digital ticketing & dynamic pricing
Dynamic pricing has evolved from isolated pilots into a core revenue-management tool. The Chicago Symphony Orchestra expanded its price categories from 13 to 20, adding USD 250,000 annually and boosting subscription retention to 87% [3]GOV.UK, “Permanent Rates of Theatre Tax Relief,” gov.uk . Regulatory initiatives, such as the United States' implementation of the Junk Fees Rule, aim to standardize price disclosures, thereby enhancing transparency in pricing mechanisms. This regulatory framework has increased consumer acceptance of algorithm-driven pricing adjustments by ensuring greater clarity. Venues are now utilizing advanced analytics to incorporate real-time demand metrics, competitor scheduling data, and weather forecasts into their pricing strategies. These data-driven approaches enable performing arts companies to optimize revenue generation, which, in turn, supports the expansion of their market size by facilitating the production of additional performances.
Growing corporate sponsorship & brand partnerships
Sponsorship strategies are increasingly transitioning from traditional philanthropic grants to collaborative and measurable brand activations. UBS's partnership with the Guggenheim Museum exemplifies how financial institutions strategically utilize cultural affiliations to strengthen engagement with affluent clients while simultaneously supporting underrepresented artists. Prominent global corporations, such as J.P. Morgan Chase and ExxonMobil, have allocated multimillion-dollar budgets to performing arts initiatives, highlighting the marketing potential and strategic value of this sector. For companies operating in the performing arts market, these integrated partnerships serve as a means to diversify revenue streams and expand their creative influence, thereby enhancing their overall market positioning and competitive edge.
Government cultural funding & tax incentives
Policymakers in mature and emerging economies recognize the multiplier effects of cultural spending. The United Kingdom will maintain Theatre Tax Relief at 40% for non-touring productions and 45% for touring works from April 2025, easing cost pressures on producers [4]British Theatre Guide, “Edinburgh 2024 in Summary,” britishtheatreguide.info . Australia's expansion of the Producer Offset to encompass high-value drama series and Brazil's continued utilization of the Rouanet Law to attract private capital into cultural projects highlight strategic policy measures aimed at fostering growth in the performing arts market. These initiatives create competitive advantages for these countries by influencing location decisions in favor of jurisdictions with supportive regulatory frameworks, thereby increasing their market share within the performing arts sector.
Restraints Impact Analysis of Performing Art Companies Market*
| Restraint | (~) % Impact on CAGR Forecast | Geographic Relevance | Impact Timeline |
|---|---|---|---|
| Competition from on-demand streaming | -0.7% | Global; acute in North America | Medium term (2-4 years) |
| Rising production & talent-insurance costs | -0.5% | Global; intense in major hubs | Short term (≤ 2 years) |
| Climate-related disruptions to outdoor venues | -0.3% | Global weather-risk regions | Long term (≥ 4 years) |
| Wage inflation from talent unionization | -0.4% | North America, spreading globally | Medium term (2-4 years) |
| Source: Mordor Intelligence | |||
Competition from on-demand streaming entertainment
Streaming platforms are exerting pressure on leisure budgets and significantly reducing traditional release windows, leading to notable shifts in consumer behaviour. Academic research has identified a correlation between Netflix's entry into the U.S. market and a decline in cinema revenues, highlighting potential risks for adjacent live entertainment segments. However, complementary effects remain evident, as empirical studies indicate that live performances can drive increased demand for YouTube streaming by enhancing artist visibility and audience engagement. To address the risk of substitution, companies operating in the performing arts market are adopting strategic differentiation. These strategies include creating immersive and engaging atmospheres, leveraging hybrid live-broadcast formats, and fostering exclusive community-driven experiences that digital platforms are unable to replicate effectively.
Rising production & talent-insurance costs
Broadway production budgets are witnessing substantial increases, while U.K. theatres are contending with rising heating expenses that threaten their operational sustainability. Furthermore, post-pandemic surges in insurance premiums for performance interruption coverage have intensified financial pressures across the industry. These cost escalations are forcing producers to make strategic decisions, either by absorbing the additional overhead or passing it on to consumers, which could potentially influence market demand. In this challenging environment, implementing robust cost management frameworks and leveraging tax-relief opportunities have become imperative for ensuring profitability and sustaining competitiveness in the performing arts market.
*Our forecasts treat driver/restraint impacts as directional, not additive. The impact forecasts reflect baseline growth, mix effects, and variable interactions.
Performing Art Companies Market Segment Analysis
By Types of Performing Arts:
Music Dominance Drives InnovationMusic and Opera claimed 43.25% of performing art companies' market share in 2025, leveraging touring scalability and cross-brand collaborations that extend revenue beyond single venues. The segment’s standardized technical requirements ease replication across markets, underpinning its lead in the performing arts companies market size. Dance, by contrast, posts the fastest 9.35% CAGR on the strength of visually dynamic choreography popularized through social media, which broadens reach to younger demographics. Theatre maintains stable volumes through subscription models and institutional subsidies, whereas Circus and Other Art Forms benefit from experiential tourism demand.
Technological advancements are significantly transforming the segment landscape. For instance, Stanford University's real-time AI script generator facilitates the creation of adaptive narratives, enhancing the efficiency and customization of content production. Similarly, Dresden's AI-composed opera aria exemplifies the potential of artificial intelligence in pushing the boundaries of artistic innovation. The increasing adoption of hybrid formats is further dissolving traditional disciplinary boundaries, compelling companies operating in the performing arts market to strategically reassess and refine their positioning to remain competitive and relevant in this evolving environment.


By Venue Type:
Stadium Economics Reshape IndustryTraditional Theatres captured 52.20% of revenue in 2025 by capitalizing on subscription loyalty and flexible programming that spans genres. Stadiums, however, are scaling fastest at 7.82% CAGR as headline artists adopt large-format residencies that concentrate earnings per show. Adele’s 10-night Munich run in a bespoke 73,000-seat structure illustrates how stadium economics generate destination tourism and ancillary local spend.
Concert Halls occupy an acoustic niche, serving classical and jazz aficionados who value sound integrity. Sadler’s Wells East, a newly established multi-purpose venue, has implemented a strategic pricing model that combines community engagement with commercial viability. By offering half of its tickets at or below standard market rates, the venue ensures accessibility for local communities while simultaneously attracting revenue through high-profile international productions. This approach balances social responsibility with financial sustainability, positioning the venue as both an inclusive cultural hub and a competitive player in the global entertainment market. These hybrids show that profitability and inclusion can coexist, encouraging broader adoption throughout the performing arts companies market.

By Ticket Pricing:
Premium Growth Signals Market SophisticationMid-range tickets retained 53.60% of the performing art companies market size in 2025, balancing affordability and profitability. Premium tiers, featuring backstage access and luxury hospitality, will expand at a 6.95% CAGR through 2031 thanks to affluent consumers’ preference for exclusivity. Economy seats allow venues to cultivate future audiences, yet dynamic pricing converts fixed discounts into yield-optimized inventory.
Advanced algorithms, similar to those utilized in the airline industry, are now enabling demand segmentation with a high degree of precision. The Chicago Symphony Orchestra's implementation of a multi-band pricing model exemplifies an effective strategy for generating incremental revenue while maintaining the loyalty of core patrons. As the adoption of data-driven pricing strategies increases across the performing arts market, the proportion of premium offerings is expected to grow, contributing to enhanced overall profit margins within the market.

Geography Analysis
North America Performing Art Companies Market
North America generated 37.40% of 2025 revenue on the back of Broadway’s global brand recognition and an extensive corporate sponsorship network. Live Nation Entertainment manages an extensive portfolio of venues and facilitates the sale of over 620 million tickets annually. This operational scale underscores the company’s ability to leverage regional advantages, enhancing its market presence and competitive edge within the global live entertainment industry. The company’s expansive reach and ticketing capabilities position it as a dominant player, driving growth and reinforcing its leadership in the sector. Yet the U.S. Department of Justice antitrust suit filed in May 2024 challenges vertical integration and could democratize promoter competition. To sustain growth, North American operators are refining dynamic pricing, climate-proofing venues, and enhancing community outreach, all critical to maintaining share in the performing arts companies market.
APAC Performing Art Companies Market
Asia-Pacific stands as the fastest-growing territory, with an 8.05% CAGR through 2031 propelled by massive cultural infrastructure investments. From 1998 to 2015, China constructed 360 grand theatres, significantly exceeding the total built in Europe over the past 70 years. The growing prominence of concert tourism further drives market demand. For instance, Taylor Swift's residency in Singapore is anticipated to contribute hundreds of millions of dollars to the local GDP, highlighting the economic impact of such events. Additionally, the emergence of megacities provides densely populated consumer bases, ensuring a steady stream of growth opportunities for companies operating within the performing arts market.
Mordor Intelligence provides coverage of the performing art companies market across other key regional markets, including North America, each with their regulatory frameworks and demand patterns.

Regulatory Landscape
Regulation in the performing art companies market is shaped by competition policy, ticketing transparency, and labor relations that affect touring economics and venue contracting. In the United States, the Department of Justice action involving Live Nation Entertainment and Ticketmaster remains a key overhang, with a tentative settlement announced in March 2026 and a Tunney Act review process underway. The proposed framework would extend the consent decree, require the divestiture of venues, cap service fees at those venues, and mandate interoperability between Ticketmaster and third-party ticketing platforms.
Across other major markets, sector rules are influenced by employer organizations and collective bargaining, which set standards on wages, scheduling, and production practices. Live Performance Australia operates as a registered employer organization under the Fair Work Act, and in the United Kingdom, the Independent Theatre Council functions as a management association enabling negotiations with trade unions.
Value Chain Analysis
The performing arts value chain includes four core functions: Creation, Production, Dissemination or trade, and Exhibition or reception. Key participants include artists, artist managers, booking agents, concert promoters, venue operators, ticketing platforms, and technical suppliers that support audience access.
Value is captured through how licensing, performance rights, and on-site experiences are monetized across these actors. Music publishers and performing rights organizations also enable licensing for ancillary uses. In 2026, the March 2026 US DOJ action against Live Nation and Ticketmaster highlights the importance of interoperability and fair access within ticketing and promotion layers, which in turn shapes how the value chain captures value through distribution and pricing strategies.
Competitive Landscape
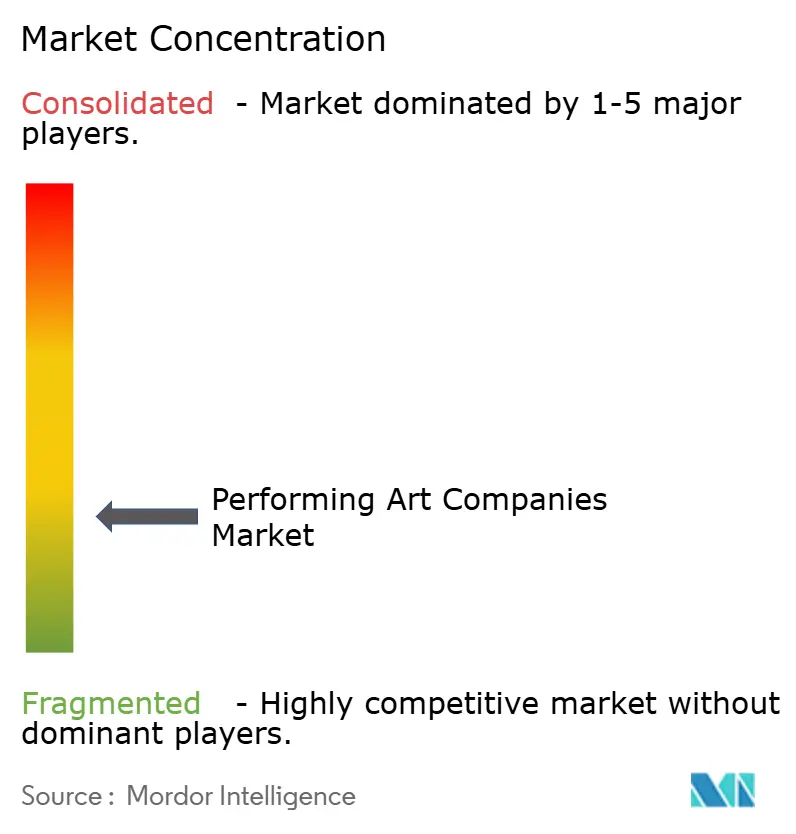
The performing art companies’ market is moderately fragmented; the five largest entities command only one-fourth of the combined share, leaving ample room for niche innovators. Live Nation Entertainment’s vertically integrated model faces regulatory headwinds after the May 2024 DOJ antitrust filing, which could dismantle its promoter-ticketing stronghold and expand opportunities for smaller operators. AEG’s divestiture of ASM Global to Legends consolidates venue management and hospitality expertise, signalling a strategic realignment toward end-to-end service platforms.
Private capital continues to flock to technology-enabled service providers. Goldman Sachs’ majority acquisition of TAIT underscores confidence in production automation and immersive tech to differentiate live shows. Start-ups specializing in XR overlays, AI-generated content, and climate-adaptive stage design are carving out defensible niches by solving pain points incumbents overlook. Meanwhile, unions secure wage increases and AI protections, pressing management to optimize costs and expand high-margin offerings. The performing art companies’ market, therefore, rewards agility, technological adoption, and regulatory fluency.
Performing Art Companies Industry Leaders
Live Nation Entertainment
Cirque du Soleil Entertainment Group
Ambassador Theatre Group
Shubert Organization
AEG Presents (Anschutz Entertainment Group)
- *Disclaimer: Major Players sorted in no particular order
Performing Art Companies Market Companies Covered in this Report
- Live Nation Entertainment
- AEG Presents (Anschutz Entertainment Group)
- Cirque du Soleil Entertainment Group
- Ambassador Theatre Group
- Shubert Organization
- Nederlander Organization
- Stage Entertainment
- Disney Theatrical Group (The Walt Disney Company)
- Royal Opera House
- Metropolitan Opera
- National Theatre (UK)
- Paris Opera Ballet
- Bolshoi Theatre
- Berlin Philharmonic Foundation
- Sydney Opera House Trust
- Lincoln Center for the Performing Arts
- National Centre for the Performing Arts (China)
- Shanghai Grand Theatre Co.
- Tokyo Ballet Company
- Royal Shakespeare Company

Market Opportunities and Future Outlook
Public comments on the U.S. Department of Justice antitrust settlement with Live Nation and Ticketmaster are open until September 4, 2026, indicating continued engagement around ticketing accessibility and competition. That environment supports opportunities for alternative ticketing providers, venue-led primary ticketing strategies, and operators seeking more flexible ticketing terms while maintaining price transparency.
Immersive and hybrid experiences are also expanding audience reach. Cirque du Soleil partnered with Cosm in 2026 to bring Mystere into a shared-reality format at Cosm locations, showing how intellectual property can be monetized through venue-technology partnerships. International venue-network expansions, alongside labor and touring frameworks supported by labor bodies, further enable broader cross-border programming.
Recent Industry Developments in Performing Art Companies Market
- July 2026: Live Nation Entertainment formed a joint venture named radia with Oak View Group and SURJ Sports Investment to develop and operate live entertainment infrastructure in Saudi Arabia. The launch expands Live Nation's regional footprint and underscores a push into Middle East venue development with partner-backed capacity.
- June 2026: Live Nation Entertainment acquired a majority stake in Movistar Arena Buenos Aires. The deal secures strategic ownership of a key South American venue. It reinforces LATAM market leverage and data-driven pricing capabilities.
- May 2026: Live Nation Entertainment reported completion of three venue acquisitions: Movistar Arena Santiago, Unipol Forum Milan, and IMPACT Arena Bangkok. The portfolio expansion increases capacity and geographic diversification. It enhances revenue opportunities across regions through a broader global venue network.


Performing Art Companies Market Report Scope and Research Methodology
Market Definition and Coverage
For this study, the market covers revenues generated by performing art companies from live and staged productions, including ticketed events and closely linked revenue streams tied to putting on performances across major regions.
Scope exclusions: Adjacent entertainment activities that do not involve staged performing arts company-led productions (such as spectator sports and pure venue rental without programming) are excluded.
Segments Covered in This Report
- By Types of Performing Arts
- Theater
- Music and Opera
- Dance
- Circus and Other Art Forms
- By Venue Type
- Concert Halls
- Theatres
- Stadiums
- By Ticket Pricing
- Premium
- Mid-range
- Economy
- By Geography
- North America
- Canada
- United States
- Mexico
- South America
- Brazil
- Peru
- Chile
- Argentina
- Rest of South America
- Europe
- United Kingdom
- Germany
- France
- Spain
- Italy
- BENELUX
- NORDICS
- Rest of Europe
- Asia-Pacific
- India
- China
- Japan
- Australia
- South Korea
- South East Asia
- Rest of Asia-Pacific
- Middle East & Africa
- United Arab Emirates
- Saudi Arabia
- South Africa
- Nigeria
- Rest of Middle East & Africa
- North America
Data Sources, Market Sizing, and Validation
Desk Research
Desk work started with mapping what drives demand for live performances, and where public data can reliably show ticketed activity and spending. We used sources such as the US Bureau of Economic Analysis, the US Bureau of Labor Statistics, the National Endowment for the Arts, UNESCO Institute for Statistics, and OECD cultural indicators to anchor macro conditions that influence attendance and discretionary spend.
To translate those signals into market inputs, we also reviewed company filings and investor presentations for revenue mix cues, along with association and venue operator releases, reputable press coverage, and publicly available event and attendance summaries. Where needed, paid subscriptions were used only to speed up company financials screening, patent and IP lookups linked to show technologies, and targeted news and financial tracking for major events that can shift demand. The sources listed here are illustrative, and many other public and paid references were consulted to collect, cross-check, and clarify data.
Primary Interviews and Surveys
Primary work focused on validating how performing art companies earn revenue in practice and how pricing moves with seat quality, show type, and seasonality. We spoke with a mix of company executives, touring and programming leaders, venue and promoter-side contacts, and managers who track budgets and sell-through, covering APAC, EMEA, and the Americas to stress-test assumptions and fill gaps left by public reporting.
Distribution of primary research fieldwork respondents
| Company type | Respondent position | Region |
|---|---|---|
| Top tier: 35% | CXOs: 16% | APAC: 46% |
| Mid tier: 46% | Functional/Unit leaders: 28% | EMEA: 33% |
| Smaller Players: 19% | Managers: 56% | Americas: 21% |
Market-Sizing & Forecasting
Sizing was built using top-down and bottom-up logic, with the main total reconstructed from demand-side signals that are easier to observe across countries. We first estimated the addressable pool using indicators like live performance attendance recovery, household recreation spend, tourism and city-event activity, and venue capacity utilization patterns, which are then converted into revenue using ticket pricing tiers and typical show frequency.
Those totals were then checked against selective bottom-up approximations, where publicly visible revenues of leading operators, sampled ticket price times estimated attendance, and channel checks with venues helped us validate magnitude and adjust for underreported small players. Where company revenue splits were unclear, gaps were handled by applying conservative ranges for ticket share versus sponsorship, merchandising, and rights, followed by a second pass using interview feedback.
For forecasting, we relied on scenario analysis supported by a light multivariate regression on drivers that matter most to this market, including real disposable income trends, leisure spending, touring schedules, and premium ticket mix. Assumptions were kept consistent in USD terms, with currency conversion timing aligned to the study year so growth is not overstated by short-term FX swings.
Data Validation & Update Cycle
Model outputs were validated through multiple checks, starting with internal consistency reviews across regions and cross-checks against independent signals like venue utilization commentary, attendance indicators, and reported ticket price movement. Outliers were flagged, investigated, and corrected when they traced back to one-off events, unusual touring cycles, or mismatched scope.
Before sign-off, assumptions and calculations go through multi-step analyst review, and respondents are re-contacted when a key input moves outside an expected range. The report is refreshed annually, and interim updates are made when material events shift demand or pricing, followed by a final pre-delivery review to ensure clients receive the latest view.
Mordor Intelligence's Performing Art Companies Market Size Versus Other Published Estimates
Published market numbers for performing art companies can vary widely because the boundary around what counts as a performing art company is not consistent, and because revenue can be counted at the company level or at the broader live entertainment ecosystem level. Differences also show up when studies mix in venue rental, sports, or general events, or when they use different base years and currency timing.
By tracking ticket pricing tiers and venue type splits, and then refreshing key assumptions through structured expert checks, Mordor Intelligence keeps the model tied to performing art company-led production revenues rather than wider live entertainment turnover.
Benchmark comparison
| Source | Market Size | Gaps in Research Methodology |
|---|---|---|
| Mordor Intelligence | USD 2.88 B (2026) | |
| Industry Database A | USD 21.20 B (2025) | Uses an industry revenue view that is closer to national NAICS-style totals, which can bundle spectator sports, venues, and related activities, and it is not aligned to the same global scope or year. |
| Global Publisher B | USD 200.00 B (2024) | Appears to include a much broader live entertainment spend pool and may mix company revenues with event ecosystem revenues, which inflates totals versus a performing art companies-only definition. |
The table shows that the spread mostly comes from scope, especially whether the estimate isolates performing art companies or expands into wider live events and related industries. Our approach stays repeatable because the totals are built from clear demand and pricing drivers, and the checks make it easier to explain each adjustment when the market is recalculated.


Key Questions Answered in the Report
How large is the performing arts companies market in 2026?
The performing art companies market size stands at USD 2.88 billion in 2026 and is projected to reach USD 3.72 billion by 2031.
What is the expected growth rate for performing arts companies through 2031?
The market is forecast to grow at a 5.22% CAGR from 2026 to 2031.
Which performing art segment grows fastest over the forecast period?
Dance is projected to post a 9.35% CAGR, making it the fastest-growing discipline.
Which geographic region will lead growth?
Asia-Pacific is expected to register the highest regional CAGR at 8.05% through 2031.
How are venues using technology to boost revenue?
Dynamic pricing algorithms and immersive XR experiences help venues capture additional revenue and differentiate the live offering.
What regulatory factors could reshape competition?
The U.S. Department of Justice antitrust action against Live Nation may open ticketing and promotion to greater competition, affecting market dynamics.
Page last updated on:


 Your data is secure and never sold or shared.


