
Peracetic Acid Market Size and Share
Market Overview
| Study Period | 2021 - 2031 |
|---|---|
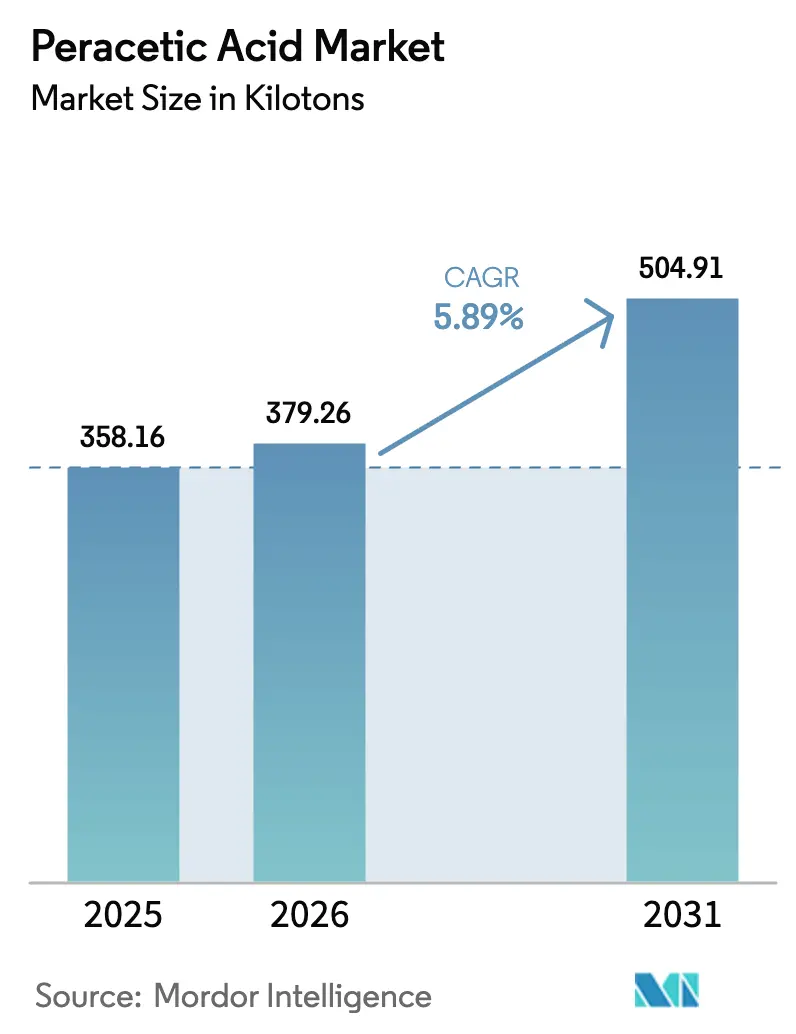
| Market Volume (2026) | 379.26 kilotons |
| Market Volume (2031) | 504.91 kilotons |
| Growth Rate (2026 - 2031) | 5.89 % |
| Fastest Growing Market | Asia Pacific |
| Largest Market | Asia Pacific |
| Market Concentration | Medium |
Major Players *Disclaimer: Major Players sorted in no particular order Image © Mordor Intelligence. Reuse requires attribution under CC BY 4.0. | |
Peracetic Acid Market Analysis by Mordor Intelligence
The Peracetic Acid Market size is expected to increase from 358.16 kilotons in 2025 to 379.26 kilotons in 2026 and reach 504.91 kilotons by 2031, growing at a CAGR of 5.89% over 2026-2031. Heightened food-safety rules, stricter wastewater discharge limits, and the push toward non-halogenated chemistries have become the decisive growth engines. Large food and beverage processors, municipal utilities, and healthcare facilities are converting chlorine or chlorine-dioxide lines to liquid peracetic acid, which simplifies compliance with pathogen-control mandates and eliminates trihalomethanes. The shift also benefits from hydrogen-peroxide capacity additions in India and China that improve regional feedstock security. Competitive intensity sits at a moderate level because registered no-rinse formulations require significant regulatory investment, making it hard for small suppliers to penetrate branded food and pharmaceutical accounts.
Key Report Takeaways
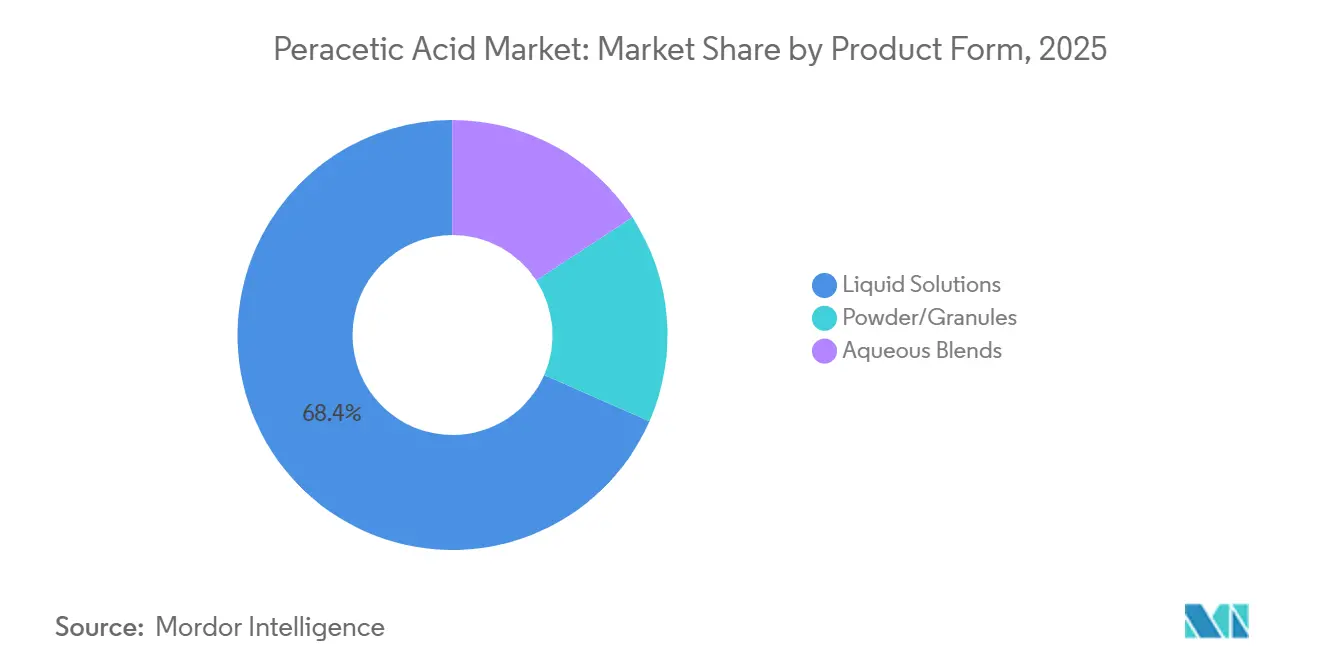
- By product form, liquid solutions led with 68.44% share in 2025; aqueous blends are projected to expand at a 6.12% CAGR to 2031.
- By concentration grade, medium range (5–15% PAA) products accounted for 54.31% of the peracetic acid market share in 2025, while the same grade is forecast to grow at a 6.23% CAGR through 2031.
- By application, disinfectants commanded a 45.89% share of the peracetic acid market size in 2025 and are advancing at a 6.45% CAGR to 2031.
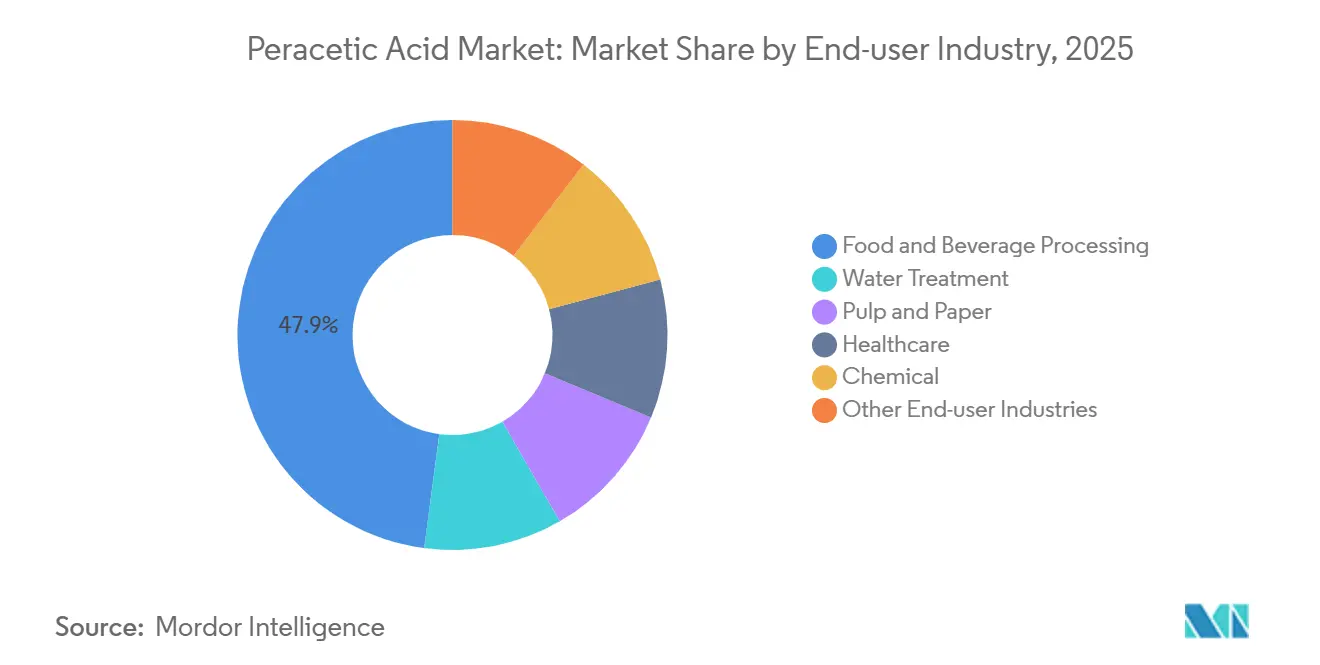
- By end-user industry, food and beverage processing captured a 47.89% share in 2025; the segment is expanding at a 6.44% CAGR to 2031.
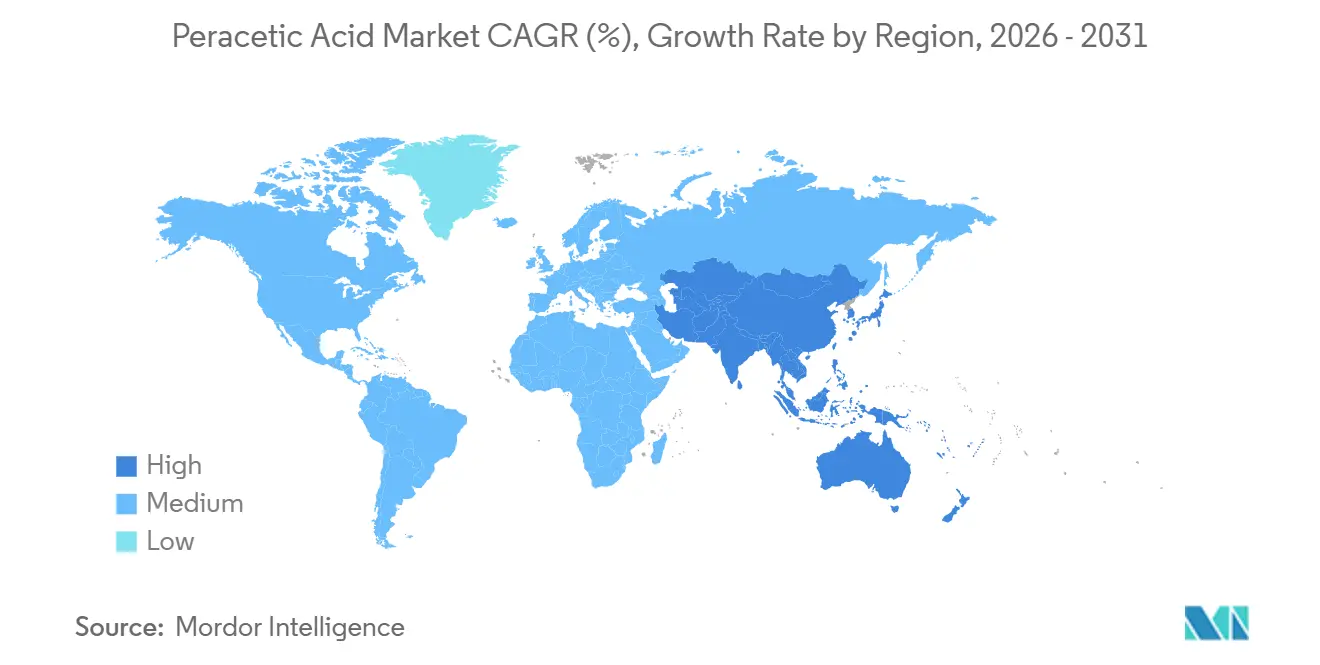
- By geography, Asia-Pacific contributed 38.67% volume in 2025 and is growing at 6.80% CAGR through 2031, outpacing all other regions.
Note: Market size and forecast figures in this report are generated using Mordor Intelligence’s proprietary estimation framework, updated with the latest available data and insights as of January 2026.
Market Trends and Insights
Drivers Impact Analysis of Peracetic Acid Market*
| Drivers | (~) % Impact on CAGR Forecast | Geographic Relevance | Impact Timeline |
|---|---|---|---|
| Food-safety regulations boosting food and beverage sanitation | +1.8% | Global, with concentration in North America, EU, and APAC urban centers | Medium term (2-4 years) |
| Demand surge from municipal and industrial water treatment | +1.5% | North America, Europe, APAC coastal provinces | Long term (≥ 4 years) |
| Shift from chlorine to eco-friendly pulp bleaching agents | +0.9% | North America, Nordic Europe, Brazil | Long term (≥ 4 years) |
| Growth in low-temperature sterilization of medical devices | +1.1% | Global, led by North America and Western Europe | Medium term (2-4 years) |
| Craft-brewery adoption in cold clean-in-place cycles | +0.6% | North America, Western Europe, Australia | Short term (≤ 2 years) |
| Source: Mordor Intelligence | |||
Food-Safety Regulations Boosting Food and Beverage Sanitation
In 2024-2025, regulators revised rules for direct-contact sanitizers, mandating processors to present validated log-reduction data during third-party audits. The USDA's Food Safety and Inspection Service has now mandated proof of efficacy against Listeria on the surfaces of ready-to-eat meats. Meanwhile, the EU's Biocidal Products Regulation has set a cap on in-plant PAA usage, aligning with no-rinse lines.[1] Addressing spoilage losses, India's FSSAI has approved PAA for post-harvest produce. These collective regulations lean toward favoring liquid grades, as processors can utilize them in-line without the need for costly dilution equipment. In light of these developments, equipment manufacturers have integrated real-time sensors to monitor PAA strength, aiding plants in bridging audit gaps and accelerating the adoption of the disinfectant in high-throughput facilities.
Demand Surge from Municipal and Industrial Water Treatment
The U.S. Environmental Protection Agency lowered allowable chlorine residuals in 2024, pushing utilities toward a chemistry that breaks down into oxygen and acetic acid rather than halogenated by-products. Parallel moves in the EU and coastal China added momentum as aquaculture discharge began mixing with urban effluent, making non-halogenated disinfectants attractive. PAA offers 3-log Cryptosporidium control at contact times that match chlorine yet sidesteps trihalomethane limits. Industrial adopters in pulp and food plants also prefer PAA in cooling-tower loops where chlorine dioxide storage generates explosion risks. These factors jointly underpin the 6.45% CAGR projected for disinfectant use through 2031.
Shift from Chlorine to Eco-Friendly Pulp Bleaching Agents
North American and Nordic European mills have begun substituting chlorine dioxide stages with PAA, achieving a significant reduction in adsorbable organic halide loads. This move not only aligns with stringent discharge permits but also aids in securing premium certifications from the Forest Stewardship Council. Despite PAA's higher cost compared to in-situ chlorine dioxide, integrated mills, burdened by hefty environmental fees, deem the transition economically viable. Brazil's eucalyptus pulp producers conducted PAA trials to align with European Union deforestation compliance mandates. However, widespread adoption is contingent on the domestic availability of hydrogen peroxide. As a result, while there's a notable uptick in volume, it's predominantly seen in the high-margin specialty pulp sector, rather than in commodity grades.
Growth in Low-Temperature Sterilization of Medical Devices
In 2024, hospitals ramped up installations of automated PAA sterilizers. This shift was driven by the realization that steam autoclaves can degrade both flexible endoscopes and robotic tools. With cycle times below 55 °C, hospitals can now achieve same-day device turnarounds, effectively alleviating procedure backlogs. The CDC has reclassified PAA as a high-level disinfectant, endorsing its use for sterilization. Meanwhile, Japan’s health ministry has expanded PAA approvals to include pharmaceutical cleanrooms. In a strategic move, Mitsubishi Gas Chemical has restructured its hygiene group to target the hospital sector. However, overall consumption remains modest.
Restraints Impact Analysis of Peracetic Acid Market*
| Restraints | (~) % Impact on CAGR Forecast | Geographic Relevance | Impact Timeline |
|---|---|---|---|
| Occupational hazards and handling challenges | -0.7% | Global, acute in regions with limited industrial hygiene infrastructure | Short term (≤ 2 years) |
| High cost versus chlorine-based substitutes | -0.9% | Price-sensitive markets in South America, Middle East, Africa, and South Asia | Medium term (2-4 years) |
| Volatility of key precursors (acetic anhydride, H₂O₂) | -0.6% | Global, with supply concentration in China and Gulf Cooperation Council states | Medium term (2-4 years) |
| Source: Mordor Intelligence | |||
Occupational Hazards and Handling Challenges
Under OSHA rules, PAA concentrations exceeding 15% are deemed corrosive, necessitating secondary containment and personal protective equipment[2]. Heat speeds up PAA decomposition, and retrofitting with vented storage tanks can inflate budgets. Such financial and safety challenges are particularly burdensome for small processors in emerging economies, hindering their global expansion.
High Cost Versus Chlorine-Based Substitutes
In 2025, liquid PAA commanded prices significantly higher than sodium hypochlorite. Despite this premium, many utilities across Latin America and the Middle East continue to favor hypochlorite. This preference stems from the total cost of ownership for PAA, which, when factoring in training and storage, remains higher over a decade. Furthermore, early 2024 price hikes in Europe exacerbated this price gap, leading to delays in transitioning to PAA for pulp bleaching and industrial water treatment.
*Our forecasts treat driver/restraint impacts as directional, not additive. The impact forecasts reflect baseline growth, mix effects, and variable interactions.
Peracetic Acid Market Segment Analysis
By Product Form (Liquid Solutions Dominate Ease of Use Applications)
Liquid solutions accounted for 68.44% volume in 2025, reflecting compatibility with legacy dosing pumps across food plants and wastewater treatment works. This dominance anchors the peracetic acid market size at the plant-level because retrofits involve little more than adjusting metering rates. Demand for aqueous blends is rising at a 6.12% CAGR because stabilizers inside these blends reduce corrosion on stainless steel in aseptic packaging lines.
Aqueous formats appeal to greenfield dairy, juice, and pharmaceutical plants that order integrated monitoring hardware. Powder and granule forms hold a niche share, mainly disaster-relief sanitation and seasonal pond treatment, where lower freight cost outweighs the need for on-site dissolution. Suppliers continue to focus research and development on extending blend shelf life, because longer storage pairs well with global shipping lanes and remote users. Consequently, liquid solutions will keep a majority share, though gains for blends will chip away at the margin as new installations favor corrosion-mitigated chemistries.

By Concentration Grade (Medium Range Balances Efficacy and Safety)
Medium Range (5–15% PAA) held 54.31% volume in 2025 and is projected to grow at a 6.23% CAGR through 2031, ensuring the highest peracetic acid market share among concentration tiers. The grade achieves a rapid microbial kill, sidestepping the stringent handling rules that come into play for concentrates exceeding 15%. In 2024, the FDA issued guidance indicating that processors can attain validated reductions in just 60 seconds with this concentration, underscoring its appeal for fast-paced meat and dairy operations.
Municipal plants, equipped with automated dilution skids, predominantly utilize high-concentration products. Lower-concentration grades are favored for washing post-harvest produce, thanks to their no-rinse properties and lenient transportation regulations. However, widespread adoption of high-concentration products faces hurdles; the need for additional ventilation and storage drives up net savings, making them less attractive. In the grand scheme, while medium concentrations are set to maintain their dominance, users are increasingly gravitating towards either end of the spectrum—dilute or concentrate—tailoring their choice to specific applications.
By Application (Disinfectants Lead Growth Across Water and Food Sectors)
Disinfectants occupied 45.89% of 2025 demand and are advancing at a 6.45% CAGR, anchoring the fastest-growing line within the peracetic acid market. Water utilities select PAA to meet 0.011 mg/L chlorine residual caps while maintaining 3-log Cryptosporidium control. In food plants, daily clean-in-place cycles consume liters of solution, dwarfing the milliliter volumes used for hospital sterilant cycles.
Sterilants, though smaller in tonnage, yield premium pricing due to stringent validation in hospitals and pharmaceutical suites. Oxidizer demand in pulp mills is rising only where discharge permits penalize chlorine dioxide. Bleaching agents for textiles and agriculture make up residual niches with flat volume trajectories. Suppliers, therefore, frame marketing around turnkey disinfectant packages that bundle real-time probes and cloud data logging, enabling end users to certify performance without adding headcount.
By End-User Industry (Food and Beverage Processing Anchors Demand)
Food and beverage processors controlled 47.89% of the 2025 volume and are set for a 6.44% CAGR through 2031, the fastest track among all industries. Daily sanitation frequency, strictly enforced hazard-analysis programs, and ample capital budgets allow rapid changeovers from chlorine to PAA. Cold clean-in-place adoption in craft breweries and energy-intensive dairy plants deepens chemical demand by eliminating the need for heated caustic rinses.
Water treatment ranks second, driven by municipal retrofit projects funded under state revolving loan programs in the United States and similar mechanisms in Europe. Pulp and paper, under pressure to cut AOX emissions, employs PAA for premium brightness grades but still represents smaller volumes. Healthcare’s device-reprocessing niche enjoys double-digit value growth; however, absolute tonnage remains low because a hospital uses only a few hundred liters per year. Aquaculture and agriculture form emerging micro-segments where residue-free treatment mitigates antibiotic resistance concerns.
Geography Analysis
APAC Peracetic Acid Market
Asia-Pacific captured 38.67% of the 2025 volume and is growing at a 6.80% CAGR, the fastest regional trajectory. New hydrogen-peroxide capacity in Gujarat and Shanghai shortens supply lines and trims delivered costs for local formulators. China’s tougher biochemical-oxygen-demand limits push coastal cities to favor PAA over sodium hypochlorite, especially where aquaculture discharge merges with municipal wastewater. India’s food regulators backed PAA for fruit and vegetable treatment, opening a high-volume channel because cold-chain gaps cause double-digit spoilage losses. Japan broadened pharmaceutical approvals, moving the chemistry into cleanroom disinfection work.
North America and Europe Peracetic Acid Market
North America and Europe represent mature but steady terrain. The U.S. EPA’s tighter residual-chlorine ceiling in 2024 triggered spending on injection skids, yet infrastructure turnover limits growth to mid-single digits. European suppliers face energy-linked cost inflation, slowing switches in price-sensitive pulp bleaching, although Article 95 listing under the EU Biocidal Products Regulation reinforces long-term confidence. Craft breweries on both continents improved efficiency by embracing cold PAA CIP, cutting energy and water use.
South America and MEA Peracetic Acid Market
South America, the Middle East, and Africa remain volume laggards because budget constraints favor cheaper chlorination. Brazil’s premium eucalyptus pulp segment is piloting PAA to satisfy European buyers wary of deforestation, yet full commercialization depends on affordable feedstock. Gulf State desalination projects allocated funds for PAA biocide dosing, indicating incremental gains where energy-free disinfection aligns with low-temperature reverse-osmosis pretreatment. Across these regions, regulatory gaps and capital scarcity temper the pace of adoption.
Regulatory Landscape
Peracetic acid demand is shaped by biocidal product approvals and tighter verification of efficacy and residual monitoring in food, water, and industrial hygiene. In the European Union, the Biocidal Products Regulation (BPR, Regulation (EU) 528/2012) continues to govern both active-substance status and product authorizations, including pathways for in situ generation. In June 2025, Regulation (EU) 2025/1260 approved peracetic acid generated in situ from 1,3-diacetyloxypropan-2-yl acetate and hydrogen peroxide as an existing active substance, which supports supplier investment in documented, audit-ready no-rinse formulations.
Product authorization milestones also reinforce the compliance burden and the value of established dossiers. In June 2025, UCO Group BV received Union authorization for a peracetic-acid biocidal product family covering product-types 2, 3, and 4, and in April 2026 BIOXAL SA received Union authorization for Bioxal-Soproper (product-type 2), highlighting the role of EU-wide approvals for multi-country go-to-market. In the United States, antimicrobial registrations remain governed by EPA processes and fees under PRIA 5 (FY 2025-2026 schedule). Separately, the Clean Water Act Methods Update Rule 22 proposal (January 2025) to include Standard Method 4500-PAA for residual peracetic acid measurement strengthens the measurement and reporting backbone for wastewater and industrial effluent programs where PAA is used as a chlorination alternative.
Value Chain Analysis
The peracetic acid value chain starts with upstream feedstocks, primarily acetic acid and hydrogen peroxide, with acid catalysts used in production. Supply security for hydrogen peroxide is a central cost and availability lever, and the market structure favors producers with integrated or assured peroxide supply, consistent with the report context noting new hydrogen-peroxide capacity in India and China that improves regional feedstock security.
Midstream participants manufacture stabilized liquid concentrates and aqueous blends, or supply systems for on-site generation to reduce transportation and handling risks for higher-strength oxidizers. Downstream, peracetic acid is distributed through direct sales to large food and beverage processors, municipal and industrial water utilities, pulp and paper mills, and healthcare device-reprocessing and cleanroom operators, often bundled with dosing equipment, real-time probes, and data logging to support audit documentation. Logistics and stewardship also remain key differentiators, since decomposition risk and corrosivity requirements intensify above 15% concentrations, shaping how suppliers position medium-range products and service models across end users.
Competitive Landscape
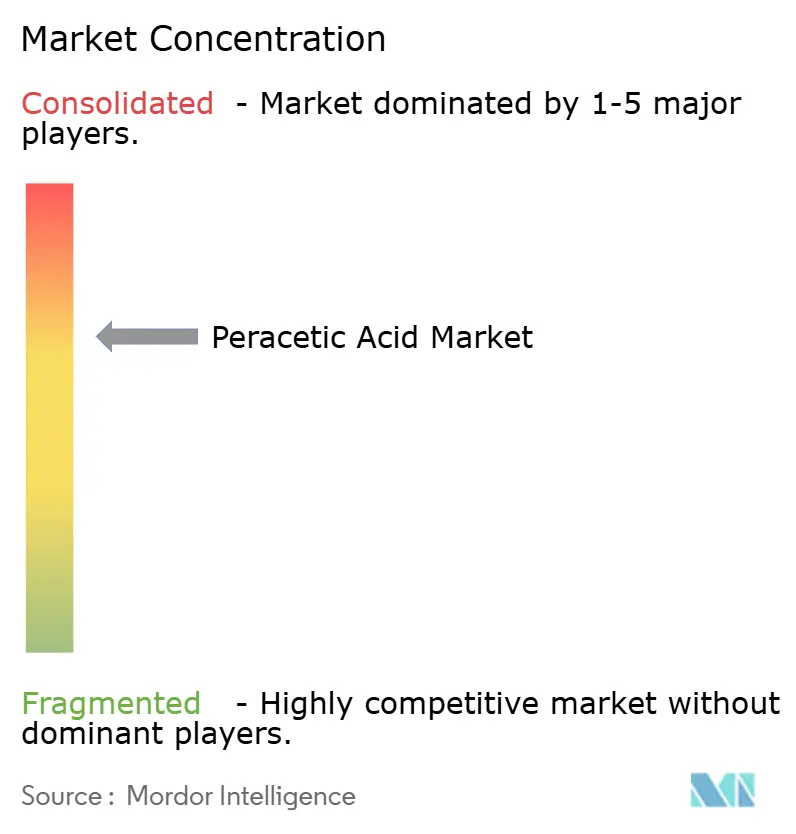
The market is moderately fragmented. Integrated Asian producers leverage captive hydrogen-peroxide units to discount price, but they often lack the documentation and field support required by global beverage or hospital auditors. Pricing power fluctuates with feedstock. Evonik raised European tags by 8–12% in March 2024 after electricity costs inflated hydrogen-peroxide margins. Conversely, vertically integrated Indian and Chinese firms passed through only modest increases, capturing regional share. The strategic picture emphasizes product stewardship, real-time monitoring tech, and regulatory alignment over brute volume expansion.
Peracetic Acid Industry Leaders
-
Enviro Tech Chemical Services, Inc.
-
Solvay
-
Evonik Industries AG
-
Ecolab
-
Kemira
- *Disclaimer: Major Players sorted in no particular order
Peracetic Acid Market Companies Covered in this Report
- ACURO ORGANICS LIMITED
- Aditya Birla Chemicals
- Airedale Group
- Biosan
- Brainerd Chemical
- Christeyns
- Diversey, Inc.
- Ecolab
- Enviro Tech Chemical Services, Inc.
- Evonik Industries AG
- Hydrite Chemical
- Jubilant Pharmova Limited
- Kemira
- MITSUBISHI GAS CHEMICAL COMPANY, INC.
- Solvay
- STOCKMEIER Group
Market Opportunities and Future Outlook
White space is most visible where operators need non-halogenated disinfection with auditable control, but lack standardized measurement and documentation tools. The US EPA proposal in January 2025 to include Standard Method 4500-PAA under the Clean Water Act Methods Update Rule 22 provides a concrete pathway for utilities and industrial facilities to align residual monitoring with a recognized method, supporting wider deployment of PAA in wastewater and industrial effluent programs where trihalomethane and residual chlorine constraints complicate chlorination.
On the supply side, opportunities concentrate in lower-carbon and higher-purity product offerings and in upstream integration that stabilizes peroxide availability. In Europe, Evonik's June 2026 launch of low carbon footprint peracetic acid for the European market (mass balance approach certified by TUV Rheinland) creates a differentiated procurement route for food, beverage, and water customers tracking Scope 3 emissions without changing formulations. In Asia, Evonik's January 2025 joint venture with Fuhua Tongda Chemicals in Leshan targeting high-purity hydrogen peroxide and electronics-grade peracetic acid, alongside the March 2025 licensing agreement with China Pingmei Shenma Group for a 200-kiloton hydrogen peroxide facility, points to upstream capacity expansion and adjacent pull from higher-spec applications beyond mainstream sanitation, tightening the link between peroxide investments and downstream PAA availability.
Recent Industry Developments in Peracetic Acid Market
- June 2026: Evonik launched a low carbon footprint peracetic acid product line for the European market using a mass balance approach certified by TUV Rheinland in line with ISO 22095-2:2026 and the TfS guideline 2024. The offering allows customers to pursue lower-carbon procurement without changing product specifications, helping sustain adoption in regulated food, healthcare, and water uses where requalification can slow supplier switches.
- September 2025: Enviro Tech Chemical Services launched Peragreen 26WW, a high-strength peracetic acid solution positioned for medium- and large-scale municipal wastewater treatment. The product broadens the company’s portfolio for utilities that are moving away from chlorine-based disinfection and adds competitive pressure in the high-volume water segment.
- July 2025: Enviro Tech Chemical Services received US EPA acceptance for expanded label claims for BioSide HS 15% and Perasan A, enabling use against E. coli, Salmonella, and Listeria in agricultural pre-harvest irrigation and post-harvest flume wash systems. The expanded label strengthens addressable demand in produce and agricultural sanitation, where audited pathogen-control programs are increasing chemical validation requirements.
Peracetic Acid Market Report Scope and Research Methodology
Market Definition and Coverage
This market covers revenues earned from selling peracetic acid products used as disinfectants, sanitizers, sterilants, oxidizers, and bleaching agents across industrial and institutional end users, and it is measured in USD for a defined base year with forecasts over the study period.
Scope exclusions: Excludes precursor chemicals (acetic acid and hydrogen peroxide), captive internal consumption within integrated sites, and mixed oxidizer products where peracetic acid is a minor additive.
Segments Covered in This Report
- By Product Form
- Liquid Solutions
- Powder / Granules
- Aqueous Blends
- By Concentration Grade
- Less than 5% PAA (Low)
- 5–15% PAA (Medium)
- More than 15% PAA (High)
- By Application
- Disinfectant
- Oxidizer
- Sterilant
- Other Applications (Bleaching Agent, Sanitizer, etc.)
- By End-user Industry
- Food and Beverage Processing
- Water Treatment
- Pulp and Paper
- Healthcare (including Pharmaceutical)
- Chemical
- Other End-user Industries (Agriculture and Aquaculture, etc.)
- By Geography (Volume)
- Asia-Pacific
- China
- India
- Japan
- South Korea
- Rest of Asia-Pacific
- North America
- United States
- Canada
- Mexico
- Europe
- Germany
- United Kingdom
- France
- Italy
- Rest of Europe
- South America
- Brazil
- Argentina
- Rest of South America
- Middle-East and Africa
- Saudi Arabia
- South Africa
- Rest of Middle-East and Africa
- Asia-Pacific
Data Sources, Market Sizing, and Validation
Desk Research
Desk work starts by grounding the demand pool and the safety framework, because peracetic acid usage is closely tied to regulated disinfection and water-treatment practices. We referenced public sources such as the US EPA pesticide and antimicrobial registrations, US FDA food-contact and sanitation related references, CDC infection prevention guidance, and wastewater and drinking-water statistics and standards from agencies such as the US EPA and European Environment Agency.
We also used non-paywalled customs and trade statistics from sources such as UN Comtrade to understand cross-border movement patterns of peroxyacetic acid preparations, and we checked technical literature (including peer-reviewed journals) to confirm typical use rates, stability constraints, and handling requirements that affect real-world consumption. Company annual reports, investor presentations, and reputable press were reviewed to validate capacity additions, product positioning, and end-market exposure, supported by paid subscription sources for company financials and news screening, plus a second paid subscription for patent landscaping where relevant. These examples are not exhaustive, and many other public sources were also used for data collection, validation, and clarification.
Primary Interviews and Surveys
Primary work focused on validating application-level usage patterns and price realization across key end uses such as food and beverage sanitation, water treatment, healthcare disinfection, and pulp and paper bleaching. We spoke with a mix of manufacturers, distributors, formulators, and large end users across major regions so that gaps in secondary data, including concentration mix shifts and contract versus spot pricing differences, could be reconciled before finalizing the model.
Distribution of primary research fieldwork respondents
| Company type | Respondent position | Region |
|---|---|---|
| Top tier: 39% | CXOs: 16% | APAC: 46% |
| Mid tier: 43% | Functional/Unit leaders: 40% | EMEA: 36% |
| Smaller Players: 18% | Managers: 44% | Americas: 18% |
Market-Sizing & Forecasting
Sizing was built using a top-down approach where end-use demand pools were reconstructed from water-treatment throughput trends, food processing hygiene intensity, pulp and paper bleaching activity, and healthcare disinfection requirements, and then translated into peracetic acid consumption using typical dosing ranges and concentration mixes. To keep totals realistic, we corroborated the results with selective bottom-up approximations, such as sampled supplier revenues, distributor volume channel checks, and simple volume times average selling price builds for common concentration bands.
Key inputs used in the model include regional wastewater treatment coverage and investment signals, food and beverage processing output indicators, pulp and paper production levels, the split of common concentration grades (for example, 5% to 15% solutions versus higher strengths), and observed price movements tied to feedstock and logistics. Forecasting relied on scenario analysis supported by expert views on regulation-driven adoption, substitution away from chlorine chemistries in sensitive applications, and expected capacity changes, and then the scenarios were blended into a single base case. Where bottom-up information was missing for smaller countries, we backfilled using per-capita or industry-output proxies, and then normalized totals to match the broader regional demand logic.
Data Validation & Update Cycle
Validation is done in layers so that no single data point drives the outcome. We check final market totals against independent signals like trade directionality, disclosed capacity and utilization commentary, and whether implied per-unit dosing sits inside practical ranges for each end use.
Any large variances trigger a deeper review, which can include re-checking unit conversions, re-contacting selected respondents, and revisiting concentration mix assumptions that often create hidden swings in value. Before sign-off, a second analyst review is completed to ensure formulas, sources, and assumptions are applied consistently. Reports are refreshed annually, and interim updates are made when material events occur, followed by a final pre-delivery pass so the numbers reflect the latest available information.
Mordor Intelligence's Peracetic Acid Market Size Versus Other Published Estimates
Published market sizes for peracetic acid often differ because each study defines market revenue differently, selects a different base year, and handles pricing and concentration mixes in different ways. Variations also appear when one estimate relies more on volume proxies and another focuses more on value-only reporting.
Mixed oxidizer products with under 1% peracetic acid sit outside Mordor Intelligence's scope, and this exclusion alone can pull down totals compared with estimates that bundle broader disinfectant blends without isolating active-equivalent demand. The spread can also come from how on-site generation systems are counted, the currency conversion timing used for global rollups, and whether the forecast assumes faster adoption in water treatment versus a more step-by-step regulatory uptake.
Benchmark comparison
| Source | Market Size | Gaps in Research Methodology |
|---|---|---|
| Mordor Intelligence | USD 1.03 B (2024) | |
| Industry Publisher A | USD 0.97 B (2024) | Uses a value-only frame with segment totals that can undercount on-site generation related revenues and may apply a narrower set of end-use sanitation applications, which typically lowers the summed market value for the same year. |
| Research Firm B | USD 1.11 B (2025) | Reports a later base year and pairs it with a higher growth assumption, and the scope appears to include a broader set of peracetic acid preparations by product form, which can lift the stated 2025 value versus a tighter product-definition model. |
The comparison indicates that the differences are mainly explained by product-definition cutoffs, base-year selection, and how pricing is carried across concentration grades and use cases. By keeping the demand pool tied to clear end-use activity indicators and then cross-checking with practical price and volume signals, the resulting number remains traceable and repeatable when clients test assumptions.
Key Questions Answered in the Report
What is the current global demand for peracetic acid in 2026?
The peracetic acid market size in 2026 is 379.26 kilotons.
How fast is demand expected to grow through 2031?
Volume is projected to reach 504.91 kilotons by 2031, equating to a 5.89% CAGR.
Which application category is expanding the quickest?
Disinfectant use is advancing at a 6.45% CAGR as utilities and food plants replace chlorine.
Why do processors prefer medium-concentration products?
Grades in the 5–15% range balance rapid microbial kill with easier handling rules, holding 54.31% share in 2025.
Which region offers the strongest growth prospects?
Asia-Pacific leads with 6.80% CAGR through 2031 due to local feedstock expansion and tighter wastewater regulations.