
Pegylated Proteins Market Size and Share
Market Overview
| Study Period | 2020 - 2031 |
|---|---|
| Market Size (2026) | USD 2.32 Billion |
| Market Size (2031) | USD 3.89 Billion |
| Growth Rate (2026 - 2031) | 10.93 % |
| Fastest Growing Market | Asia-Pacific |
| Largest Market | North America |
| Market Concentration | Medium |
Major Players *Disclaimer: Major Players sorted in no particular order Image © Mordor Intelligence. Reuse requires attribution under CC BY 4.0. | |
Pegylated Proteins Market Analysis by Mordor Intelligence
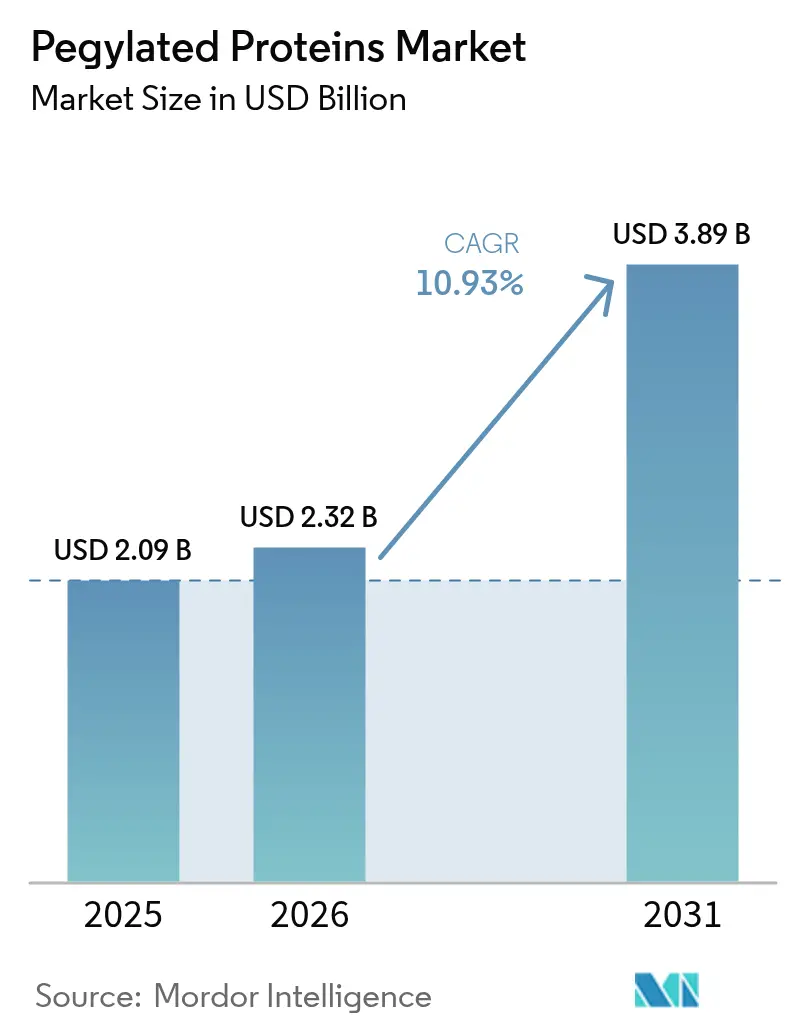
The pegylated proteins market size was valued at USD 2.09 billion in 2025 and estimated to grow from USD 2.32 billion in 2026 to reach USD 3.89 billion by 2031, at a CAGR of 10.93% during the forecast period (2026-2031). Growth reflects the technology’s expanding role in extending half-life, reducing immunogenicity and improving stability of biologics across oncology, autoimmune disease and rare-disease pipelines. Vertical integration initiatives, a robust supply of high-purity reagents, and AI-enabled protein-engineering platforms are reinforcing industry momentum. Pharmaceutical developers are accelerating antibody–drug conjugate programs that depend on site-specific PEG linkers to balance potency and safety, while outsourcing of complex chemistries is broadening access to advanced conjugation expertise. Meanwhile, regulatory attention to environmental stewardship is prompting greener production methods, further shaping procurement strategies.
Key Report Takeaways
- By product type, PEGylation kits & reagents led with 68.82% revenue share in 2025, whereas services are projected to register a 9.55% CAGR through 2031.
- By protein type, colony-stimulating factors held 62.94% of pegylated proteins market share in 2025, while monoclonal antibodies & ADC linkers are forecast to advance at a 9.86% CAGR.
- By application, oncology commanded 46.10% share of the pegylated proteins market size in 2025; autoimmune & inflammatory diseases are projected to expand at 11.02% CAGR to 2031.
- By end user, pharmaceutical & biotechnology companies accounted for 58.97% share in 2025, whereas CROs & CMOs are expected to grow at a 10.62% CAGR.
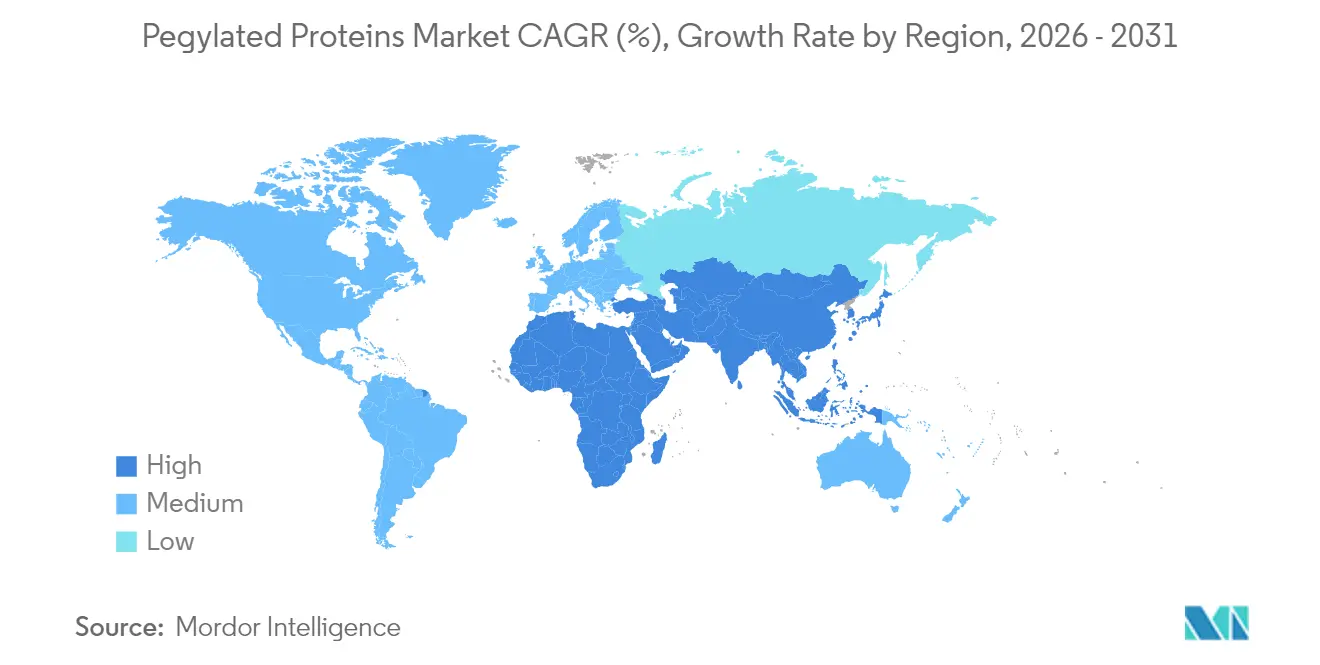
- By geography, North America contributed 44.05% of 2025 revenue, while Asia-Pacific is forecast to post a 9.55% CAGR through 2031.
Note: Market size and forecast figures in this report are generated using Mordor Intelligence’s proprietary estimation framework, updated with the latest available data and insights as of 2026.
Market Trends and Insights
Drivers Impact Analysis of Pegylated Proteins Market*
| Driver | (~) % Impact on CAGR Forecast | Geographic Relevance | Impact Timeline |
|---|---|---|---|
| High Prevalence of Chronic Diseases | + 2.1% | Global, with concentration in North America & Europe | Long term (≥ 4 years) |
| Increasing Adoption of Long-Acting Biologics | + 1.8% | Global, led by North America, expanding to APAC | Medium term (2-4 years) |
| Expansion of Oncology Pipeline for PEG-Conjugated ADCs | + 2.3% | North America & Europe, with emerging APAC activity | Medium term (2-4 years) |
| R&D Funding Toward Site-Specific Pegylation Chemistries | + 1.4% | North America & Europe core, spill-over to APAC | Long term (≥ 4 years) |
| AI-Enabled Protein Engineering Shortening Optimization Cycles | +1.6% | Global, with early adoption in North America & Europe | Short term (≤ 2 years) |
| Strategic Partnerships for PEG Reagent Supply Security | +1.0% | Global, with focus on US-Europe-Asia supply chains | Medium term (2-4 years) |
| Source: Mordor Intelligence | |||
High Prevalence of Chronic Diseases
Demand for long-acting biologics is climbing in aging regions, and PEGylation is integral to lowering dosing frequency for chronic indications. FDA approval of Palopegteriparatide in September 2024 for chronic hypoparathyroidism broadened the technology’s reach beyond oncology by showing that 78.7% of patients maintained normocalcemia without supplemental therapy. The prodrug’s methoxy-PEG carrier improves pharmacokinetics while easing adherence pressures, underscoring how the pegylated proteins market benefits from wider chronic-disease applications.
Increasing Adoption of Long-Acting Biologics
Ropeginterferon alfa-2b achieved a 71.4% complete hematologic response in polycythemia vera at week 52 and cut JAK2 V617F allele burden nearly in half, confirming the value of mono-PEGylated formats.[1] An ongoing phase III trial in essential thrombocythemia further validates PEGylation’s flexibility, encouraging drug makers to expand development budgets and fueling pegylated proteins market growth.
Expansion of Oncology Pipeline for PEG-Conjugated ADCs
PEG linkers enhance stability and drug-antibody ratios in new antibody–drug conjugates that collectively topped USD 10 billion in 2023 sales. Datopotamab deruxtecan, patritumab deruxtecan and telisotuzumab vedotin are slated for near-term FDA review, spotlighting the segment’s reliance on precision PEG chemistries. CDMOs have responded by expanding bioconjugation suites, a development that supports ongoing pegylated proteins market expansion.
R&D Funding Toward Site-Specific Pegylation Chemistries
Advances in exactly defined molecular-weight PEGs facilitate pinpoint conjugation control, reducing heterogeneity and immunogenicity.[2] Capital is therefore shifting toward site-specific platforms suited for premium-priced therapeutics, positioning innovators to capture high-margin niches within the pegylated proteins market.
Restraints Impact Analysis of Pegylated Proteins Market*
| Restraint | (~) % Impact on CAGR Forecast | Geographic Relevance | Impact Timeline |
|---|---|---|---|
| Drug Failures & Recalls | -1.2% | Global, with higher impact in regulated markets | Short term (≤ 2 years) |
| Anti-PEG Antibody–Mediated Accelerated Blood Clearance | -1.5% | Global, with research focus in North America & Europe | Medium term (2-4 years) |
| Imminent Patent Expiries of First-Generation Pegylated Blockbusters | -0.8% | North America & Europe primarily | Short term (≤ 2 years) |
| Environmental and Regulatory Scrutiny of PEG Waste Streams | -0.7% | Europe leading, expanding to North America & APAC | Long term (≥ 4 years) |
| Source: Mordor Intelligence | |||
Anti-PEG Antibody–Mediated Accelerated Blood Clearance
Researchers at Cornell University demonstrated that poly(carboxybetaine) lipid nanoparticles can bypass anti-PEG antibodies, thereby improving mRNA vaccine performance. Alternative polymers such as branched random-PEG and ganglioside lipid nanoparticles are emerging, yet long-term safety data remain limited.[3] Persistent immunogenicity concerns may temper short-term uptake of PEGylated formats.
Environmental and Regulatory Scrutiny of PEG Waste Streams
Europe has begun to weigh lifecycle solvent burdens, noting that peptide APIs can require up to 14 tons of solvent per kilogram produced. Regulatory scrutiny is driving adoption of greener methods and biodegradable packaging, raising compliance costs that could constrain the pegylated proteins market, especially for smaller producers.
*Our forecasts treat driver/restraint impacts as directional, not additive. The impact forecasts reflect baseline growth, mix effects, and variable interactions.
Pegylated Proteins Market Segment Analysis
By Product Type:
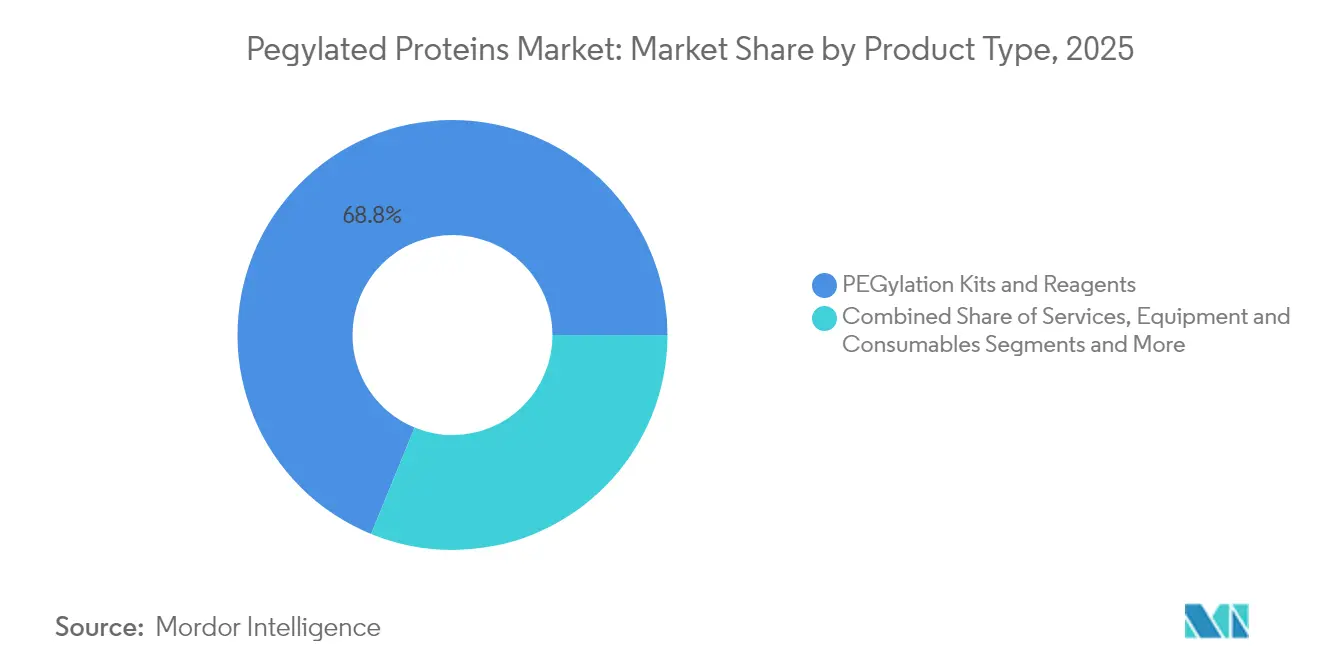
Services Emerge as Growth EnginePEGylation kits & reagents accounted for 68.82% of pegylated proteins market share in 2025, reflecting entrenched preferences among drug makers for in-house control of routine conjugations. These off-the-shelf products benefit from streamlined regulatory dossiers and repeat-purchase dynamics that stabilize demand. Services, however, are expanding at a 9.55% CAGR through 2031 as site-specific conjugation, homogenous linker design and analytical validation exceed the skill sets of many internal teams.
The services boom is enlarging the pegylated proteins market size as clients tap CDMOs for custom PEG synthesis, process scale-up and GMP batch release. Mature players are broadening menus to include advanced analytics and regulatory documentation, while niche specialists carve out space in high-purity linker production. This dual-track ecosystem—standard reagents for legacy workflows and bespoke services for frontier science—positions contract providers to capture incremental value as pipeline complexity rises.

By Protein Type:
ADC Linkers Drive InnovationColony-stimulating factors retained 62.94% of pegylated proteins market share in 2025 thanks to pegfilgrastim’s proven ability to mobilize peripheral stem cells in a single dose. Interferons remain essential in multiple-sclerosis care, keeping that cornerstone segment resilient.
Monoclonal antibodies & ADC linkers are set to post a 9.86% CAGR, the fastest within the category, as oncology developers demand precisely weighted PEG spacers to balance potency and tolerability. These requirements are pushing innovators to adopt exactly defined molecular-weight PEGs that minimize heterogeneity and immunogenicity. The trend is widening pegylated proteins market size for linker chemistries and reinforcing CDMO investment in dedicated bioconjugation suites.
By Application:
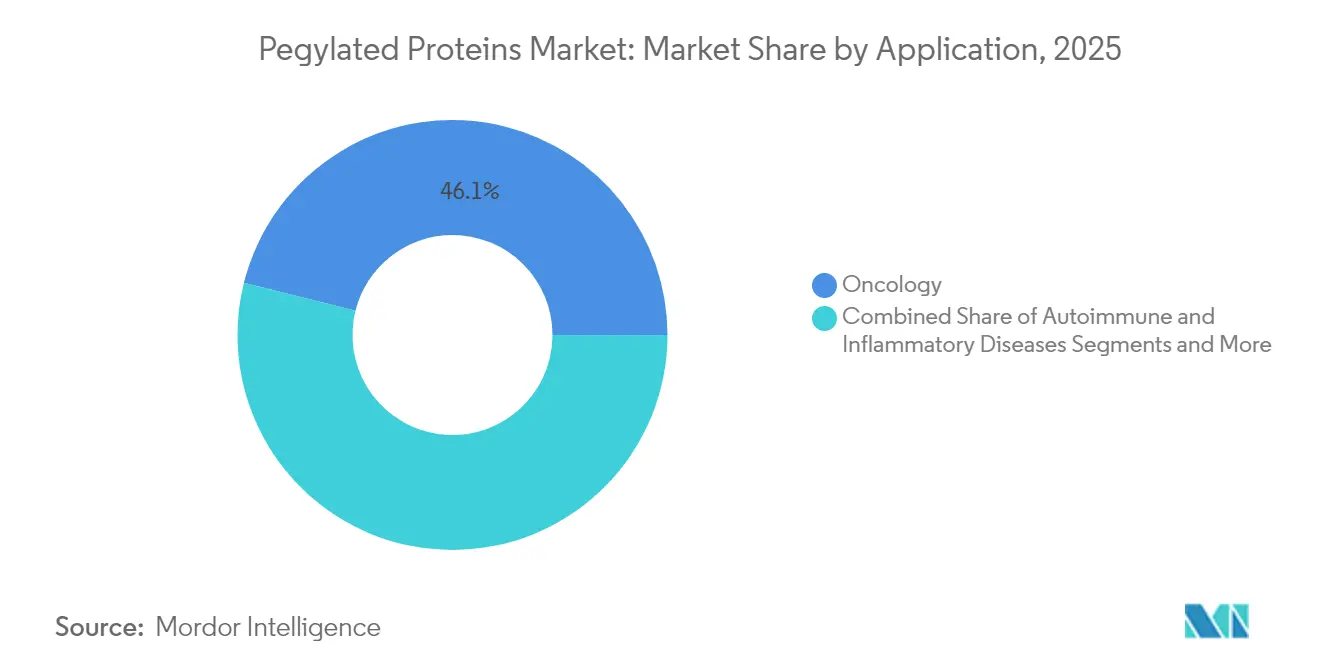
Autoimmune Diseases Show PromiseOncology commanded 46.10% of 2025 revenue, propelled by antibody–drug conjugates that use PEG linkers to fine-tune systemic exposure and expand therapeutic windows. Blockbusters such as Enhertu and Kadcyla continue to anchor the pegylated proteins market, and multiple late-stage assets promise to deepen this revenue stream.
Autoimmune & inflammatory diseases represent the fastest-moving application, expected to grow at 11.02% CAGR through 2031. Exosome-modified AAV gene therapy for autoimmune hepatitis recently boosted hepatic T-reg levels while lowering ALT, illustrating PEGylation’s versatility beyond cytotoxic payloads. As immune-mediated indications proliferate, demand for long-acting, tolerable biologics is poised to expand pegylated proteins market size in non-oncology franchises.
By End User:
CROs Gain MomentumPharmaceutical & biotechnology companies held 58.97% of spending in 2025, leveraging in-house capabilities for late-stage and commercial products. Their dominance secures baseline demand for reagents, equipment and validated workflows that underpin pegylated proteins market stability.
CROs & CMOs are projected to advance at a 10.62% CAGR because sponsors increasingly outsource complex site-specific conjugations. Samsung Biologics’ USD 1.4 billion manufacturing deal in early 2025 exemplifies this shift toward external capacity that can scale multiproduct, multi-modality programs. Expanded outsourcing pipelines thus inject fresh momentum into overall pegylated proteins market growth.
Geography Analysis
North America Pegylated Proteins Market
North America contributed 44.05% of 2025 revenue, supported by a steady cadence of FDA approvals and extensive manufacturing infrastructure. Thermo Fisher’s USD 2 billion multiyear investment plan and Merck’s USD 1 billion biologics center in Delaware demonstrate continued capital inflows that reinforce pegylated proteins market size in the region. Regulatory clarity and strong IP protections further encourage innovators to base high-value conjugation work domestically.
Europe Pegylated Proteins Market
Europe maintains steady expansion underpinned by mature biopharmaceutical clusters and stringent environmental policies that are prompting early adoption of greener PEGylation practices. The region’s focus on solvent reduction and waste-stream monitoring is influencing global supply contracts, nudging manufacturers toward sustainable chemistries that can meet future compliance thresholds. Established reimbursement frameworks also ensure predictable uptake of approved PEGylated therapies, sustaining pegylated proteins market share across major EU economies.
APAC Pegylated Proteins Market
Asia-Pacific is the fastest-growing territory at a 9.55% CAGR, reflecting rising biomanufacturing capacity and regulatory harmonization that lowers market-entry barriers. Samsung Biologics is adding a new plant to expand linker output, China and India are scaling GMP suites, and regional governments are funding biotech parks to attract multinational projects. These initiatives are enlarging pegylated proteins market size across APAC, while local demand for affordable biologics accelerates technology transfer and workforce training. Collectively, these dynamics are redistributing future growth toward the East without eroding North America’s innovation leadership.
Regulatory Landscape
Pegylated proteins are regulated primarily as biologics, with regulators such as the FDA, EMA, and Health Canada placing heavy emphasis on CMC controls for conjugate characterization. This includes degree of PEG modification, conjugation site distribution, residual free (unconjugated) protein, and polymer size distribution/polydispersity. Across submissions, immunogenicity risk management has become more explicit, with requirements to evaluate anti-PEG antibodies and their potential impact on pharmacokinetics, efficacy, and safety that aligns with FDA immunogenicity expectations for therapeutic proteins.
In Europe, EMA guidance specific to pegylated (conjugated) proteins in product information and its pharmacokinetics guideline for therapeutic proteins anchor documentation expectations for composition and exposure-response. Pediatric development adds additional scrutiny: the CHMP Safety Working Party response (in the context of pediatric use) calls out non-clinical findings such as ependymal cell PEG vacuolation and references exposure-based considerations, including assessment of blood-CSF barrier transport when monthly PEG exposure exceeds 0.4 umol/kg/month. For linker and PEG-related impurities, ICH Q3A thresholds (0.10% identification and 0.15% qualification for impurities in new drug substances) are increasingly used as practical reference points when defining PEG linker quality specifications in bioconjugate programs.
Value Chain Analysis
The value chain begins upstream with petrochemical-derived ethylene oxide feedstock, then conversion into pharmaceutical-grade PEGs and functionalization into activated PEG reagents (linear, branched, and multi-arm formats) used for protein conjugation. Midstream value is concentrated in specialist reagent suppliers and CDMOs that combine custom PEG synthesis with conjugation process development, scale-up, and GMP manufacturing of pegylated therapeutic active ingredients. This is supported by method development for analytics that quantify free protein, confirm conjugation patterns, and control molecular size distribution. Regulatory requirements, including EMA composition expectations for pegylated proteins and FDA immunogenicity assessment expectations for therapeutic proteins (alongside nonclinical framing such as ICH S6(R1)), push extensive analytical validation and comparability packages, which makes characterization capability a key differentiator.
Downstream, sponsors (pharmaceutical and biotechnology companies) and outsourcing partners (CROs and CMOs) drive demand for routine PEGylation kits and higher-complexity, site-specific conjugation services. Release testing and documentation form a major portion of delivered value. Operational bottlenecks often sit at the interface of reagent availability and analytics, where single-source reliance on specialized activated PEG derivatives can disrupt method validation timelines and tech transfer. Integrated end-to-end offerings that keep reagent sourcing, conjugation execution, and analytical release under one quality system are gaining prominence as a way to reduce fragmented procurement risk and accelerate movement from gram-scale development batches to multi-kilogram manufacturing in dedicated facilities.
Competitive Landscape
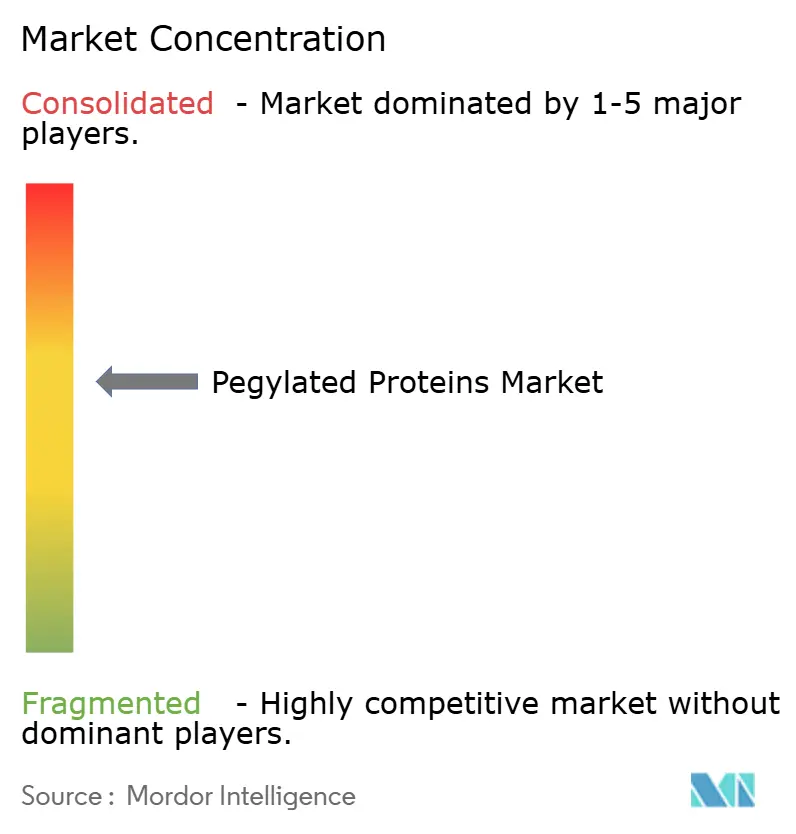
The pegylated proteins market remains moderately fragmented: no single company exceeds one-quarter of global revenue, and about a dozen firms collectively control roughly 70%. Intellectual-property portfolios, GMP reagent output and regulatory track records frame competitive barriers. Nektar’s November 2024 divestiture of its Alabama plant to Ampersand Capital Partners exemplifies how firms recalibrate toward core R&D while securing reagent continuity for clients. Vertical integration lets larger players capture more value, yet niche innovators that specialize in site-specific linkers or AI-driven design continue to win contracts.
Partnerships are intensifying under the proposed U.S. BIOSECURE Act, which will screen foreign supply chains. This scrutiny favors vendors with multi-regional footprints. Furthermore, efforts to replace PEG with PCB or ganglioside polymers are spawning start-ups focused on stealth alternatives, hinting at future disruption. Standardization under FDA 21 CFR 172.820 bolsters incumbents who already meet specification thresholds.
Pegylated Proteins Industry Leaders
-
Merck KGaA
-
Thermo Fisher Scientific, Inc
-
Creative PEGworks
-
NOF Corporation
-
JenKem Technology
- *Disclaimer: Major Players sorted in no particular order
Pegylated Proteins Market Companies Covered in this Report
- Merck
- Thermo Fisher Scientific
- NOF Corporation
- JenKem Technology
- Creative PEGWorks
- Quanta BioDesign Ltd.
- Abcam
- Life Diagnostics
- Alpha Diagnostic Intl. Inc.
- Iris Biotech GmbH
- Laysan Bio Inc.
- Amgen
- Roche
- Pfizer
- AstraZeneca
- Biogen
- Nektar Therapeutics
- Catalent
- Lonza Group
- Bachem Holding
- Wuxi Biologics
- Samsung Group
- Sanofi
- Takeda Pharmaceutical Co.
- Johnson & Johnson
Market Opportunities and Future Outlook
A near-term opportunity sits in expanding pediatric indications and rare-disease applications where longer-acting enzyme and peptide formats reduce dosing burden and support adherence. In 2026, the FDA cleared multiple pegylated therapies that reinforce this breadth, including a supplemental approval for BioMarin's PALYNZIQ (pegvaliase-pqpz) for patients 12 years of age and older with PKU. It also included initial approvals for LOARGYS (pegzilarginase-nbln) for hyperargininemia in patients 2 years and older with ARG1-D and YUVIWEL (navepegritide) for linear growth in pediatric patients 2 years and older with achondroplasia. These approvals increase the installed base of PEGylated modalities beyond oncology and support demand for GMP-grade reagents, characterization workflows, and lifecycle management services tied to label expansions.
Another whitespace area is the industrialization of advanced PEG architectures and integrated development services that shorten iteration cycles for complex conjugates, including oncology programs that rely on precise linker control. In 2026, Biopharma PEG expanded its integrated PEGylated protein development platform spanning recombinant protein expression through analytical characterization, and highlighted multi-arm PEG architectures as a tool to increase hydrodynamic volume and provide multiple attachment points for long-acting biologics. As environmental and quality scrutiny increases, including tighter attention to solvent burden and impurity control, suppliers that can offer well-defined PEG reagents, robust impurity specifications aligned to ICH thresholds, and validated analytical packages create a clearer procurement path for sponsors moving from discovery to GMP and commercial supply.
Recent Industry Developments in Pegylated Proteins Market
- June 2026: Merck KGaA announced an agreement to acquire Bio-Techne, expanding its exposure to life science tools and reagents that support bioprocessing and analytical workflows used across PEGylation and bioconjugation programs. The move strengthens vertical integration options for customers that need reliable access to high-quality inputs and characterization capabilities alongside therapeutic development.
- July 2025: Thermo Fisher Scientific acquired Sanofi's sterile drug product manufacturing facility in Ridgefield, New Jersey, positioning it as a North American hub for integrated sterile fill-finish and autoinjector final assembly. Expanded sterile capacity complements the growing set of long-acting biologics and conjugates that require scalable, compliant drug-product manufacturing and packaging configurations.
- December 2024: Ampersand Capital Partners finalized its acquisition of Nektar Therapeutics' PEGylation reagent manufacturing business. The transaction separated reagent manufacturing from Nektar's R&D focus while keeping specialized PEG reagent production in operation, supporting continuity for customers dependent on established PEGylation inputs.
Pegylated Proteins Market Report Scope and Research Methodology
Market Definition and Coverage
This market covers revenues generated from pegylated protein offerings where a polyethylene glycol chain is attached to a protein to improve stability, solubility, and dosing convenience. Our sizing is built in value terms across the commercial and near commercial therapeutic ecosystem.
Scope exclusions: We exclude non-PEG polymer conjugation approaches, basic research-only protein reagents not used for PEGylation workflows, and simple pass-through distribution margins that do not reflect value creation.
Segments Covered in This Report
- By Product Type
- PEGylation Kits & Reagents
- Monofunctional Linear PEGs
- Bifunctional & Multi-arm PEGs
- Branched/Y-shape PEGs
- Services
- Custom PEG Synthesis
- Analytical & Characterization Services
- Contract PEGylation Manufacturing
- PEGylated Therapeutic Active Ingredients
- Equipment & Consumables
- PEGylation Kits & Reagents
- By Protein Type
- Colony-Stimulating Factors (CSFs)
- Interferons
- Erythropoietin
- Recombinant Factor VIII
- Enzymes (e.g., L-asparaginase)
- Monoclonal Antibodies & ADC Linkers
- Other Protein Types
- By Application
- Oncology
- Autoimmune & Inflammatory Diseases
- Hepatitis & Viral Infections
- Hematology (Hemophilia, Anemia)
- Endocrine & Metabolic Disorders
- Others
- By End User
- Pharmaceutical & Biotechnology Companies
- CROs & CMOs
- Academic & Research Institutes
- Hospital Pharmacies
- By Geography
- North America
- United States
- Canada
- Mexico
- Europe
- Germany
- United Kingdom
- France
- Italy
- Spain
- Rest of Europe
- Asia-Pacific
- China
- Japan
- India
- Australia
- South Korea
- Rest of Asia-Pacific
- Middle East and Africa
- GCC
- South Africa
- Rest of Middle East and Africa
- South America
- Brazil
- Argentina
- Rest of South America
- North America
Data Sources, Market Sizing, and Validation
Desk Research
Desk research starts with the public evidence that explains how pegylated proteins and related workflows are adopted, priced, and regulated across regions. We reviewed sources such as the FDA and EMA public databases, the WHO and OECD health statistics, national procurement and reimbursement references where available, and clinical trial registries to understand pipeline movement and therapy-area momentum.
To translate those signals into an initial market logic, we also used company filings and investor presentations, peer reviewed journals covering PEGylation chemistry and biologics formulation, relevant patent databases, and customs and trade statistics for key inputs where they are reported. In a few cases, paid subscriptions for company financials and intelligence, patent search, and shipment-level import and export checks were used to validate specific assumptions. These desk sources are not exhaustive, and many other public references were used for data collection, validation, and clarification during the work.
Primary Interviews and Surveys
Primary work was used to pressure test the desk assumptions around what gets counted as a pegylated protein market revenue and what should stay out. We spoke with a mix of drug developers, CDMO and CRO stakeholders, and downstream users across APAC, EMEA, and the Americas, and then used those inputs to confirm pricing logic, adoption timing, and the practical split between products and services.
Distribution of primary research fieldwork respondents
| Company type | Respondent position | Region |
|---|---|---|
| Top tier: 29% | CXOs: 15% | APAC: 45% |
| Mid tier: 49% | Functional/Unit leaders: 40% | EMEA: 30% |
| Smaller Players: 22% | Managers: 45% | Americas: 25% |
Market-Sizing & Forecasting
For market sizing, we use a top-down and bottom-up blend, where the top-down structure is built from therapy and product adoption signals and then translated into a demand pool that can be valued. In practice, the build is guided by indicators like the number of marketed PEGylated biologics, clinical pipeline progression for long-acting biologics, dosing frequency shifts, and typical treatment duration patterns in key indications, and these are then aligned with regional access and reimbursement realities.
After that, selective bottom-up approximations are used to check the totals, mainly through sampled price points and volumes, channel feedback on purchasing behavior, and supplier and service-provider activity levels, with gaps handled by using conservative proxy ranges when a sub-area is thinly reported. Forecasts are run using scenario analysis supported by trend inputs from interviewees, and key variables include approval outlook, label expansions, biosimilar pressure on pricing, manufacturing capacity availability, and the pace of new formulation technology adoption. If a variable changed sharply in a region, we adjusted assumptions and rechecked the implied volumes so the final numbers stayed realistic.
Data Validation & Update Cycle
Validation is done through multi-step checks so the final series does not rely on one dataset or a single assumption. We compare outputs to independent signals such as approval timelines, therapy uptake patterns, and observed pricing bands, and then we review large variances at the country and region level before sign-off.
When an anomaly appears, the model is revisited and, if needed, experts are re-contacted to confirm what changed and whether the change is temporary or structural. The report is refreshed annually, with interim updates triggered by material events like major approvals, safety actions, or meaningful shifts in reimbursement, and we perform a final update pass right before delivery so clients receive the latest view.
Mordor Intelligence's Pegylated Proteins Market Estimate Compared With Other Published Estimates
Published market sizes for pegylated proteins often differ, even when they describe the same general theme, because the counted revenue lines and the timing assumptions do not always match. We see gaps mostly coming from what is treated as market revenue, which geographies are fully covered, and how pricing and uptake are carried forward year to year.
Approval and pipeline-readout signals, along with pricing bands validated through primary conversations, are the checks that keep Mordor Intelligence's estimate tied to counted PEGylation products and services rather than broader biologics revenues. Some sources also mix factory-gate style accounting with downstream markups, or they add adjacent analytical and manufacturing services more aggressively, which can shift the number even if the growth story looks similar.
Benchmark comparison
| Source | Market Size | Gaps in Research Methodology |
|---|---|---|
| Mordor Intelligence | USD 2.09 B (2025) | |
| Global Consultancy A | USD 1.67 B (2025) | Uses a narrower value capture that is presented as factory-gate revenues and may not fully align with a broader inclusion of PEGylation kits, reagents, and service activity captured across end users. |
| Industry Publisher B | USD 1.50 B (2025) | Relies on a tighter interpretation of the market boundary and can undercount regions or end-user spend that sits outside the most visible product categories, which compresses the 2025 total. |
The spread in estimates is mainly explained by what is included as monetized PEGylation activity and how revenues are recognized across the value chain. By keeping inputs traceable to adoption signals, pricing checks, and clear inclusion rules, our model aims to deliver a balanced total that can be repeated and revalidated as new approvals and utilization data arrive.
Key Questions Answered in the Report
What is driving the strong growth of the pegylated proteins market?
Elevated demand for long-acting biologics, expanding oncology ADC pipelines, and AI-enabled protein-engineering platforms are collectively propelling the market at an 10.93% CAGR.
Which product category currently leads the pegylated proteins market?
PEGylation kits & reagents hold 68.82% revenue share, reflecting widespread in-house use by pharmaceutical developers.
Why are CROs and CMOs gaining share in pegylated services?
Drug sponsors are outsourcing complex site-specific conjugation to specialized providers, giving CROs & CMOs a forecast 10.62% CAGR through 2031.
Which region is growing fastest in PEGylation adoption?
Asia-Pacific is projected to expand at 9.55% CAGR, supported by government incentives and large-scale CDMO investments.
How are anti-PEG antibodies influencing product design?
The rise of anti-PEG antibody concerns is prompting research into alternative stealth polymers like PCB and ganglioside LNPs, influencing next-generation conjugate strategies.
What impact will environmental regulations have on PEGylation manufacturing?
Tightening solvent and waste guidelines in Europe and beyond are encouraging greener production techniques, potentially raising compliance costs but stimulating innovation in sustainable chemistries.