
Global Pediatric Medical Devices Market Size and Share
Market Overview
| Study Period | 2020 - 2031 |
|---|---|
| Market Size (2026) | USD 46.11 Billion |
| Market Size (2031) | USD 60.82 Billion |
| Growth Rate (2026 - 2031) | 5.70 % |
| Fastest Growing Market | Asia Pacific |
| Largest Market | North America |
| Market Concentration | Medium |
Major Players *Disclaimer: Major Players sorted in no particular order Image © Mordor Intelligence. Reuse requires attribution under CC BY 4.0. | |
Global Pediatric Medical Devices Market Analysis by Mordor Intelligence
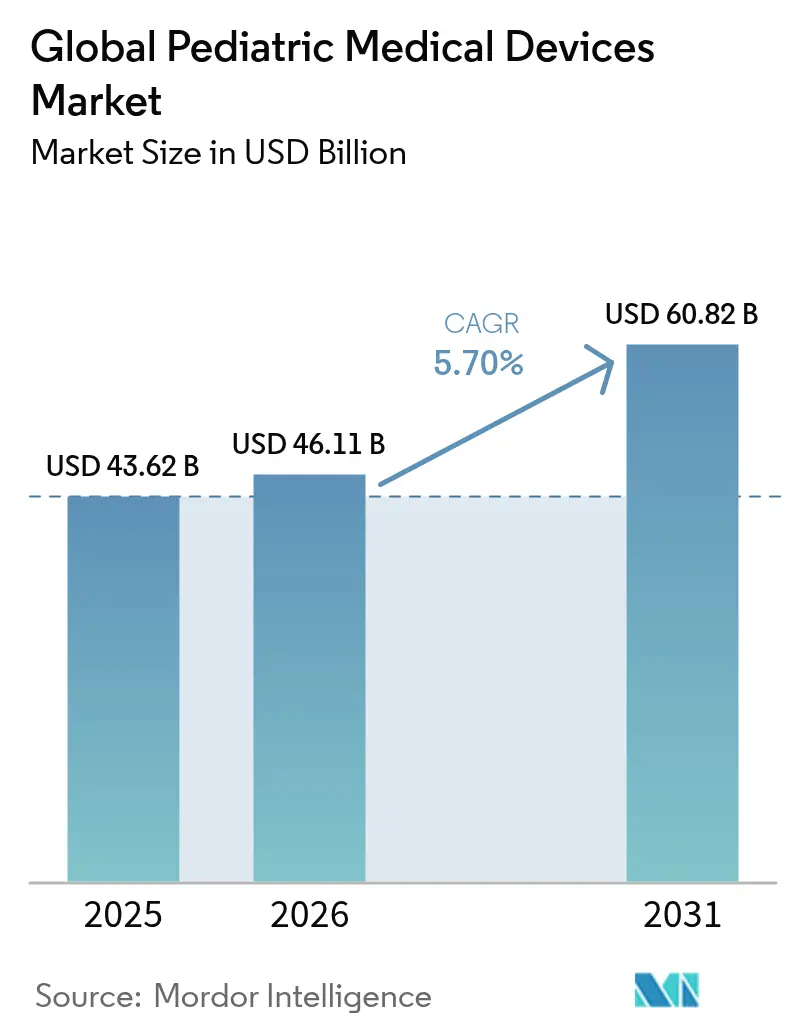
The pediatric medical devices market size was valued at USD 43.62 billion in 2025 and estimated to grow from USD 46.11 billion in 2026 to reach USD 60.82 billion by 2031, at a CAGR of 5.70% during the forecast period (2026-2031). Rising preterm birth rates, growing demand for minimally invasive interventions sized for children, and steady regulatory clearances for breakthrough products keep the growth trajectory intact. North America continues to lead on account of mature reimbursement rules and dedicated children’s hospitals, while Asia-Pacific gains momentum on the back of demographic tailwinds and targeted public-health spending. Rapid uptake of AI-enabled monitoring tools pushes device makers to integrate software intelligence into legacy hardware, opening new revenue streams. At the same time, the need to secure pediatric-grade biomaterials, comply with expanded supply-chain reporting rules, and invest in long-term safety studies creates operational complexity that only the most agile players can navigate.
Key Report Takeaways
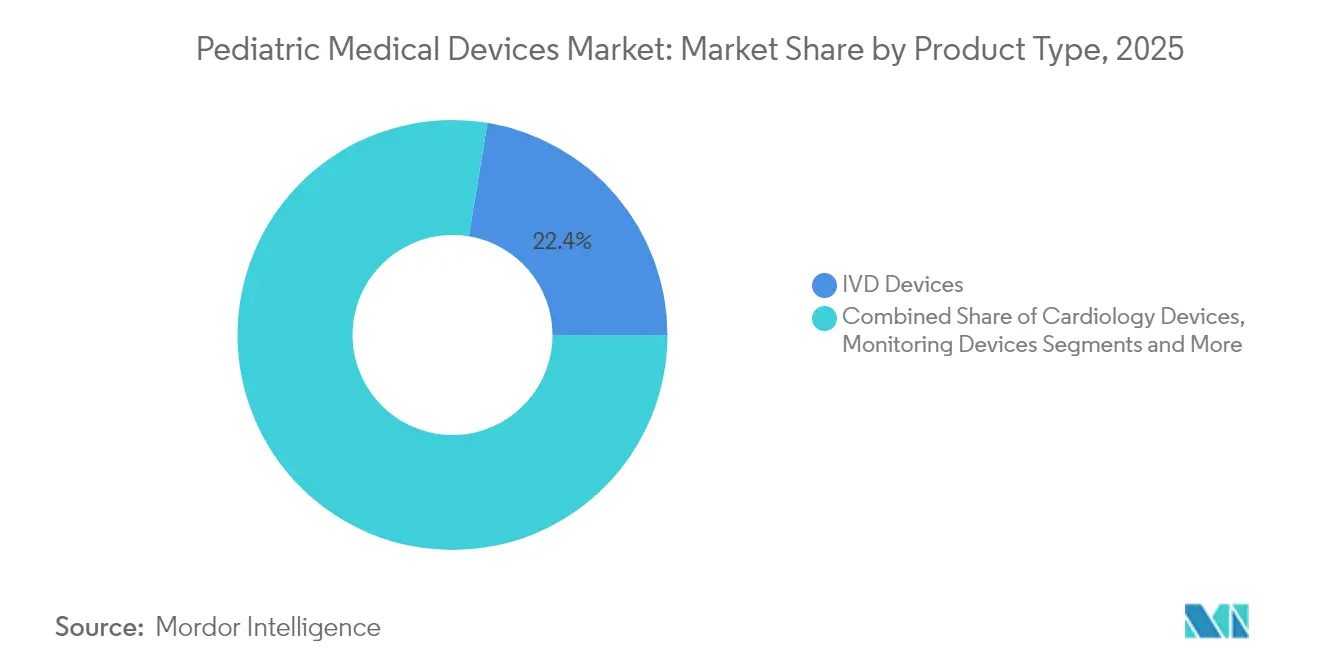
- By product type, IVD devices held 22.40% of the pediatric medical devices market share in 2025, whereas monitoring devices are projected to post the fastest 6.15% CAGR to 2031.
- By end user, hospitals captured 53.70% revenue share in 2025 and homecare settings are expected to grow at a 6.55% CAGR through 2031.
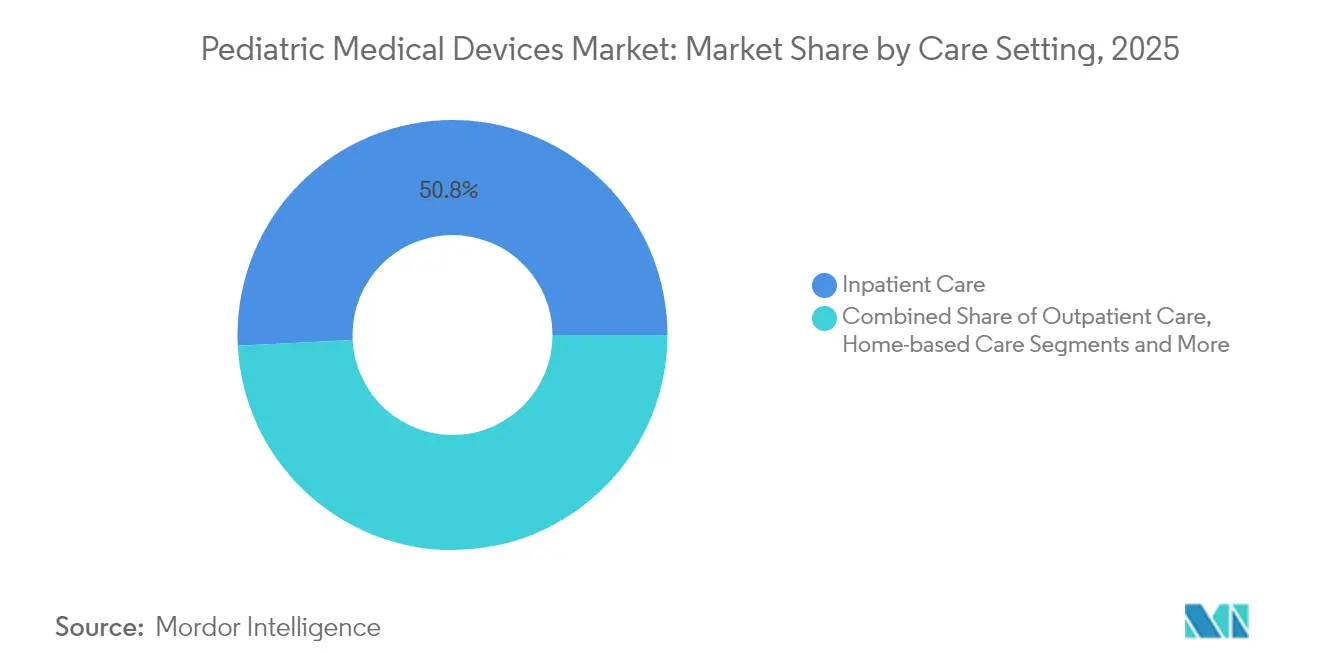
- By care setting, inpatient settings commanded 50.80% share of the pediatric medical devices market size in 2025, while home-based care will expand at a 6.95% CAGR between 2026-2031.
- By technology, conventional devices controlled 48.20% of the 2025 market and AI-enabled devices are forecast to rise at a 7.05% CAGR.
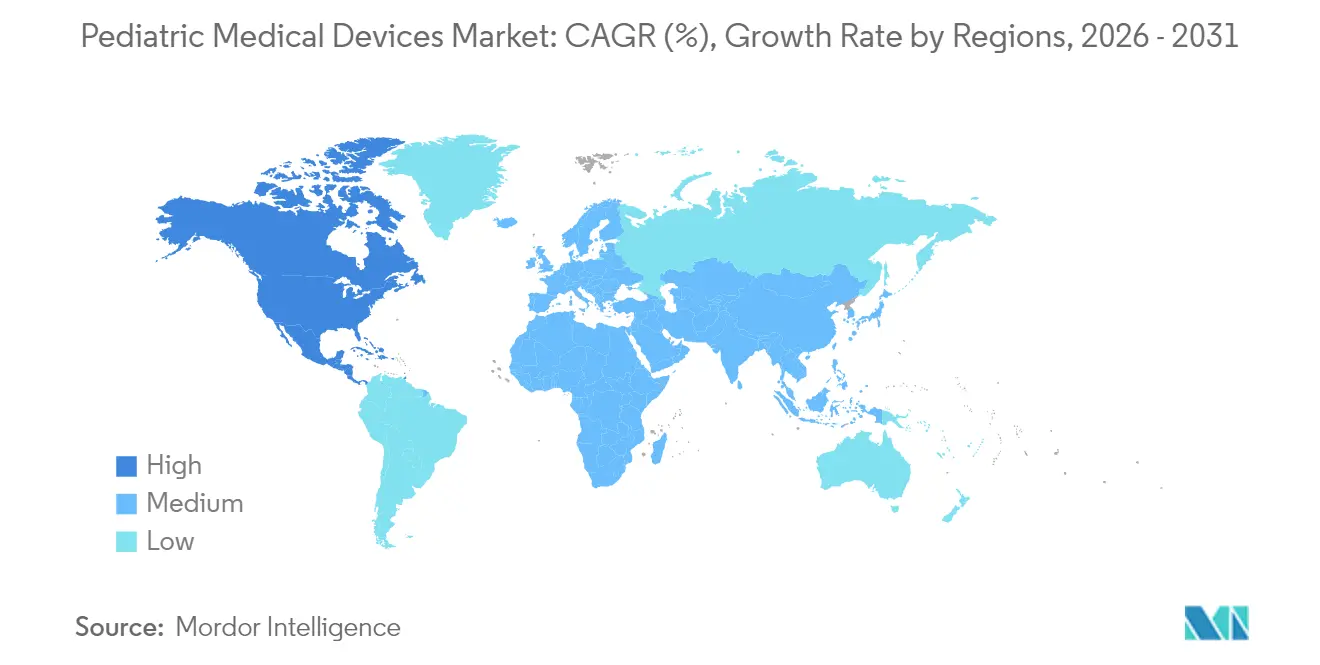
- By geography, North America accounted for 43.10% of the 2025 pediatric medical devices market share; Asia-Pacific is the fastest-growing region at a 7.08% CAGR.
Note: Market size and forecast figures in this report are generated using Mordor Intelligence’s proprietary estimation framework, updated with the latest available data and insights as of 2026.
Market Trends and Insights
Drivers Impact Analysis of Global Pediatric Medical Devices Market*
| Driver | (~) % Impact on CAGR Forecast | Geographic Relevance | Impact Timeline |
|---|---|---|---|
| Rising pre-term birth incidence | +1.2% | Global, with highest impact in North America and developing regions | Medium term (2-4 years) |
| Expansion of pediatric-focused hospital infrastructure | +0.8% | Asia-Pacific core, spill-over to MEA and Latin America | Long term (≥ 4 years) |
| Rapid adoption of minimally-invasive cardiac interventions | +1.0% | North America & EU, expanding to APAC | Short term (≤ 2 years) |
| Home-based remote monitoring reimbursement roll-outs | +0.7% | North America, early adoption in EU | Medium term (2-4 years) |
| New reimbursement codes in the US and parts of Europe | +0.5% | North America & EU | Short term (≤ 2 years) |
| 3D-printed patient-specific implants for rare anomalies | +0.6% | Global, led by North America and EU | Medium term (2-4 years) |
| Source: Mordor Intelligence | |||
Rising Pre-term Birth Incidence
Preterm births reached 10.4% in the United States for the third straight year. India records roughly 1.5 million premature deliveries each year, driving sustained demand for incubators, tubes, and ventilators. Such statistics oblige manufacturers to miniaturize devices and extend durability for lengthier neonatal care cycles, directly fueling the pediatric medical devices market.
Expansion of Pediatric-Focused Hospital Infrastructure
China’s “years of pediatric and mental health services” (2025-2027) program lists eight initiatives that strengthen dedicated children’s wards and specialist centers. India’s Rainbow Children’s Medicare now runs 1,715 beds across 17 hospitals with occupancy up from 44.6% to 55.4% in two fiscal years, signaling faster throughput and procurement intensity. Multilateral lenders such as the Asian Infrastructure Investment Bank finance new pediatric towers in the Philippines, where bed density remains low at 0.89 per 1,000 residents. These bricks-and-mortar expansions translate into continuous capital-equipment refreshes that underpin the pediatric medical devices market.
Rapid Adoption of Minimally Invasive Cardiac Interventions
The FDA cleared the Minima Stent System for neonates as light as 1.5 kg, posting a 97.6% procedural success rate without major complications. The Amplatzer Piccolo Occluder closes patent ductus arteriosus in premature infants with more than 98% efficacy [1]. Modified vascular plug techniques deliver 91% success in pulmonary flow restriction procedures, cutting operating time when clinicians choose the transjugular route. These outcomes shorten ICU stays and spark a long-term shift toward catheter-based solutions, enlarging the pediatric medical devices market.
Home-Based Remote Monitoring Reimbursement Roll-Outs
In its 2025 rule set, CMS raised home health payments by 2.7% and ordered agencies to publish their pediatric service capabilities. AI-enabled epidermal electronic biosensors now stick to fragile neonatal skin with minimal irritation while maintaining high-fidelity signals. The SONU Band, green-lit by the FDA in June 2025, delivers acoustic vibrational therapy and reports 80% symptom relief for congested children within 15 minutes. These reimbursements and product launches accelerate technology transfer from hospital to home, expanding addressable volume for the pediatric medical devices market.
Restraints Impact Analysis of Global Pediatric Medical Devices Market*
| Restraint | (~) % Impact on CAGR Forecast | Geographic Relevance | Impact Timeline |
|---|---|---|---|
| Small addressable patient pools limit ROI | -0.9% | Global, particularly affecting rare disease segments | Long term (≥ 4 years) |
| Stringent FDA & EU safety evidence requirements | -0.6% | North America & EU, with spillover effects globally | Medium term (2-4 years) |
| Scarcity of large, high-quality pediatric datasets | -0.4% | Global, with acute impact in emerging markets | Medium term (2-4 years) |
| Supply-chain shortages of pediatric-grade biomaterials | -0.3% | Global, with highest impact in North America & EU | Short term (≤ 2 years) |
| Source: Mordor Intelligence | |||
Small Addressable Patient Pools Limit ROI
Humanitarian approvals cover devices that treat conditions faced by fewer than 200,000 US patients annually, such as SeaStar Medical’s cartridge for pediatric acute kidney injury [2]. OrthoPediatrics, focused solely on young patients, has installed 71 orthopedic systems yet still leans on premium pricing and acquisitions to scale. Limited volumes dilute R&D payback, slowing new-product launches that would otherwise enlarge the pediatric medical devices market.
Stringent FDA & EU Safety Evidence Requirements
October 2024 FDA guidance now asks for long-term neurodevelopmental studies on neonatal devices, driving up trial costs and timelines. EU MDR 2024/1860 obliges manufacturers to log supply disruptions and extends legacy-device deadlines to 2028, adding documentation burdens [3]. Enforcement actions such as the 2024 warning letter to Trexo Robotics over design-control lapses show real financial stakes. These barriers slow market entry and temper growth in the pediatric medical devices market.
*Our forecasts treat driver/restraint impacts as directional, not additive. The impact forecasts reflect baseline growth, mix effects, and variable interactions.
Global Pediatric Medical Devices Market Segment Analysis
By Product Type:
IVD Leadership with Monitoring MomentumIVD devices captured 22.40% of the pediatric medical devices market share in 2025, underlining their centrality in clinical decision-making. Monitoring devices are projected to clock a 6.15% CAGR through 2031 as care teams transition from episodic sampling to continuous data feeds. The AI-equipped plush toy that grades infant neuro-development underscores how ambient sensors migrate into child-friendly form factors. Cardiology devices keep benefitting from catheter-based breakthroughs such as the Minima Stent. Respiratory and anesthesia platforms hold steady given the high volume of premature births that need ventilatory support. Supply tightness in specialty polymers occasionally forces clinicians to repurpose adult lines, highlighting the importance of material innovation for the pediatric medical devices market.
Diagnostic imaging players add deep-learning modules to ultrasound and X-ray consoles, while ENT and mobility aids receive a boost from wearables such as the SONU Band. Collectively these innovations anchor the diversification that sustains the pediatric medical devices market size across hospital and home settings.

By End User:
Hospital Dominance Confronts Home-Care SurgeHospitals controlled 53.70% of revenue in 2025 thanks to high-complexity procedures and integrated supply contracts. Yet homecare settings are set to rise 6.55% annually as reimbursement and technology converge to allow advanced interventions outside hospital walls. Laboratories face shrinking sample volumes as point-of-care analyzers and minimally invasive sensors redirect testing closer to patients. Children’s clinics adopt compact ultrasound units that quicken triage and improve throughput. The pediatric medical devices market size for ambulatory surgeries inches up as transcatheter approaches remove the need for open repair. AI-supported wound vacuums and biosensors enable families to manage recovery at home, easing the inpatient load and reshaping demand patterns in the pediatric medical devices market.
By Care Setting:
Inpatient Stability Versus Home-Based InnovationInpatient facilities still house 50.80% of the 2025 market by value but growth is subdued compared with other settings. Emergency rooms and critical-care bays remain indispensable for fragile neonates, maintaining baseline equipment cycles. Outpatient suites gain share through same-day transcatheter fixes that sidestep overnight admission. Above all, home-based care, forecast to grow 6.95% a year, unlocks new procurement channels for wireless monitors, wearable stimulators, and AI-guided therapy apps. The SONU Band’s clearance illustrates how software-defined hardware now qualifies for reimbursements traditionally reserved for durable equipment. As a result, the pediatric medical devices market keeps tilting toward distributed use environments that favor lightweight, user-friendly designs.
By Technology:
AI-Enabled Devices Disrupt Conventional WorkflowsConventional platforms still represent 48.20% of 2025 spend because they fit entrenched care protocols and carry broad regulatory familiarity. However, AI-enabled devices are forecast to climb 7.05% annually as algorithms improve accuracy and personalize therapy. Nanowear’s cuffless blood-pressure patch secured 510(k) status and targets pediatric hypertension monitoring. 3D-printed implants, including bioresorbable heart valves from Georgia Tech partners, aim to negate repeat surgeries by adapting to growth. Catheter-based innovations extend minimally invasive therapy into younger cohorts. Hybrid designs that layer analytics over mechanical components stand to widen the value proposition, deepening the footprint of the pediatric medical devices market.
Geography Analysis
North America Pediatric Medical Devices Market
North America held 43.10% of the pediatric medical devices market in 2025, a position powered by reliable reimbursement and an active regulatory pipeline. The FDA’s breakthrough label for the Minima Stent and the June 2025 green light for the SONU Band show how rapid clearances translate research into bedside tools fda.gov. CMS’s 2025 payment rule further strengthens home-based adoption. Canada benefits from harmonized rules and cross-border device flows, while Mexico’s infrastructure gap leaves headroom for foreign suppliers.
APAC Pediatric Medical Devices Market
Asia-Pacific is forecast to grow at 7.08% through 2031, outpacing all other regions. China’s 2025-2027 pediatric service drive sets a policy anchor, whereas India’s pediatric segment, equal to 33% of national healthcare spending, should reach USD 33.5 billion by 2026. South Korea’s escalating preterm costs and Japan’s early adoption of catheter therapies create fertile ground for high-end devices. Regional research alliances are harmonizing practice standards and expanding the pediatric medical devices market size for multinational and domestic vendors alike.
EMEA and South America Pediatric Medical Devices Market
Europe leverages EU MDR 2024/1860 to tighten safety while offering transition windows to 2028. Germany, France, and the United Kingdom spearhead R&D programs, whereas Spain and Italy scale pediatric ICUs. Lebanon’s zero-mortality outcome in hybrid palliation of hypoplastic left heart syndrome underscores how clinical excellence can emerge beyond traditional hubs. South America and the Middle East & Africa record slower adoption but draw support from global lenders and multinational donations that gradually grow the pediatric medical devices market.
Regulatory Landscape
Pediatric medical devices operate under high-evidence pathways in major markets. In the United States, FDA requirements cover pediatric use information in submissions when available, and they also require sponsors to justify bridging from adult data when disease course and device effects are sufficiently similar. The Pediatric Medical Device Safety and Improvement Act framework continues to shape reporting and post-market oversight, and FDA guidance updates, including the October 2024 emphasis on longer-term neurodevelopmental follow-up for neonatal devices, raise the bar for clinical evidence and documentation.
In Europe, market access is governed by the EU Medical Devices Regulation (EU) 2017/745 (MDR). Transition timelines for legacy devices extend into 2027/2028, which adds notified-body capacity constraints and compliance pressure for lower-volume pediatric SKUs. Alongside MDR implementation, the European Commission announced a proposal in December 2025 to simplify elements of the EU medical device regulatory system, highlighting policy attention on administrative burden and continuity of supply for essential devices, including pediatric categories.
Value Chain Analysis
The pediatric medical devices value chain begins with pediatric need identification and design controls that account for growth, skin fragility, and small anatomy. It then moves through prototyping, verification and validation, and clinical evidence generation at children hospitals and neonatal units. Component sourcing and manufacturing are often constrained by low volumes and specialty inputs, particularly pediatric-grade biomaterials and miniaturized components, which drives many suppliers toward manual or semi-manual assembly and multi-supplier bill-of-materials rather than fully integrated pediatric-specific sets.
Regulatory and clinical stakeholders also carry outsized influence in the chain because access depends on labeled indications and sustained post-market surveillance. FDA shortage tracking and broader public discussions on medical-device supply chain vulnerabilities point to how sterilization capacity constraints (including ethylene oxide availability), quality issues, and niche manufacturing capacity can disrupt critical pediatric products. Multi-stakeholder networks such as SHIP-MD (System of Hospitals for Innovation in Pediatrics - Medical Devices) are used to strengthen evidence packages and improve the efficiency of pediatric submissions, while hospitals and group purchasing structures increasingly factor supply resilience and continuity reporting into procurement decisions.
Competitive Landscape
The pediatric medical devices market shows moderate fragmentation, with the top five suppliers holding an estimated 45-50% combined share. Abbott and Medtronic expand automated insulin delivery partnerships, integrating sensors and pumps for young diabetics. GE HealthCare teams with NVIDIA to embed real-time AI into portable ultrasound, and Cincinnati Children’s Hospital co-creates innovation hubs that trial these tools in situ. Edwards Lifesciences recently purchased Innovalve Medical to lock in mitral-valve IP aimed at small-body implants.
Focused players use specialization to punch above their size. OrthoPediatrics dedicates its entire catalogue to children and bolstered capacity by acquiring Boston Orthotics & Prosthetics. SeaStar Medical works the Humanitarian Device Exemption route to commercialize filtration cartridges for pediatric acute kidney injury. Disruptors such as SoundHealth prove niche breakthroughs can scale once a clear reimbursement path emerges. Supply-chain resilience now factors into bidding, with buyers favoring vendors that meet the EU’s new disruption-reporting rule.
Competition is shifting from pure hardware to solution ecosystems that fuse AI, connectivity, and personalized geometry. Vendors that master rapid regulatory filings and material substitutes for constrained polymers gain pricing leverage and defensive moats in the evolving pediatric medical devices market.
Global Pediatric Medical Devices Industry Leaders
-
TSE MEDICAL
-
Hamilton Medical
-
Fritz Stephan GmbH
-
GE Healthcare
-
Ningbo David Medical Device Co. Ltd
- *Disclaimer: Major Players sorted in no particular order

Global Pediatric Medical Devices Market Companies Covered in this Report
- Abbott Laboratories
- Medtronic
- GE Healthcare
- Koninklijke Philips
- Johnson & Johnson (Ethicon & DePuy Synthes)
- Siemens Healthineers
- Boston Scientific
- Becton Dickinson & Co.
- Smiths Group
- Cook Group
- Edward Lifesciences
- Atom Medical
- Hamilton Medical
- Phoenix Medical Systems
- TSE Medical
- David Medical
- Fritz Stephan
- Elektro-M
- Trimpeks
- Novonate
- Stryker
- Masimo
- Hill-Rom
Market Opportunities and Future Outlook
White space remains most visible where anatomy-specific sizing and long-duration support are required, especially in neonatal and pediatric intensive care hardware and pediatric cardiac support. Shortages and limited labeled options continue to surface in clinical practice. Device makers have room to differentiate through pediatric-first configurations of monitoring and respiratory platforms, combining miniaturized sensors with child-friendly, skin-safe wearables and software features designed to reduce alarm fatigue and support home-based workflows. This direction is reflected in the FDA clearance cadence for pediatric-oriented connected devices, including the FDA green light for SoundHealth's SONU Band in June 2025, and in manufacturers expanding oxygen-management capabilities across ventilator and high-flow therapy platforms.
Opportunity also comes from reducing the evidence-generation burden that slows commercialization for small cohorts. Programs and infrastructure that de-risk trials and regulatory submissions, including the FDA-supported Pediatric Device Consortia grants program (authorized under the 2007 pediatric device law and reauthorized via the 2022 Food and Drug Omnibus Reform Act), and hospital-led innovation networks such as SHIP-MD, are building more standardized pathways for prototypes to progress into labeled products. In parallel, policy actions in Europe, including the European Commission's December 2025 proposal to simplify aspects of the EU medical device framework, signal an active push to reduce administrative friction that has been associated with constrained availability for certain low-volume device categories.
Recent Industry Developments in Global Pediatric Medical Devices Market
- June 2026: Hamilton Medical introduced O2 assist oxygen-management functionality across its HAMILTON-C6, HAMILTON-C1, HAMILTON-T1 ventilators and the HAMILTON-HF90 high-flow oxygen therapy device for adult, pediatric, and neonatal use. The release expands closed-loop style oxygen support features into pediatric care environments where workload and titration variability are high, strengthening platform stickiness in ICUs and transport settings.
- June 2026: The FDA issued an Early Alert tied to GE HealthCare infant resuscitation systems (Giraffe and Panda) after a customer notification dated May 8, 2026 highlighted a blender knob shaft issue that can lead to incorrect oxygen delivery in certain configurations. The action increases compliance and service intensity for installed bases in neonatal resuscitation, and it can temporarily reshape purchasing decisions toward suppliers with demonstrable risk-management and field-correction capacity.
- June 2025: SoundHealth received FDA authorization for the SONU Band, an AI-enabled wearable aimed at relieving moderate-to-severe nasal congestion in children aged 12 and older. The clearance reinforces momentum for pediatric-labeled, software-forward devices that can be deployed outside acute care, supporting the shift of selected therapies and monitoring into home and ambulatory settings.
Global Pediatric Medical Devices Market Report Scope and Research Methodology
Market Definition and Coverage
For this study, the pediatric medical devices market covers medical devices used to diagnose, monitor, support, or treat patients from birth through 18 years, where product use and sizing are designed or labeled for pediatric needs and care settings.
Scope exclusions: We exclude adult-only devices that are simply used in pediatric wards, routine single-use disposables, and stand-alone software that is not delivered as part of a regulated device system.
Segments Covered in This Report
- By Product Type
- IVD Devices
- Cardiology Devices
- Anesthesia & Respiratory Care Devices
- Neonatal ICU Devices
- Monitoring Devices
- Diagnostic Imaging Devices
- Others (ENT, Ortho, Mobility Aids)
- By End-User
- Hospitals
- Diagnostic Laboratories
- Pediatric Clinics
- Ambulatory Surgical Centers
- Homecare Settings
- By Care Setting
- Inpatient Care
- Outpatient Care
- Home-based Care
- Emergency & Critical Care
- By Technology
- Conventional Devices
- Wearable & Connected Devices
- AI-Enabled Devices
- 3D-Printed Patient-Specific Devices
- Minimally-Invasive Catheter-Based
- By Geography
- North America
- United States
- Canada
- Mexico
- Europe
- Germany
- United Kingdom
- France
- Italy
- Spain
- Rest of Europe
- Asia-Pacific
- China
- Japan
- India
- Australia
- South Korea
- Rest of Asia-Pacific
- Middle East & Africa
- GCC
- South Africa
- Rest of Middle East & Africa
- South America
- Brazil
- Argentina
- Rest of South America
- North America
Data Sources, Market Sizing, and Validation
Desk Research
Desk research is used to map the demand pool, care pathways, and the practical definition of what counts as a pediatric device in revenue terms. We review public sources such as the US FDA device databases, the US CDC and WHO child health statistics, OECD health expenditure indicators, and World Bank population and age cohort data. For supporting context, we also lean on peer-reviewed clinical journals on neonatal and pediatric care outcomes, and materials from pediatric and medical device associations.
On the supply side, we screen company annual reports, regulatory press releases, investor presentations, and earnings transcripts to understand product mix and regional exposure, followed by a light use of paid subscriptions for company financials and patent databases when product positioning needs clarification. Because public reporting is uneven across device categories, these inputs are mainly used to set guardrails, not to mechanically sum revenues. The sources cited here are illustrative only, and many other references are also used for collection, cross-checking, and clarification.
Primary Interviews and Surveys
Primary work is used to pressure-test the sizing logic, tighten assumptions, and validate what gets counted as pediatric-specific revenue versus broader device sales. We speak with manufacturers, distributors, hospital procurement, and clinicians across key regions so the model reflects how volumes, pricing, and adoption differ between neonatal ICU, hospital pediatrics, and outpatient pediatric care. Inputs are reconciled across respondent groups so any single viewpoint does not drive the final outcome.
Distribution of primary research fieldwork respondents
| Company type | Respondent position | Region |
|---|---|---|
| Top tier: 28% | CXOs: 16% | APAC: 38% |
| Mid tier: 50% | Functional/Unit leaders: 37% | EMEA: 36% |
| Smaller Players: 22% | Managers: 47% | Americas: 26% |
Market-Sizing & Forecasting
Sizing starts with a top-down build where pediatric population cohorts and care utilization patterns are translated into device demand signals, and then converted into value using category-level pricing and replacement cycles. In practice, the demand pool is shaped using indicators such as preterm birth and NICU admission rates, pediatric procedure volumes in key specialties, imaging and monitoring utilization in children, device replacement and service life norms, and the pace of pediatric-specific regulatory clearances.
After the top-down totals are produced, we corroborate them using selective bottom-up approximations, including sampled supplier revenue splits by pediatric lines, channel checks on typical average selling prices, and cross-checks against hospital procurement patterns. Where bottom-up data is patchy, gaps are handled through conservative proxy logic, such as using adjacent pediatric device categories with similar utilization and price behavior, followed by a final adjustment once interview feedback converges.
For forecasting, we mainly apply scenario analysis supported by trend-based extrapolation, where the scenarios are linked to variables like birth trends, pediatric chronic disease burden, healthcare spending direction, and adoption timing for newer pediatric-sized solutions. Assumptions are refined so the forecast stays consistent with what clinical users and commercial teams expect to be feasible over the period.
Data Validation & Update Cycle
Validation is done by comparing model outputs against independent signals, including regional healthcare spending direction, pediatric patient volumes, and category-level adoption narratives that are repeatedly raised in interviews. Outliers are flagged, and the drivers behind the variance are reviewed so that mix shifts or one-time spikes do not get treated as steady demand.
Before sign-off, the estimates go through multi-step analyst reviews where inputs, formulas, and year-to-year movements are checked for consistency. When a material event occurs, such as a major regulatory change or a large shift in hospital purchasing behavior, we re-contact sources to confirm what changed and update the assumptions. The report is refreshed annually, and a final pre-delivery review is done so clients receive the most current view.
Mordor Intelligence's Pediatric Medical Devices Market Size Measured Against Other Published Estimates
Different publishers often report different market sizes for pediatric medical devices because they do not always count the same device boundaries, they pick different base years, and they apply different pricing and adoption assumptions for the forecast period.
By checking pediatric-only labeling, refreshing mix and pricing assumptions by device category and region, and then validating against care utilization signals, Mordor Intelligence keeps the estimate tied to pediatric-specific revenue instead of folding in broad adult device sales that happen to be used in children.
Benchmark comparison
| Source | Market Size | Gaps in Research Methodology |
|---|---|---|
| Mordor Intelligence | USD 46.11 B (2026) | |
| Healthcare Publisher A | USD 30.70 B (2023) | Uses an earlier base year and a different forecast window, and the scope appears broader across general pediatric care devices without consistently separating pediatric-specific labeling from wider device revenue. |
| Research House B | USD 17.03 B (2024) | Applies a narrower value capture with a long-dated forecast frame, and the product list suggests different inclusion rules, which can undercount hospital-driven categories when pediatric use is embedded in larger system purchases. |
The spread in published values is largely explained by what gets counted as pediatric-specific revenue, plus differences in base year choice and how pricing progression is treated over time. With clearly stated scope boundaries and repeatable checks against utilization and category mix, the model is easier to audit and update when real-world demand signals move.
Key Questions Answered in the Report
How big is the Global Pediatric Medical Devices Market?
The Global Pediatric Medical Devices Market size is expected to reach USD 46.11 billion in 2026 and grow at a CAGR of 5.70% to reach USD 60.82 billion by 2031.
Which product segment leads the market?
IVD devices held the top position with 22.40% market share in 2025.
Who are the key players in Global Pediatric Medical Devices Market?
TSE MEDICAL, Hamilton Medical, Fritz Stephan GmbH, GE Healthcare and Ningbo David Medical Device Co. Ltd are the major companies operating in the Global Pediatric Medical Devices Market.
Which is the fastest growing region in Global Pediatric Medical Devices Market?
Asia-Pacific is projected to expand at a 7.08% CAGR through 2031 on the back of demographic growth and targeted healthcare investments.
Which region has the biggest share in Global Pediatric Medical Devices Market?
In 2025, the North America accounts for the largest market share in Global Pediatric Medical Devices Market.