
Pediatric Healthcare Market Size and Share
Market Overview
| Study Period | 2020 - 2031 |
|---|---|
| Market Size (2026) | USD 16.53 Billion |
| Market Size (2031) | USD 19.90 Billion |
| Growth Rate (2026 - 2031) | 3.78 % |
| Fastest Growing Market | Asia Pacific |
| Largest Market | North America |
| Market Concentration | Medium |
Major Players *Disclaimer: Major Players sorted in no particular order Image © Mordor Intelligence. Reuse requires attribution under CC BY 4.0. | |
Pediatric Healthcare Market Analysis by Mordor Intelligence
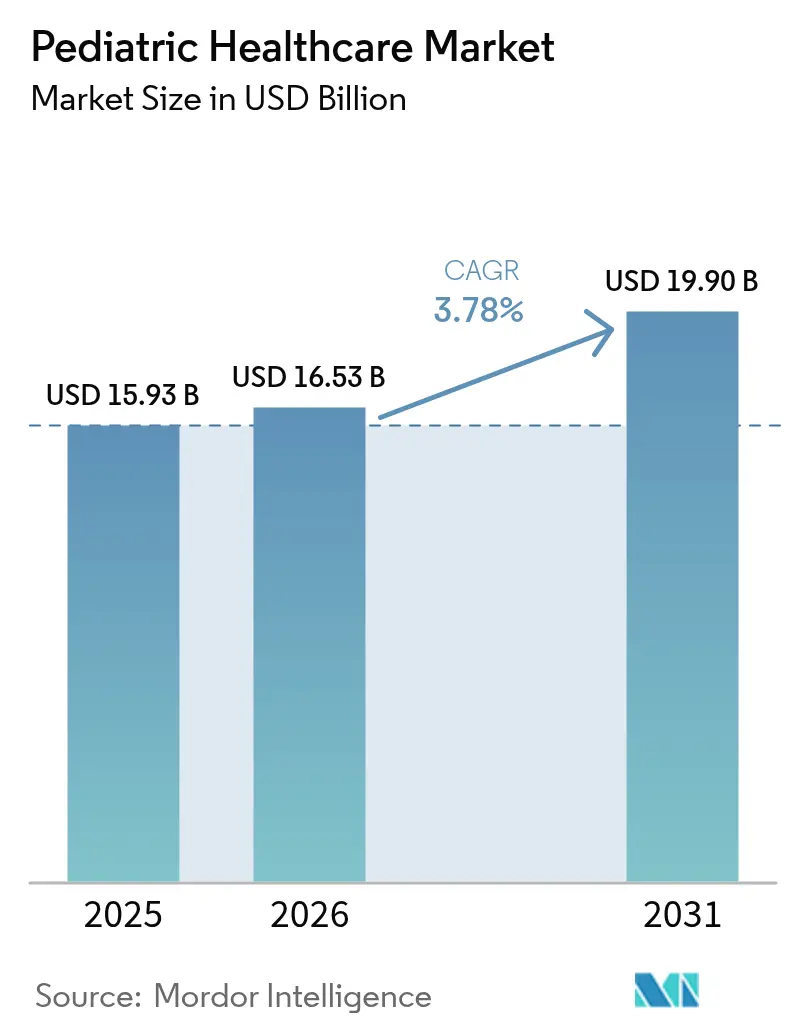
The Pediatric healthcare market size was valued at USD 15.93 billion in 2025 and estimated to grow from USD 16.53 billion in 2026 to reach USD 19.90 billion by 2031, registering a 3.78% CAGR between 2026 and 2031. Gene therapies are entering routine clinical pathways, pushing payers toward outcomes-based contracts, while artificial intelligence tools are shortening diagnostic queues in radiology and behavioral health. Remote monitoring platforms are gaining favor because they lower emergency-department use and let clinicians intervene earlier. High-income governments continue to expand immunization budgets, guaranteeing vaccine uptake even as digital therapeutics draw a rising share of venture funding. Meanwhile, investment in micro-hospital formats brings specialty care closer to peri-urban neighborhoods, tempering the capacity gap that once funneled every complex case to tertiary centers.
Key Report Takeaways
- By product type, vaccines led with a 38.55% share of the pediatric healthcare market in 2025, while digital health solutions posted the fastest growth at a 5.25% CAGR through 2031.
- By therapeutic area, infectious diseases accounted for 33.53% of 2025 revenue, whereas oncology is forecast to expand at a 4.75% CAGR to 2031.
- By age group, school-age children (2–11 years) accounted for 42.15% of demand in 2025; adolescents (12–18 years) are advancing at a 4.82% CAGR on the back of digital mental health tools.
- By care setting, hospitals accounted for 54.65% of 2025 revenue; telehealth is growing at a 6.32% CAGR as several U.S. states lock in payment parity.
- By end user, public providers accounted for 58.55% of spending in 2025, yet private operators are growing at a 5.22% CAGR, signaling affluent families' willingness to bypass public queues.
- By geography, North America accounted for 35.23% revenue in 2025, while Asia-Pacific leads growth at 6.12% CAGR through 2031.
Note: Market size and forecast figures in this report are generated using Mordor Intelligence’s proprietary estimation framework, updated with the latest available data and insights as of 2026.
Market Trends and Insights
Drivers Impact Analysis of Pediatric Healthcare Market*
| Driver | (~) % Impact on CAGR Forecast | Geographic Relevance | Impact Timeline |
|---|---|---|---|
| Routine Pediatric-Immunization Funding Momentum | +0.9% | Global, concentrated in GAVI-eligible nations and the U.S. VFC program | Medium term (2-4 years) |
| Gene-Therapy Approvals for Rare Pediatric Diseases | +0.7% | North America, EU, urban hubs in China and India | Long term (≥ 4 years) |
| AI-Assisted Pediatric Radiology Adoption | +0.6% | North America, Western Europe, APAC tier-1 cities | Medium term (2-4 years) |
| Re-Emergence of RSV and Other Respiratory Outbreaks | +0.8% | Global, with acute seasonal impact in temperate zones | Short term (≤ 2 years) |
| School-Based Telehealth Roll-Outs | +0.5% | United States, Canada, pilots in the UK and Australia | Medium term (2-4 years) |
| Micro-Hospital Formats for Children | +0.3% | Emerging markets in APAC, Latin America, Middle East | Long term (≥ 4 years) |
| Source: Mordor Intelligence | |||
Routine Pediatric-Immunization Funding Momentum
Record sums are flowing into childhood immunization schedules. GAVI allocated USD 9 billion for 2024-2025 to subsidize HPV, pneumococcal conjugate, and rotavirus vaccines, assuring manufacturers of multi-year demand[1]. In the United States, the Vaccines for Children program distributed 84 million doses in 2024, 6% above 2023 volumes, as catch-up campaigns recaptured pandemic-era defaulters. Guaranteed procurement compresses time-to-market for combination vaccines, yet the infectious-disease focus crowds out research on adolescent-specific shots for non-communicable threats. Manufacturers now aim to bundle multiple antigens to maximize throughput on established filling lines, a strategy that also reduces cold-chain burden. Still, divergent political attitudes toward mandates in some regions limit the penetration of newly recommended vaccines.
Gene-Therapy Approvals for Rare Pediatric Diseases
Five pediatric gene therapies were approved in 2024-2025, each priced above USD 2 million per patient, shifting conversations from dose-based billing to milestone-based contracts. Surrogate endpoints, such as enzyme activity, enable earlier launches, enticing venture capital into next-generation vectors. Accelerated pathways shave 18-24 months off development cycles, but questions remain on durability and equitable rollout in middle-income markets that lack long-term monitoring infrastructure. Hospitals must upgrade virology suites to handle on-site reconstitution, and payers are layering annuity payments over five years to hedge therapeutic uncertainty. The Pediatric healthcare market is poised to absorb more one-time curative modalities as manufacturing yields climb.
AI-Assisted Pediatric Radiology Adoption
Twelve pediatric-tailored AI tools cleared by the FDA between 2024 and 2025 now triage neonatal hemorrhage, scoliosis, and chest infections. Early adopters report 30-40% faster turnaround times, letting general radiologists flag urgent cases before subspecialist review. Algorithmic bias remains a hurdle because training images skew toward older children in high-income geographies. Regulators have begun requiring real-world performance audits, which could slow procurement but will standardize quality baselines. Vendors are partnering with children’s hospitals in underrepresented regions to diversify datasets, aiming to lift accuracy for neonates and minority populations.
Re-Emergence of RSV and Other Respiratory Outbreaks
RSV hospitalizations dipped by 43% in locales that deployed monoclonal prophylaxis, yet the pathogen surged overall as pandemic immunity debt exposed new birth cohorts. The WHO’s 2024 endorsement of maternal RSV vaccination introduces dual-prophylaxis choices, maternal shots plus infant antibodies, confusing payers on cost-effectiveness. The bifurcated approach splits the Pediatric healthcare market between vaccine and biologic suppliers, each lobbying ministries for preferential placement on formularies. Rapid antigen tests are selling briskly because clinicians want respiratory differentiation at the bedside instead of waiting for central labs. Device makers are bundling RSV, influenza, and COVID-19 assays into single cartridges to streamline triage in emergency departments.
Restraints Impact Analysis of Pediatric Healthcare Market*
| Restraint | (~) % Impact on CAGR Forecast | Geographic Relevance | Impact Timeline |
|---|---|---|---|
| Rising Antimicrobial Resistance in Children | -0.6% | Global, highest in South Asia and Sub-Saharan Africa | Long term (≥ 4 years) |
| Gap in Pediatric-Specific Device Reimbursement | -0.4% | United States, fragmented in EU and emerging markets | Medium term (2-4 years) |
| Dearth of Long-Term Safety Data for mRNA Vaccines | -0.3% | Global, heightened scrutiny in EU | Medium term (2-4 years) |
| Shortage of Pediatric Subspecialists in Low-Income Regions | -0.7% | Sub-Saharan Africa, South Asia, rural Latin America | Long term (≥ 4 years) |
| Source: Mordor Intelligence | |||
Rising Antimicrobial Resistance in Children
Antimicrobial resistance killed 1.14 million children under five in 2024, with South Asia and Sub-Saharan Africa reporting resistance above 50% for third-generation cephalosporins[2]. Clinicians escalate to carbapenems as first-line therapy, quickening the march toward pan-resistant strains. Pediatric antibiotic pipelines stay thin because short courses and stewardship rules limit commercial returns. Multilateral donors now fund “pull” incentives, yet uptake remains slow. Without rapid diagnostics, physicians still prescribe empirically, compounding selection pressure.
Shortage of Pediatric Subspecialists in Low-Income Regions
China logged 0.6 pediatricians per 1,000 children in 2025, below the 1.0 benchmark, while many African countries reported fewer than 0.1 pediatric cardiologists per million children[3]. Brain drain to urban or foreign posts erodes already thin rosters. Telehealth only partly fills the gap because broadband remains patchy outside metro cores. Training consortia are expanding fellowship seats, but mentorship shortages hamper skill transfer. The constraint also limits enrollment in clinical trials, slowing the generation of evidence on region-specific disease burdens.
*Our forecasts treat driver/restraint impacts as directional, not additive. The impact forecasts reflect baseline growth, mix effects, and variable interactions.
Pediatric Healthcare Market Segment Analysis
By Product Type:
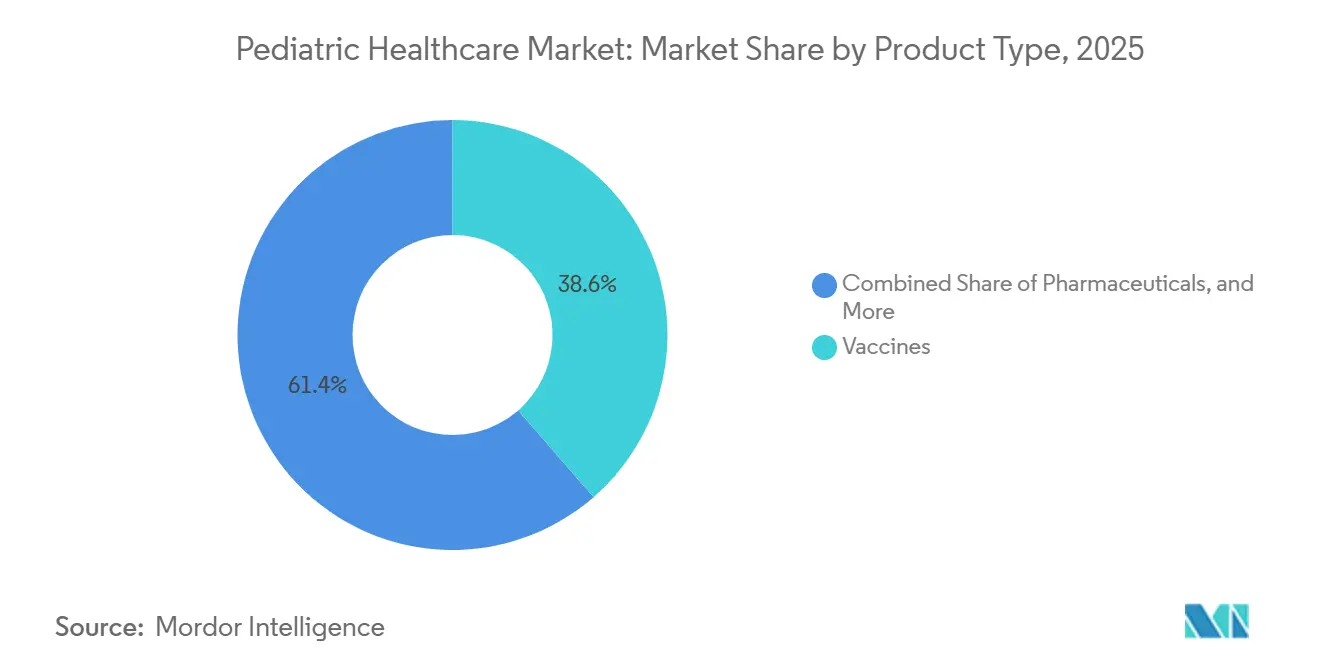
Vaccines Lead, Digital Tools AccelerateVaccines accounted for 38.55% of 2025 revenue, anchoring the Pediatric healthcare market through stable procurement tied to national schedules. The Pediatric healthcare market size for digital health solutions is projected to advance at a 5.25% CAGR, the fastest among categories, as payers accept that remote monitoring curbs costly admissions. Pharmaceutical revenues grow modestly because biosimilar erosion offsets gains from orphan drugs. Device makers benefit from miniaturization, translating adult inventions into child-sized form factors that drive adherence. Services revenue spans inpatient care, outpatient consults, and expanding home health visits, optimized by virtual check-ins.
Digital platforms embed AI to flag deteriorating vitals, allowing clinicians to intervene before crises. FDA clearance of Canvas Dx for early autism screening showed regulators’ willingness to back algorithmic assessments[4]. Vaccines for emerging pathogens will deliver incremental gains, but finite schedules cap upside. Manufacturers respond with multivalent formulations that free clinic slots and attract bundled tenders. Overall, the Pediatric healthcare market continues to balance preventive biologics with technology-enabled chronic-care management.

By Therapeutic Area:
Infectious Diseases Dominate, Oncology SurgesInfectious diseases comprised 33.53% of therapeutic spending in 2025, driven by respiratory and vaccine-preventable illnesses. Oncology is on track for a 4.75% CAGR through 2031, driven by CAR-T therapies and earlier tumor detection enabled by expanded newborn screening. Respiratory disorders benefit from monoclonals that extend dosing intervals, while neurological portfolios grow as gene therapies target intractable epilepsies. Cardiovascular interventions shift toward catheter-based repairs, reducing hospital days.
The Pediatric healthcare market for oncology will expand as more solid-tumor cell therapies, such as afamitresgene autoleucel, reach adolescents. Yet capacity constraints for apheresis and cytokine-management beds could bottleneck penetration. Infectious-disease allocations may fall marginally as RSV prophylaxis dampens hospital costs, but persistent funding for routine vaccines keeps the category atop spending tables.
By Age Group:
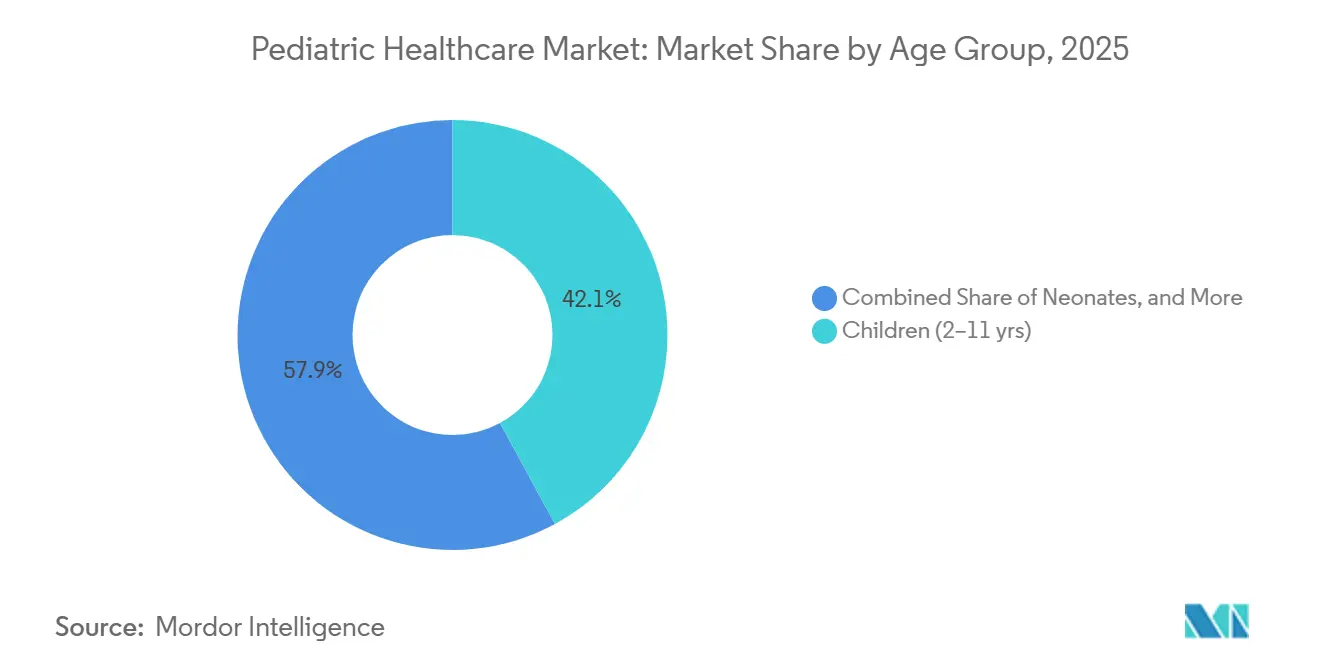
School-Age Children Largest, Adolescents FastestSchool-age children (2–11 years) generated 42.15% of 2025 revenue, reflecting frequent well-child visits and high vaccine uptake. Adolescents (12–18 years) will record the fastest growth at a 4.82% CAGR, driven by digital therapeutics for mental health and HPV vaccine catch-ups. Neonates represent a smaller slice but command higher per-patient spend due to intensive-care technology.
The Pediatric healthcare market share for adolescents will rise as school-based telehealth normalizes behavioral screenings. Meanwhile, advances in non-invasive ventilation and phototherapy boost neonatal outcomes, though reimbursement lags in lower-income systems. Tailoring product design to age-specific ergonomics remains an R&D priority.
By Care Setting:
Hospitals Anchor, Telehealth ExpandsHospitals accounted for 54.65% of 2025 revenue because they are the only providers of surgery, ICU, and advanced imaging. Telehealth will climb at a 6.32% CAGR, propelled by extended reimbursement through December 2025 and growing clinician comfort with asynchronous consults. Clinics consolidate to negotiate better payer rates and invest in interoperable records.
The Pediatric healthcare market size in home care is rising as payers quantify savings from early discharge, supplemented by remote monitoring. Licensing barriers across state lines still restrict platform scale, but interstate compacts are under discussion. Hospitals respond by creating virtual wards, protecting revenue as inpatient days decline.
By End User:
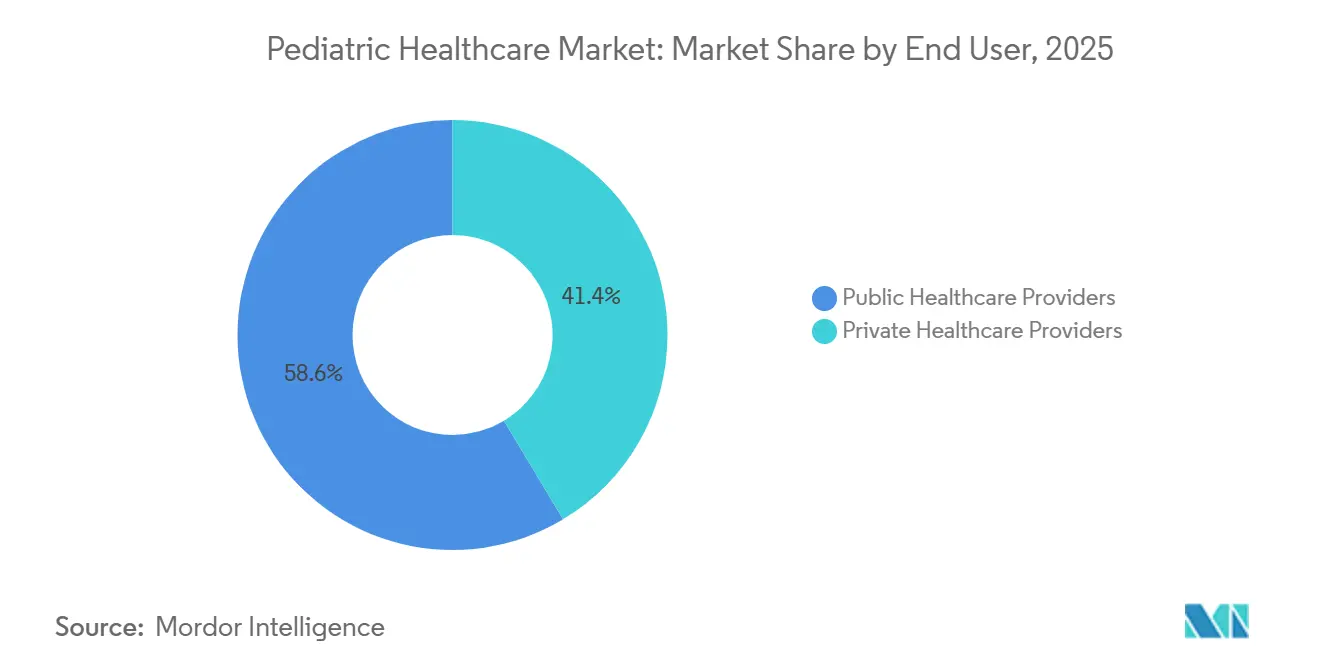
Public Providers Lead, Private Sector GainsPublic entities accounted for 58.55% of 2025 spending, underpinned by insurance schemes such as Medicaid and the NHS. Private operators will outpace at a 5.22% CAGR as families pay for shorter queues and novel diagnostics. Private equity’s USD 4.2 billion bet on pediatric urgent-care centers underscores confidence in cash-pay niches.
Innovation often debuts in private settings, then trickles to public systems once cost curves fall. This diffusion lag risks widening outcome disparities, prompting policymakers to pilot voucher schemes that let public patients access private facilities for high-priority services. The Pediatric healthcare industry thus faces a balancing act between entrepreneurial agility and universal access.
Geography Analysis
North America Pediatric Healthcare Market
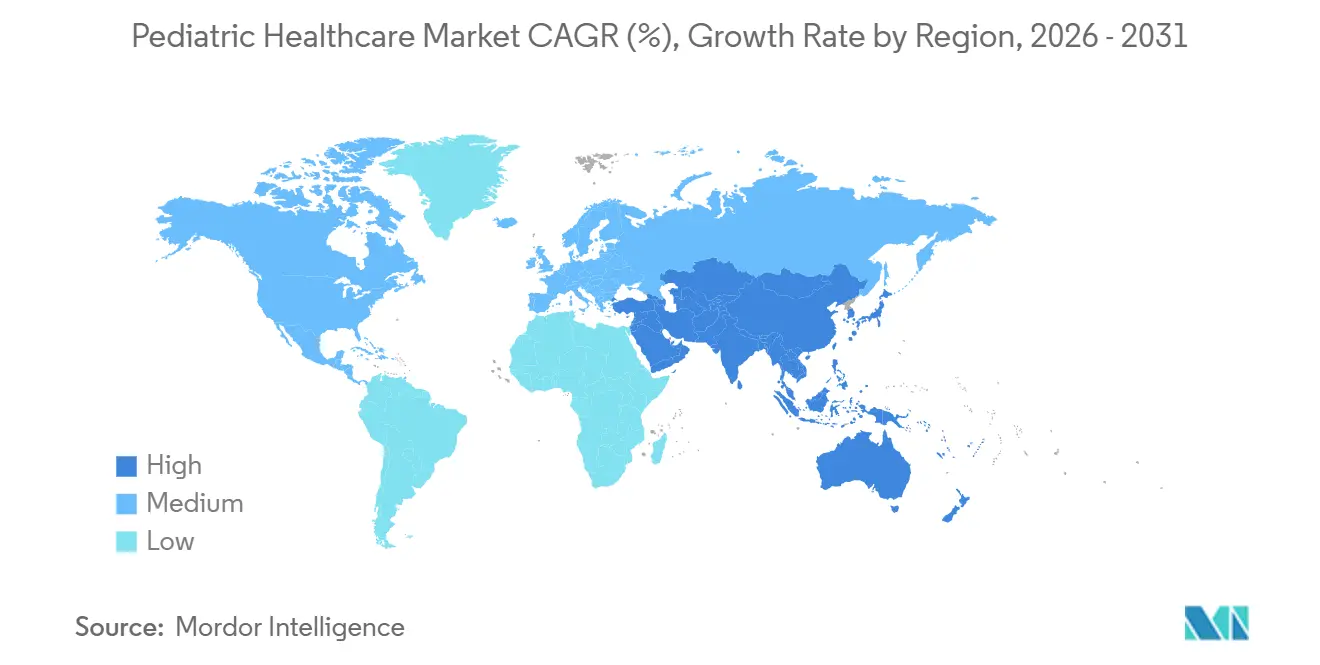
North America accounted for 35.23% of global revenue in 2025, driven by high per-capita outlays and a dense network of children’s hospitals. Value-based contracts are nudging providers toward preventive interventions that curb emergency utilization. The Pediatric healthcare market in the region is expected to grow steadily as gene therapies debut at flagship centers, though payer scrutiny of million-dollar price tags intensifies.
APAC Pediatric Healthcare Market
Asia-Pacific will record a 6.12% CAGR to 2031 as China and India expand pediatrician pipelines and upgrade county-level hospitals. Middle-class demand for premium care sparks joint ventures with multinational device makers that localize production to sidestep tariffs. In Southeast Asia, micro-insurers bundle telehealth consults with wellness apps, widening access among gig-economy workers.
EMEA Pediatric Healthcare Market
Europe enjoys universal coverage but faces stalling birth rates in Germany and Italy, tempering volume growth. Still, EU funds are modernizing neonatal ICUs in Eastern states, narrowing East-West equipment gaps. In the Middle East, Gulf states allocate hydrocarbon windfalls to pediatric care hubs to attract medical tourism. Africa’s fragmented infrastructure limits reach, yet pilot drone networks now ferry vaccines to remote clinics, inching coverage upward.
Regulatory Landscape
Pediatric healthcare products fall under overlapping drug, biologic, device, and combination-product rules, with regulators focused on early classification, pediatric study plans, and post-market performance monitoring. In the United States, the FDA Office of Combination Products (OCP) assigns jurisdiction for drug-device combinations under the Medical Device User Fee and Modernization Act framework, while pediatric drug development is shaped by the Pediatric Research Equity Act (PREA) and related FDA guidance on pediatric development and extrapolation.
In Europe, drug-device combinations are handled through the dual framework led by the Medical Devices Regulation (EU) 2017/745 (MDR) and In Vitro Diagnostic Regulation (EU) 2017/746 (IVDR), alongside medicinal-product requirements, including the EU Paediatric Regulation (EC) 1901/2006 and pediatric investigation plans. EMA has also formalized coordination for combination products through its Combination Products Operational Group (COMBO), reflecting tighter alignment on quality documentation and consultation routes for integral, co-packaged, and referenced devices.
Competitive Landscape
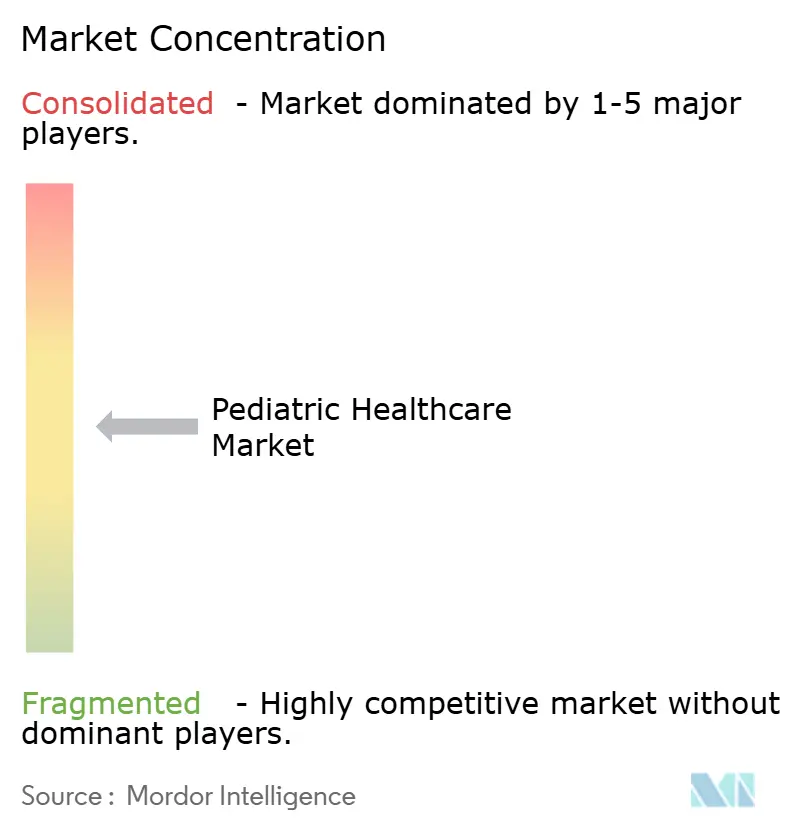
The pediatric healthcare market is moderately fragmented, with pharma majors, device giants, regional hospital chains, and digital startups vying for share. Multinationals pursue vertical integration, snapping up telehealth portals and home-health agencies to secure downstream revenues. Device manufacturers miniaturize adult platforms; Abbott’s FreeStyle Libre gained pediatric clearance for children as young as two, expanding the continuous glucose monitoring segment.
Startups leverage AI to democratize subspecialist insight, attracting licensing deals from incumbent imaging firms. Hospital groups pilot micro-hospitals to plant flags in fast-growing suburbs, offering emergency care minus tertiary overhead. Reimbursement for pediatric-specific devices remains patchy, so vendors lobby for dedicated payment codes. Overall, competition hinges on who can bundle diagnostics, therapeutics, and virtual support into seamless journeys that satisfy both payers and families.
Pediatric Healthcare Industry Leaders
-
Johnson & Johnson
-
GSK plc
-
Merck & Co., Inc.
-
Sanofi S.A
-
Pfizer Inc.
- *Disclaimer: Major Players sorted in no particular order
Pediatric Healthcare Market Companies Covered in this Report
- Abbott Laboratories
- AstraZeneca
- Cardinal Health
- Dr. Reddy’s Laboratories Ltd.
- Roche
- Fresenius
- GE HealthCare Technologies Inc.
- GlaxoSmithKline
- Johnson & Johnson
- Koninklijke Philips
- Medtronic
- Merck
- Novartis
- Pfizer
- Sanofi
- Siemens Healthineers
- Takeda Pharmaceuticals
- Teladoc Health
Market Opportunities and Future Outlook
A key whitespace is pediatric-specific device and digital solution development that can clear regulatory scrutiny without defaulting to adult-device adaptations, particularly in areas where reimbursement and evidence requirements have historically slowed productization. Non-dilutive innovation infrastructure offers a concrete de-risking path for early development: the FDA Pediatric Device Consortia (PDC) program (about USD 6 million annually) supports multi-institutional device development and has contributed to more than 2,000 project advancements, while the Consortium for Technology & Innovation in Pediatrics (CTIP) operates a USD 14 million fund across its 2023-2028 cycle. For manufacturers and startups, these programs provide near-term access to clinical partners, regulatory navigation, and pediatric-aligned feasibility pathways.
Combination products and connected pediatric care models also create opportunity as regulatory expectations and payer behavior evolve. FDA and EMA guidance for combination products encourages earlier integration of human factors, quality documentation, and real-world evidence planning, which fits pediatric remote monitoring and AI-assisted diagnostics already moving into routine pathways in radiology and behavioral health. Enforcement activity, including FDA actions affecting pediatric device marketing claims, further raises the value of compliant data generation and post-market surveillance capabilities, which tends to favor vendors that can support lifecycle monitoring and outcomes-based contracting for higher-cost pediatric therapies.
Recent Industry Developments in Pediatric Healthcare Market
- July 2026: Johnson & Johnson received FDA approval for the Dual Energy THERMOCOOL SMARTTOUCH SF Platform, an integrated catheter ablation solution delivering radiofrequency and pulsed field energy. The clearance broadens access to next-generation electrophysiology tools used for complex arrhythmia care and supports hospital investment in advanced pediatric-capable cath lab workflows.
- June 2026: Merck announced that the FDA approved an additional indication for CAPVAXIVE (pneumococcal 21-valent conjugate vaccine) in children and adolescents aged 2 through 17 years at increased risk for pneumococcal disease. The label expansion extends higher-valency pneumococcal coverage into at-risk pediatric cohorts and strengthens competitive positioning in conjugate vaccine contracting and formulary discussions.
- June 2024: CDCs ACIP unanimously voted to add VAXELIS, Sanofi and Merck's pediatric hexavalent combination vaccine, to preferential recommendations to help prevent invasive Hib disease in American Indian and Alaska Native infants. Preferential recommendation status supports more standardized uptake in impacted populations and reinforces the role of combination vaccines in reducing injection burden and simplifying clinic logistics.
Pediatric Healthcare Market Report Scope and Research Methodology
Market Definition and Coverage
This market captures the revenues linked to healthcare products and care delivery used for diagnosing, preventing, monitoring, and treating medical conditions in patients from birth through adolescence, across routine care and disease-specific treatment pathways.
Scope exclusions: It excludes adult care, as well as pediatric spend that is purely non-medical in nature (for example, general child wellness products without clinical use).
Segments Covered in This Report
- By Product Type
- Pharmaceuticals
- Vaccines
- Medical Devices
- Digital Health Solutions
- By Therapeutic Area
- Infectious Diseases
- Respiratory Disorders
- Neurological Disorders
- Cardiovascular Disorders
- Oncology
- Gastro-intestinal Disorders
- By Age Group
- Neonates (0–28 days)
- Infants (1–23 months)
- Children (2–11 years)
- Adolescents (12–18 years)
- By Care Setting
- Hospitals
- Clinics
- Homecare
- Telehealth
- By End User
- Public Healthcare Providers
- Private Healthcare Providers
- By Geography
- North America
- United States
- Canada
- Mexico
- Europe
- Germany
- United Kingdom
- France
- Italy
- Spain
- Rest of Europe
- Asia-Pacific
- China
- India
- Japan
- Australia
- South Korea
- Rest of Asia-Pacific
- Middle East and Africa
- GCC
- South Africa
- Rest of Middle East and Africa
- South America
- Brazil
- Argentina
- Rest of South America
- North America
Data Sources, Market Sizing, and Validation
Desk Research
Desk research starts with building a fact base on child population, disease burden, treatment access, and public health spending signals that shape pediatric care demand. We use public sources such as the World Health Organization (WHO), UNICEF, the World Bank, and the US Centers for Disease Control and Prevention (CDC) to anchor prevalence, immunization coverage, and child health outcomes.
To translate demand into dollars, we also refer to sources such as the US FDA for pediatric labeling and safety updates, national health ministries for program coverage, and peer-reviewed journals that report utilization patterns and standard-of-care shifts. Company annual reports, investor presentations, and reputable news coverage are used to understand portfolio focus and product rollout timing. Where available, selected paid databases are used for company financial intelligence and patent lookups to validate innovation and commercialization momentum. The sources listed here are illustrative, and many other public references are also reviewed for data collection, cross-checking, and clarification.
Primary Interviews and Surveys
Primary work is used to pressure-test the desk assumptions, especially on what is counted as pediatric-focused revenue and how pricing and uptake move by care setting. We speak with a mix of providers, distributors, payor-side experts, and industry specialists across major regions so the final model reflects utilization, access, and reimbursement differences by geography and service model.
Distribution of primary research fieldwork respondents
| Company type | Respondent position | Region |
|---|---|---|
| Top tier: 25% | CXOs: 13% | APAC: 46% |
| Mid tier: 55% | Functional/Unit leaders: 39% | EMEA: 31% |
| Smaller Players: 20% | Managers: 48% | Americas: 23% |
Market-Sizing & Forecasting
Sizing is built using a top-down demand pool approach where child population by age band is paired with condition prevalence, care-seeking rates, and treatment coverage to reconstruct the addressable spend. Once the care pathways were mapped, the value is formed by applying typical utilization levels (such as visits, therapy cycles, and course lengths) and then converting them into revenue using blended pricing benchmarks by setting.
Key inputs used in the model include pediatric population (neonates through adolescents), immunization coverage rates, incidence of common infectious and respiratory conditions, chronic disease management needs, hospital and clinic utilization patterns, and the mix shift toward home care and telehealth. After these drivers are set, selective bottom-up checks are used, such as sampled ASP x volume builds for major therapy baskets and supplier and channel discussions, which helps adjust totals where reporting is inconsistent.
For forecasting, scenario analysis is used so changes in vaccination budgets, access expansion, and digital care adoption can be reflected without overfitting past years. Where data gaps exist for smaller geographies or newer care models, we keep assumptions conservative and then revisit them through follow-up calls before finalizing the run.
Data Validation & Update Cycle
Validation is done in multiple passes so the final number is stable and explainable. We compare outputs against independent signals such as child health spending direction, program coverage changes, and published utilization markers, and then investigate variances that are outside expected ranges.
Before sign-off, the model is reviewed by another analyst to confirm that assumptions match the stated scope and that year-on-year movements are sensible. Reports are refreshed annually, and interim updates are made when there are material events like major policy shifts or step-changes in vaccine or drug uptake. Right before delivery, a final check is completed so the latest public indicators and interview feedback are incorporated.
Mordor Intelligence's Pediatric Healthcare Market Size Measured Against Other Published Estimates
Published market numbers can look far apart even when they appear to be describing the same pediatric healthcare space, because the included products, care settings, and year definitions are not always aligned. Differences also show up when one publisher uses a longer forecast horizon, a different currency conversion timing, or a more aggressive adoption curve for newer care models.
Some estimates lean heavily toward pediatric drug class revenues or they extend the scope deeper into broad healthcare services that are not consistently tracked as pediatric-specific. In Mordor Intelligence, totals are counted only when revenues can be tied back to pediatric care delivery or pediatric-focused products across defined age groups and settings, and adjacent adult care spillover is kept out even if it is handled by the same providers.
Benchmark comparison
| Source | Market Size | Gaps in Research Methodology |
|---|---|---|
| Mordor Intelligence | USD 15.93 B (2025) | |
| Industry Publisher A | USD 14.55 B (2024) | Uses a different base year and a broader disease and treatment framing that can shift the counted revenue pool between preventive care, surgery, and medication, which changes the starting point before forecasting begins. |
| Industry Publisher B | USD 16.72 B (2025) | Leans toward drug-class and pharmacy channel reporting, which can miss non-pharmaceutical pediatric care revenues or count pediatric health mainly through medicines and vaccines, leading to a different scope mix. |
The spread in the table is mostly explained by what each source treats as in-scope pediatric revenue and how the base year is set. By keeping the inputs tied to age-based demand, care setting utilization, and clearly defined revenue inclusion rules, the estimate stays traceable and can be replicated when assumptions are updated.
Key Questions Answered in the Report
What is the forecast value of the Pediatric healthcare market in 2031?
It is projected to reach USD 19.90 billion by 2031.
Which product category is expanding the fastest?
Digital health solutions are advancing at a 5.25% CAGR through 2031.
Which region will show the quickest growth?
Asia-Pacific is expected to grow at a 6.12% CAGR on the back of policy drives to boost pediatrician ratios and hospital capacity.
How large is the vaccines segment today?
Vaccines captured 38.55% of 2025 global revenue.
Why is telehealth important for pediatric care?
Permanent reimbursement parity and asynchronous platforms enable cost-efficient specialist access, supporting a 6.32% CAGR for telehealth revenue.