
Peanut Oil Market Size and Share
Market Overview
| Study Period | 2021 - 2031 |
|---|---|
| Market Size (2026) | USD 11.57 Billion |
| Market Size (2031) | USD 13.05 Billion |
| Growth Rate (2026 - 2031) | 2.43 % |
| Fastest Growing Market | Europe |
| Largest Market | Asia Pacific |
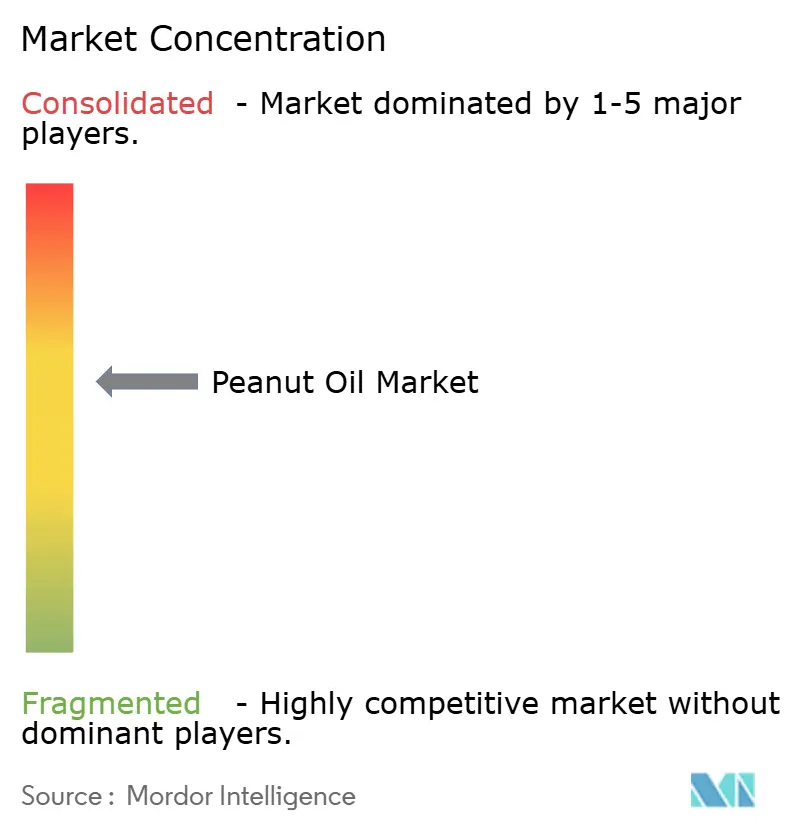
| Market Concentration | Medium |
Major Players *Disclaimer: Major Players sorted in no particular order Image © Mordor Intelligence. Reuse requires attribution under CC BY 4.0. | |
Peanut Oil Market Analysis by Mordor Intelligence
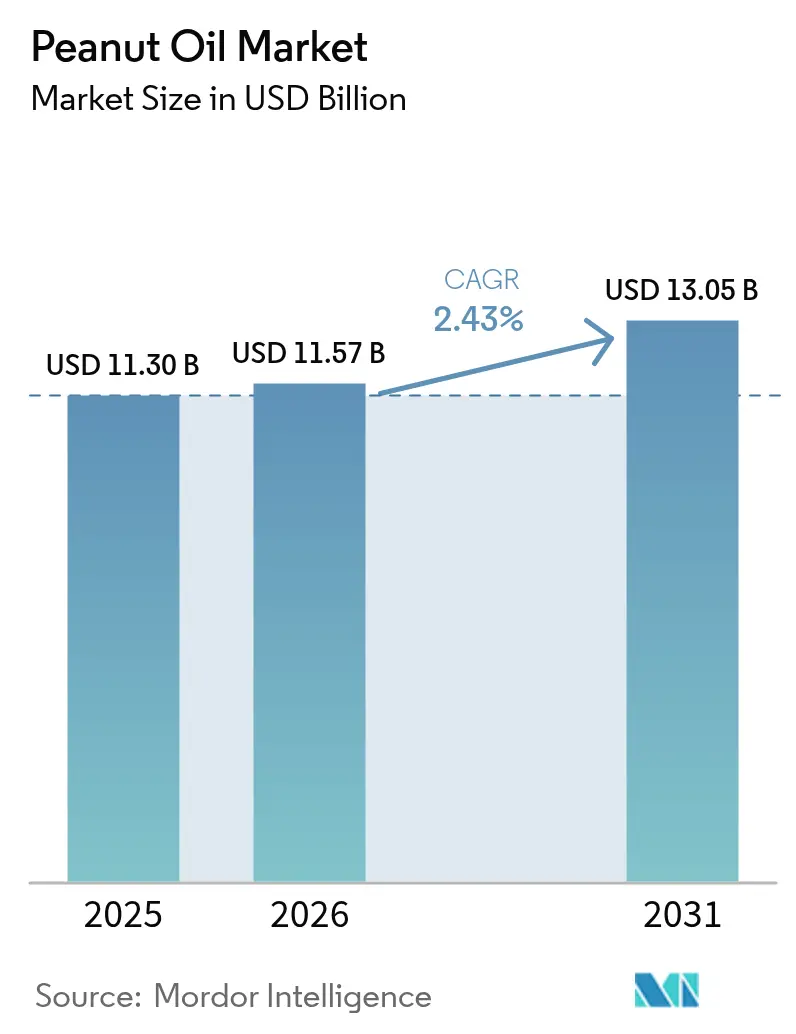
The global peanut oil market size was valued at USD 11.30 billion in 2025 and estimated to grow from USD 11.57 billion in 2026 to reach USD 13.05 billion by 2031, at a CAGR of 2.43% during the forecast period (2026-2031). The market demonstrates steady growth due to changing consumer preferences and product diversification. Refined peanut oil maintains market dominance in cooking and food processing applications due to its neutral flavor profile and high smoke point. The market shows an increasing preference for unrefined oils, particularly cold-pressed and organic varieties, driven by consumer demand for minimally processed products. These varieties are gaining prominence in specialty and health-food retail outlets. While conventional peanut oil remains the primary market segment, organic variants have established a notable presence in premium retail channels and online platforms, attracting health-conscious consumers seeking clean-label products. The foodservice segment maintains a significant market share due to consistent bulk purchasing requirements. Geographically, Asia-Pacific dominates the market, with substantial consumption in China and India, where peanut oil is a cooking essential. The market structure reflects a balance between traditional segments and growth in premium, sustainable, and convenience-oriented categories.
Key Report Takeaways
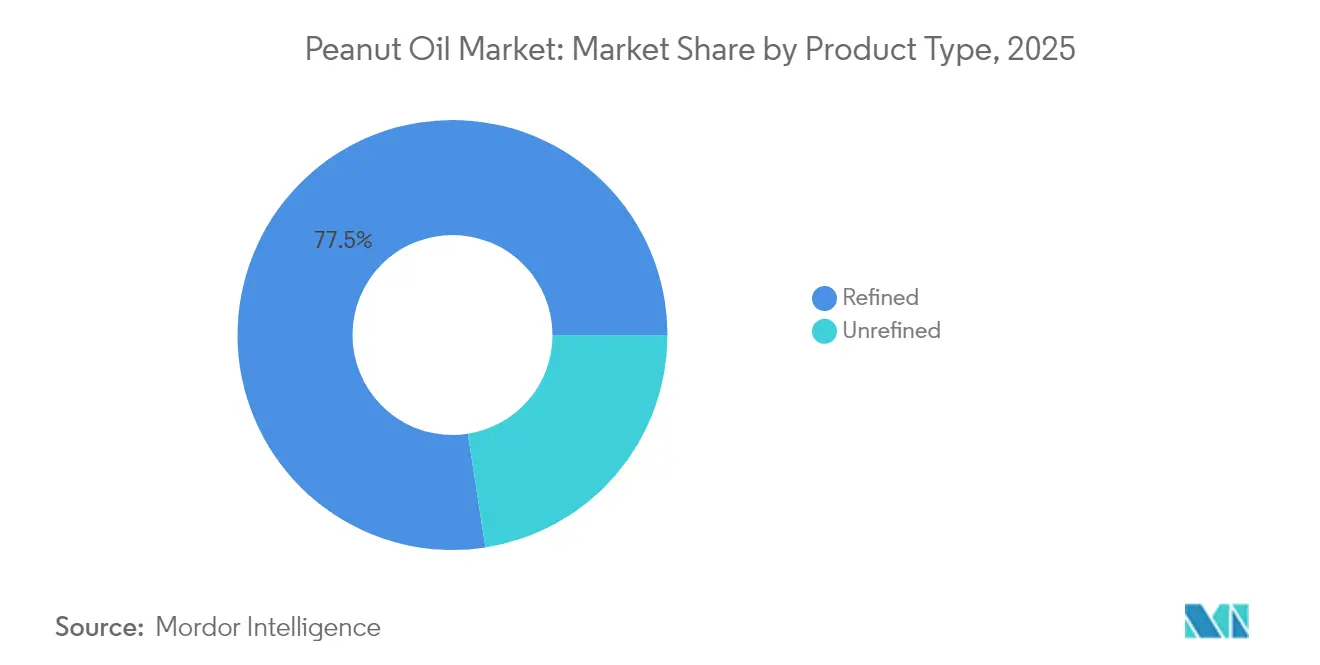
- By type, refined oils led with 77.45% of peanut oil market share in 2025, while unrefined variants are projected to grow at a 6.23% CAGR to 2031.
- By category, conventional products accounted for 96.55% of peanut oil market share in 2025; the organic segment is expanding at a 6.92% CAGR through 2031.
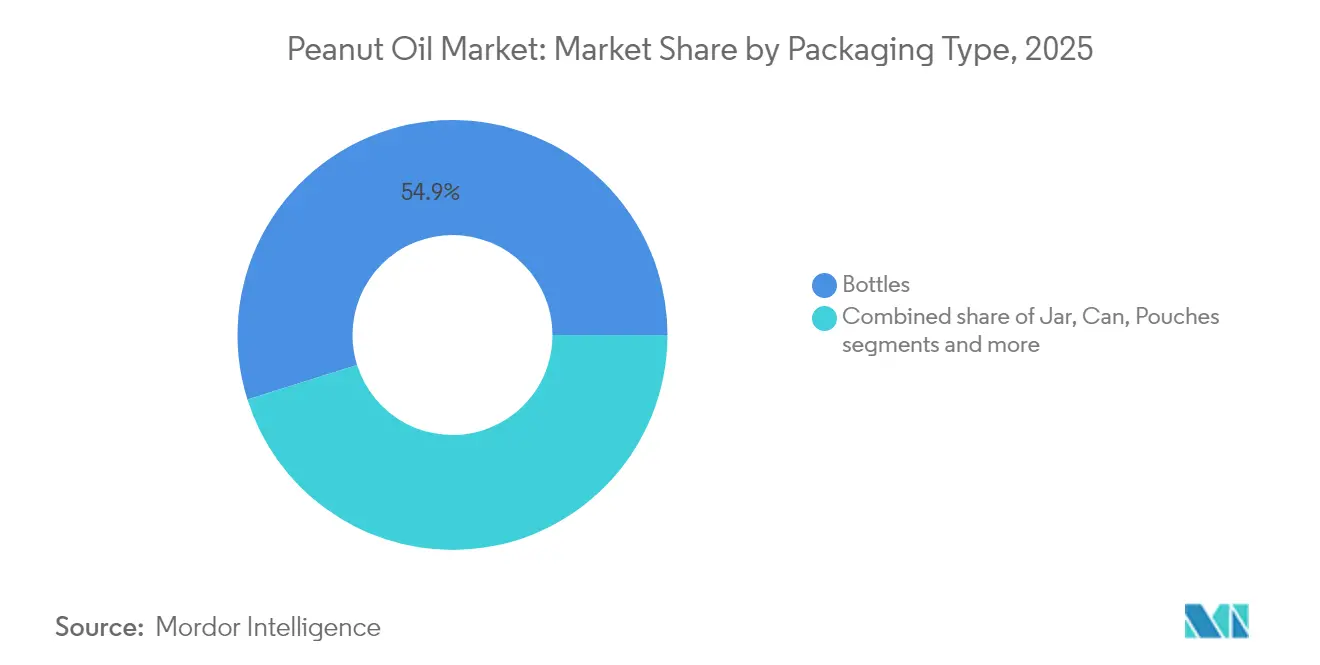
- By packaging, bottles held 54.85% revenue share in 2025, whereas pouches are advancing at a 6.78% CAGR on the back of convenience and logistics efficiency.
- By distribution channel, the foodservice segment controlled 51.05% of the peanut oil market size in 2025 and is forecast to register a 2.74% CAGR to 2031.
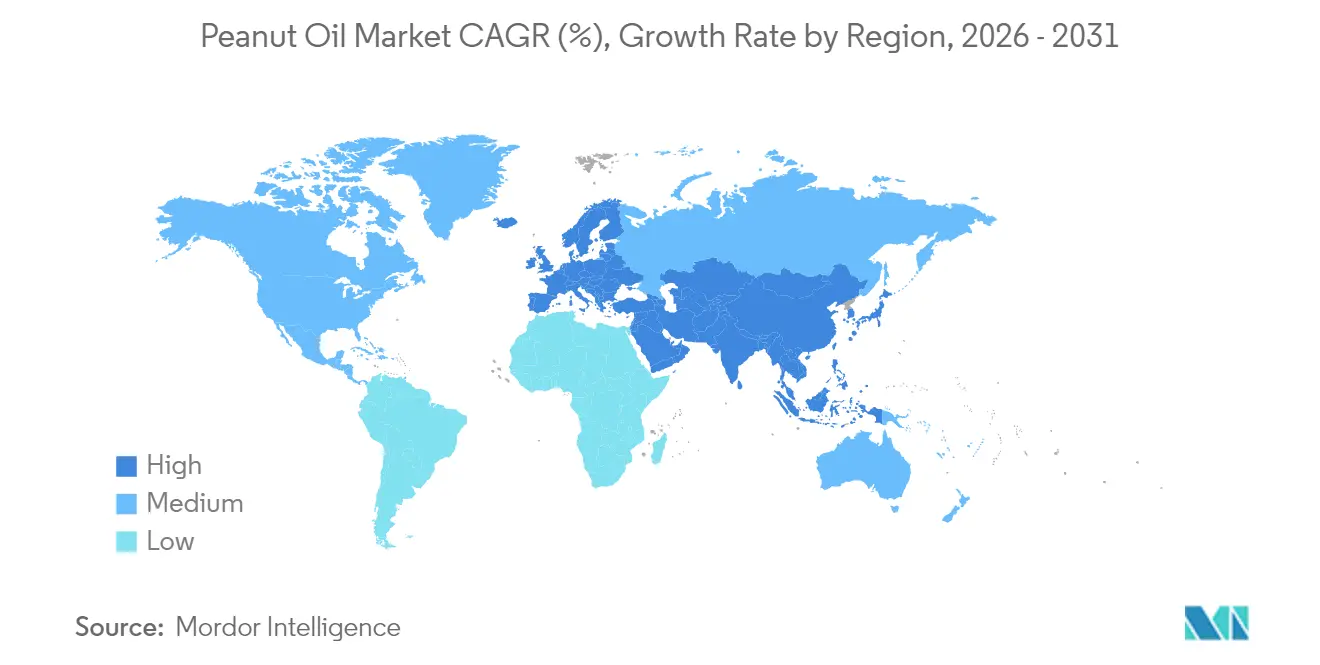
- By geography, Asia-Pacific commanded 62.15% of the peanut oil market share in 2025, while Europe is expected to post the fastest 7.31% CAGR through 2031.
Note: Market size and forecast figures in this report are generated using Mordor Intelligence’s proprietary estimation framework, updated with the latest available data and insights as of 2026.
Market Trends and Insights
Drivers Impact Analysis of Peanut Oil Market*
| Driver | (~) % Impact on CAGR Forecast | Geographic Relevance | Impact Timeline |
|---|---|---|---|
| Rising health awareness boosts demand for peanut oil due to its heart-healthy properties | +0.8% | Global, with strongest impact in North America and Europe | Medium term (2-4 years) |
| High smoke point and neutral flavor increase its popularity in cooking and frying | +0.6% | Global, particularly Asia-Pacific foodservice sector | Short term (≤ 2 years) |
| Increasing demand for organic and non-GMO oils fuels peanut oil consumption | +0.4% | North America and Europe premium segments | Long term (≥ 4 years) |
| Expanding foodservice industry growth drives bulk peanut oil sage | +0.5% | Asia-Pacific core, spill-over to Middle East and Africa | Medium term (2-4 years) |
| Technological advancements in oil extraction improve quality and yield | +0.2% | Global production centers | Long term (≥ 4 years) |
| Food processing industry expansion and packaged food applications boost demand | +0.3% | Global, concentrated in emerging markets | Medium term (2-4 years) |
| Source: Mordor Intelligence | |||
Rising Health Awareness Boosts Demand for Peanut Oil Due To Its Heart-Healthy Properties
The global peanut oil market is witnessing substantial growth driven by increasing health consciousness among consumers worldwide. The market's expansion is primarily attributed to the growing consumer preference for cooking oils with proven cardiovascular benefits. Peanut oil's composition, characterized by its cholesterol-free nature and high monounsaturated fat content, positions it as a superior alternative to traditional saturated fats, such as butter and lard. This shift in consumer behavior is further reinforced by the rising prevalence of lifestyle diseases, including obesity, hypertension, and coronary heart disease, compelling individuals to make informed choices about their cooking oil consumption. This trend is validated by data from the Centers for Disease Control and Prevention (CDC), which reported that approximately 4.8% of adults in the United States had coronary heart disease in 2023, emphasizing the critical need for heart-healthy alternatives. In response to this growing health consciousness, market participants are strategically expanding their product portfolios. For instance, Marico Limited's entry into the cold-pressed oils segment in June 2025 with the Saffola Cold Pressed Oils range, including peanut oil, demonstrates the industry's adaptation to meet the increasing demand for healthier cooking oil options.
High Smoke Point and Neutral Flavor Increase Its Popularity in Cooking and Frying
Peanut oil's high smoke point of 450°F (232°C) and neutral flavor profile make it a preferred choice in both residential and commercial kitchens. The oil maintains stability during high-temperature cooking methods like deep frying, stir-frying, and sautéing without degrading or generating harmful compounds, which helps preserve food safety and nutritional value. This characteristic is particularly important in restaurants and quick-service establishments where large quantities of oil are used for frying and consistent food quality is essential. The oil's neutral taste, which ranges from subtle and nutty to flavorless depending on refinement levels, allows ingredients' natural flavors to remain prominent. Additionally, peanut oil does not retain flavors from previously cooked foods, enabling multiple items to be fried in succession without flavor transfer. Products like Tata Simply Better and SGR 777 Foods cold-pressed groundnut oils are marketed for specific applications such as frying samosas, pakoras, and tempering gravies, emphasizing the oil's ability to maintain nutrient content and flavor integrity at high temperatures while providing a mild aroma.
Increasing Demand for Organic and Non-GMO Oils Fuels Peanut Oil Consumption
The global peanut oil market is experiencing growth due to increasing demand for organic and non-GMO oils. Health-conscious and environmentally aware consumers are showing a strong preference for clean-label products without genetically modified organisms (GMOs), synthetic additives, and harmful chemicals. Peanut oil, particularly from organically grown, non-GMO peanuts, meets these requirements as it contains no cholesterol and is high in unsaturated fats. The organic peanut oil production process also incorporates sustainable farming practices, attracting environmentally conscious consumers. According to the Research Institute of Organic Agriculture's 2023 data, Germany leads the European Union (EU-27) with 1,971 organic importers, followed by France with 722 and the Netherlands with 529 importers [1]. This distribution of organic importers indicates substantial consumer demand for organic products in key European markets, facilitating the trade and availability of organic oils, including peanut oil. The significant presence of importers in Germany and France demonstrates established infrastructure and market demand for clean-label ingredients, enabling organic peanut oil distribution across food processing, retail, and consumer channels. These countries' commitment to sustainability goals and organic consumption within the European Union enhances the appeal of organic peanut oil among health and environment-conscious consumers.
Expanding Foodservice Industry Growth Drives Bulk Peanut Oil Usage
The global peanut oil market demonstrates robust growth, primarily attributed to the substantial expansion of the foodservice industry encompassing restaurants, catering services, fast food chains, and institutional kitchens. This expansion correlates directly with increasing urbanization rates, higher disposable incomes, and evolving consumer preferences for diverse dining experiences. The systematic growth of commercial foodservice operations, particularly in emerging markets, has generated substantial demand for bulk peanut oil consumption. According to the United States Department of Agriculture (USDA), Mexico's peanut consumption has reached 314,000 metric tons in 2024/2025, representing a 7% year-on-year increase, primarily driven by foodservice industry demand [2]. The increasing popularity of Asian and African cuisines in Western markets has resulted in heightened demand for peanut oil. Moreover, the proliferation of deep-fried street food establishments and quick-service restaurants across India, China, and Southeast Asia has necessitated increased procurement of bulk peanut oil. As a result, the continued growth of the foodservice industry globally indicates a sustained upward trajectory for peanut oil consumption, positioning it as a critical component in commercial food preparation operations.
Restraints Impact Analysis of Peanut Oil Market*
| Restraint | (~) % Impact on CAGR Forecast | Geographic Relevance | Impact Timeline |
|---|---|---|---|
| Competition from alternative oils such as sunflower and rice bran oils hinders growth | -0.4% | Global, particularly price-sensitive markets | Short term (≤ 2 years) |
| Concerns about peanut allergies among consumers reduce the potential customer base | -0.3% | North America and Europe primarily | Medium term (2-4 years) |
| Seasonal and climatic pisks affect peanut production consistency | -0.2% | Global production regions, concentrated in US Southeast and India | Short term (≤ 2 years) |
| Elevated production expenses affect peanut oil's market position against other vegetable oils | -0.2% | Global, particularly emerging markets | Medium term (2-4 years) |
| Source: Mordor Intelligence | |||
Competition From Alternative Oils such as Sunflower and Rice Bran Oils Hinders Growth
The global peanut oil market encounters substantial competition from alternative edible oils, predominantly sunflower, rice bran, soybean, and canola oils. These alternatives deliver equivalent or superior nutritional benefits at competitive price points, attracting both retail consumers and commercial food service establishments. Sunflower oil contains substantial concentrations of polyunsaturated fats and vitamin E, while rice bran oil demonstrates established cholesterol-lowering properties and an optimal fatty acid composition. The increasing preference for these alternative oils, driven by their documented health benefits, comprehensive marketing initiatives, and government support programs across numerous countries, continues to constrain peanut oil market expansion. As a result, peanut oil manufacturers must implement strategic product differentiation through superior quality specifications, scientifically validated health advantages, and specialized culinary applications rather than engaging in price-based competition. This strategic approach remains essential for maintaining market position and achieving sustainable growth in an increasingly competitive global edible oils landscape.
Concerns about peanut allergies among consumers reduce the potential customer base
A major constraint in the global peanut oil market is the prevalence of peanut allergies, which limits the potential consumer base, particularly in developed markets such as the United States, Canada, and the United Kingdom. Peanut allergies rank among the most common and severe food allergies, potentially causing life-threatening anaphylactic reactions from minimal exposure. These health risks lead consumers, foodservice operators, and food manufacturers to avoid products containing or processed near peanuts, including peanut oil. Although refined peanut oil contains minimal protein content and is generally considered safe for individuals with peanut allergies, regulatory bodies maintain strict labeling requirements. The United States Food and Drug Administration (FDA) requires clear labeling of peanut-containing products under the Food Allergen Labeling and Consumer Protection Act (FALCPA), including unrefined peanut oil [3]. The European Food Safety Authority (EFSA) includes peanuts in its top 14 allergens list, requiring mandatory labeling across the European Union for peanut-derived oils. These regulatory requirements and health concerns create barriers to peanut oil adoption in consumer and commercial markets worldwide.
*Our forecasts treat driver/restraint impacts as directional, not additive. The impact forecasts reflect baseline growth, mix effects, and variable interactions.
Peanut Oil Market Segment Analysis
By Type:
Refined Dominance Driven by Safety StandardsRefined peanut oil holds 77.45% market share in 2025, driven by regulatory clarity and safety benefits in commercial applications. The Food and Drug Administration (FDA)'s exemption of highly refined peanut oils from allergen labeling requirements has enhanced adoption in foodservice and food manufacturing sectors where allergen control is essential. The refining process eliminates allergenic proteins, making the oil safe for most individuals with peanut allergies while preserving its high-temperature cooking capabilities. This process also removes aflatoxins, addressing food safety requirements in markets with strict quality standards.
Unrefined peanut oil, while holding a smaller market share, shows the highest growth rate at 6.23% CAGR through 2031. This growth stems from its premium market position and appeal to health-conscious consumers. Cold-pressed and expeller-pressed varieties maintain higher levels of natural compounds, including resveratrol and plant polyphenols, attracting consumers seeking less processed options. However, these oils have limited use in allergen-sensitive environments and typically have reduced shelf life due to higher concentrations of compounds that increase oxidation. The premium pricing and positioning in gourmet and health food markets are creating lucrative market opportunities.

By Category:
Conventional Leadership with Organic AccelerationConventional peanut oil holds 96.55% market share in 2025, driven by established supply chains, cost advantages, and widespread consumer acceptance across applications. The conventional segment leverages production and distribution economies of scale, enabling competitive pricing for mass market penetration in retail and foodservice sectors. According to the United States Department of Agriculture (USDA), India's status as the second-largest global peanut producer, with production growth of 18%, reached 7.2 million metric tons in 2024/25, ensuring a stable conventional oil supply. Traditional production methods, including mechanical pressing and solvent extraction, deliver high extraction efficiency while maintaining cost competitiveness against other oils.
The organic segment, despite its smaller market share, shows significant growth at 6.92% CAGR through 2031, supported by premium positioning and consumer preference for certified sustainable products. The United States Department of Agriculture (USDA)'s Organic Transition Initiative aims to reduce organic certification barriers, potentially increasing organic peanut cultivation and oil production. Major European markets, including Germany, France, the Netherlands, and Italy, present growth opportunities for organic peanut oil, with producers focusing on sustainability certifications and traceability to support premium pricing. While the organic segment's growth aligns with consumer demand for clean-label products and environmental responsibility, expansion remains constrained by supply chain complexities and certification costs.
By Packaging:
Bottles Lead with Pouches Gaining MomentumBottles hold a dominant 54.85% market share in 2025, supported by consumer familiarity, product visibility, and established retail infrastructure that enables brand differentiation and premium positioning. Glass and plastic bottle formats facilitate effective branding and product communication, which is essential for premium and organic variants where packaging quality indicates product value. The bottle format's alignment with existing retail shelving and consumer storage preferences maintains its market leadership, while recycling considerations affect material choices. Retail channels, including supermarkets and hypermarkets, prefer bottled formats for their handling efficiency and lower breakage risks during transport and stocking.
Pouches are experiencing the highest growth at 6.78% CAGR through 2031, due to cost efficiency, convenience, and sustainability benefits that attract both manufacturers and environmentally aware consumers. Flexible packaging innovations support portion control, reduced material use, and improved supply chain efficiency through better space utilization during transport and storage. The pouch format's reduced weight lowers shipping costs and carbon emissions, supporting corporate sustainability goals and consumer environmental preferences. Advances in food packaging technology, including active and smart packaging features, enhance product preservation and consumer engagement through pouches. Cans and jars retain stable market positions in specific applications like bulk foodservice packaging and premium gift segments, while other formats serve niche requirements, including industrial and institutional users requiring specialized dispensing solutions.
By Distribution Channel:
Foodservice Dominance Reflects Commercial DemandThe HoReCa/Foodservice distribution channel maintains market leadership with a 51.05% share in 2025, demonstrating a projected CAGR of 2.74% through 2031. This segment's predominance is attributed to peanut oil's superior performance in commercial food preparation applications and the economic advantages of volume procurement. The oil's elevated smoke point, neutral organoleptic properties, and extended storage stability render it optimal for commercial deep-frying, stir-frying, and sautéing applications across restaurants, quick-service establishments, and institutional food preparation facilities. These characteristics minimize oil deterioration and replacement intervals, thereby optimizing operational expenditure. The oil's broad applicability across international culinary traditions further solidifies its position in global foodservice operations. The oil's versatility across various cuisines strengthens its position in diverse foodservice operations.
Retail distribution operates through multiple channels, with supermarkets and hypermarkets dominating due to their extensive product range and promotional capabilities. Walmart, with 10,784 stores globally as of 2024, exemplifies this dominance in mass retail distribution of food products, including peanut oil. The company's private label, Great Value brand, offers peanut oils at competitive prices, addressing both price sensitivity and quality requirements. Convenience stores and grocery stores provide accessibility and quick purchase options, particularly for smaller packages and premium products. The online retail segment continues to expand, driven by enhanced logistics and increased consumer adoption of food e-commerce, though shipping costs for oil products remain a challenge. Each retail format requires specific approaches to pricing and packaging, based on consumer buying behaviors.
Geography Analysis
APAC Peanut Oil Market
Asia-Pacific holds 62.15% market share in 2025, driven by the integration of peanut oil in regional cuisines, production capacity, and increasing middle-class consumption. According to the United States Department of Agriculture (USDA), India expects a 10% increase in peanut oil consumption for 2025/26, supported by strong domestic demand and limited palm oil supply. China's established edible oils industry and position as a major peanut producer ensure supply stability and consumption growth. The region's expanding foodservice sector, as seen in Thailand's food and beverage services growth, increases bulk oil demand while urbanization supports packaged oil sales.
Europe Peanut Oil Market
Europe shows 7.31% CAGR through 2031, supported by premium product positioning, health awareness, and regulations favoring quality-certified products. The European Union maintains stable peanut oil consumption despite competition from alternative oils. Germany, France, the Netherlands, and Italy lead in high-quality organic peanut oil consumption, with manufacturers focusing on sustainability certifications and traceability. While the region experienced declining consumption over the past decade due to allergen labeling requirements, opportunities exist in refined oil segments. European consumers' preference for organic and sustainable products, combined with strict quality standards, enables value-added positioning strategies.
North America Peanut Oil Market
North America maintains a significant presence in the global peanut oil market through established consumption patterns, domestic production, and regulatory frameworks in the foodservice and retail sectors. The United States' traditional use of peanut-based products drives consistent demand from households, restaurants, and institutional kitchens. The region's strong peanut cultivation base, combined with advanced processing capabilities and efficient distribution networks, ensures supply chain reliability and positions North America as a key contributor to the global peanut oil market's growth.
Regulatory Landscape
In the United States, peanut oil ingredients are covered under FDA food ingredient and indirect additive inventories, including packaging-related rules (21 CFR parts 170-186 and parts 175-178). FALCPA allergen labeling requirements also shape differentiated labeling practices for refined versus unrefined peanut oils.
In the European Union, Regulation (EU) 2023/915 sets maximum aflatoxin levels in groundnuts and vegetable oils, reinforcing testing and supplier qualification for importers and processors. In China, the GB 2716-2018 standard governs baseline edible oil safety, and the GB/T 1534-2026 standard, issued in January 2026 with an August 1, 2026 effective date, updates peanut oil quality definitions, including a high-oleic oil threshold (oleic acid content of at least 73%). This tightens compliance requirements for producers, packers, and traders serving the Chinese market.
Competitive Landscape
The peanut oil market shows moderate fragmentation, characterized by multinational companies with integrated supply chains and regional processors with strong local market presence. The market structure reflects high capital requirements for oil processing facilities. Wilmar International operates more than 1,000 manufacturing plants across 50 countries and maintains a leading position in consumer-packaged edible oils. Archer Daniels Midland Company (ADM), with revenue of USD 85,530 million in 2024, leverages its extensive agricultural supply chain management capabilities and significant presence in peanut sourcing and processing. Bunge's refined and specialty oils segment serves food processors and renewable diesel producers, highlighting the market's diverse applications.
Major players in the market implement sustainability initiatives, adopt advanced technologies, and pursue geographic expansion strategies to address commodity price volatility and meet regulatory requirements. Cargill achieved the highest ranking in the Edible Oil Supplier Index 2025 for trans fatty acid reduction, demonstrating the importance of regulatory compliance and health considerations. This competitive positioning reflects the market's emphasis on quality control and adherence to international food safety regulations.
Industry players are developing regenerative agriculture partnerships and carbon reduction programs to address consumer demand for sustainable products, while implementing advanced extraction methods for quality and efficiency improvements.In 2025, the Georgia Peanut Commission allocated USD 764,189 for research in peanut breeding and non-food applications, including oil conversion technologies. Market opportunities exist in organic certification, high oleic varieties, and specialized uses in cosmetics and industrial applications. New market entrants target direct-to-consumer channels and premium segments, operating outside traditional commodity market structures.
Peanut Oil Industry Leaders
-
Wilmar International Limited
-
Archer Daniels Midland Company
-
Cargill, Incorporated
-
AAK AB
-
Bunge Limited
- *Disclaimer: Major Players sorted in no particular order
Peanut Oil Market Companies Covered in this Report
- Wilmar International Limited
- Archer Daniels Midland Company
- Cargill, Incorporated
- AAK AB
- Bunge Limited
- Shandong Luhua Group Co.,Ltd
- COFCO Corporation
- Hain Celestial Group,Inc.
- CHS Inc.
- Liberty Oil Mills Limited
- Sahaj Oil & Food Private Limited
- Agrocrops
- Shree Uday Oil & Foods Industries
- Qingdao Changsheng Group
- 3F Industries Ltd.
- ATC Group India
- Hormel Foods Corporation
- Marico Limited
- Mother Dairy Fruit & Vegetable Pvt Ltd
- Tata Consumer Products Limited
Market Opportunities and Future Outlook
Premiumization and specification-led differentiation are visible opportunity areas, especially where labeling rules encourage clearer product segmentation. The GB/T 1534-2026 standard establishes a defined high-oleic peanut oil category (oleic acid at least 73%) effective August 1, 2026, which allows processors and brands to certify composition, stability, and quality attributes for premium retail and industrial formulations.
Upgrades are also apparent on the supply and processing side, with investments focused on scale, efficiency, and sustainability. In January 2026, Henan Huatai Group completed installation of a 500 TPD peanut oil extraction line with integrated solvent recovery, supporting larger and more eco-efficient processing. On trade flows, Brazil's crude peanut oil exports rose to 154,000 tons in 2025, with China taking the dominant share, which highlights the need for compliant, traceable supply chains to serve Asia-Pacific demand.
Recent Industry Developments in Peanut Oil Market
- May 2026: Premium Peanut opened a new shelling facility in Santee, South Carolina. The expansion increases upstream raw-material handling capacity and improves domestic supply for foodservice and retail channels.
- June 2025: Marico expanded its edible oil portfolio in India by launching a cold-pressed range under the Saffola brand, including groundnut (peanut) oil. The launch extends premium format options for domestic consumers and retailers.
- December 2024: ADM and The J.M. Smucker Co. initiated a regenerative agriculture program focused on sustainable peanut farming in the United States. The program links peanut sourcing with farm practice improvements to support downstream sustainability requirements.
Peanut Oil Market Report Scope and Research Methodology
Market Definition and Coverage
This market covers the value of peanut oil sold for edible use, counted at the first commercial sale (refined or unrefined), across retail packs, foodservice supply, and bulk trade in key producing and consuming countries.
Scope exclusions: Excluded items include peanut meal and hull by-products, biodiesel blending volumes, and non-food pharmaceutical extracts derived from peanuts.
Segments Covered in This Report
- By Type
- Refined
- Unrefined
- By Category
- Conventional
- Organic
- By Packaging
- Bottle
- Jar
- Can
- Pouches
- Others
- By Distribution Channel
- HoReCa/Foodservice
- Retail
- Supermarkets/Hypermarkets
- Convenience Stores/Grocery Stores
- Online Retail Stores
- Other Distribution Channels
- By Geography
- North America
- United States
- Canada
- Mexico
- Rest of North America
- Europe
- Germany
- United Kingdom
- Italy
- France
- Spain
- Netherlands
- Poland
- Belgium
- Sweden
- Rest of Europe
- Asia-Pacific
- China
- India
- Japan
- Australia
- Indonesia
- South Korea
- Thailand
- Singapore
- Rest of Asia-Pacific
- South America
- Brazil
- Argentina
- Colombia
- Chile
- Peru
- Rest of South America
- Middle East and Africa
- South Africa
- Saudi Arabia
- United Arab Emirates
- Nigeria
- Egypt
- Morocco
- Turkey
- Rest of Middle East and Africa
- North America
Data Sources, Market Sizing, and Validation
Desk Research
Desk research starts with building a clean fact base on peanut production, oilseed crushing, and edible oil usage patterns, and then mapping these to trade and pricing signals. For the base inputs, we rely on public sources such as FAOSTAT for oilseed balances, USDA oilseeds and edible oil outlooks, UN Comtrade trade flows, and national agriculture ministries and statistical offices in major peanut producing countries.
To keep assumptions practical, we triangulate using sources such as customs tariff schedules for peanut oil categories, central bank or IMF FX series for currency conversion timing, and peer reviewed food science journals for refining yields and quality standards. Company filings and investor presentations are used to sanity-check capacity additions, channel mix shifts, and export intent, and these are supplemented by a paid subscription for company financials and news plus an import-export shipment-level database where available. The sources listed here are illustrative only, and we also used other public and paid references for data collection, cross-checking, and clarification.
Primary Interviews and Surveys
Primary work is used to confirm how much peanut oil is sold into retail versus foodservice, how refined versus unrefined mixes are changing, and what typical price ranges look like by region. We speak with stakeholders across crushers, refiners, exporters, distributors, and large buyers, and for this global market the inputs are balanced across APAC, EMEA, and the Americas so the model does not over-fit one region.
Distribution of primary research fieldwork respondents
| Company type | Respondent position | Region |
|---|---|---|
| Top tier: 29% | CXOs: 22% | APAC: 48% |
| Mid tier: 49% | Functional/Unit leaders: 25% | EMEA: 30% |
| Smaller Players: 22% | Managers: 53% | Americas: 22% |
Market-Sizing & Forecasting
Sizing is built using a top-down logic where peanut availability, crushing rates, and edible oil demand indicators are used to reconstruct the addressable oil pool by country, which is then converted into value using observed price bands. Once this is assembled, we corroborate totals with selective bottom-up checks such as sampled brand and private label pricing, distributor channel checks, and a limited roll-up of visible capacity and utilization in key origins.
Inputs that matter in this market include groundnut production volumes, extraction and refining yield ranges, share of oil directed to food use, import-export movements for peanut oil HS codes, and regional wholesale and retail price spreads that signal margin and channel mix. For forecasting, scenario analysis is used around crop swings and trade policy sensitivity, and then the central case is anchored using smoothing of historical consumption and price series, followed by expert confirmation of how quickly normal yields and demand patterns tend to revert. Where local data is thin, proxy ratios are taken from similar origin markets and then narrowed through interview feedback before being applied.
Data Validation & Update Cycle
Validation is done by comparing outputs against independent signals such as oilseed balance sheets, trade totals, and price trend direction, and then tracing any large variance back to one assumption at a time. If a number looks off, we re-check the supporting inputs, and we run targeted call-backs to confirm whether the issue is a data gap, a timing mismatch, or a real market shift.
Before sign-off, a second analyst reviews the model logic, the conversion steps, and the final tables so calculation errors and inconsistent definitions are caught early. The report is refreshed on an annual cycle, and interim updates are made when material events occur, such as a major crop disruption or a sustained change in trade restrictions. Right before delivery, we do a quick final scan of the latest public releases so clients receive an up-to-date view.
Mordor Intelligence's Peanut Oil Market Size Compared With Other Published Estimates
Published market sizes for peanut oil can look far apart even when the topic name is the same, because the counted products and end uses are not always consistent, and the base year pricing and FX timing can differ. Differences also come from how firms treat trade flows, and whether they validate refining yields and edible-use splits with real market participants.
Peanut meal and hull by-products sit outside Mordor Intelligence's scope, which removes a revenue pool that some published figures appear to fold into a broader groundnut processing value. Other gaps come from including personal care or pharmaceutical uses, applying aggressive price growth assumptions across all regions, or using a single global average price that misses the large APAC versus non-APAC spread seen in wholesale markets.
Benchmark comparison
| Source | Market Size | Gaps in Research Methodology |
|---|---|---|
| Mordor Intelligence | USD 11.57 B (2026) | |
| Industry Publisher A | USD 11.09 B (2025) | Uses an earlier base year and appears to include a wider application set beyond edible demand in some sections, and the pricing build-up is not clearly tied to trade-weighted regional price spreads. |
| Industry Publisher B | USD 12.62 B (2025) | Uses a higher 2025 starting point that likely reflects broader scope and a faster assumed price progression, and the method is less transparent on how refining yields and export channel values are netted out. |
Taken together, the spread is mainly explained by what is included around non-edible uses and by how pricing is applied across countries and channels. Our checks keep the estimate traceable to production, trade, and edible consumption signals, and then the total is stress-tested using interview-led ranges for yields, channel mix, and realistic price bands.
Key Questions Answered in the Report
What is the current size of the peanut oil market?
The peanut oil market size stands at USD 11.57 billion in 2026 and is projected to reach USD 13.05 billion by 2031.
Which region dominates global peanut oil consumption?
Asia-Pacific leads with 62.15% of peanut oil market share, anchored by India and China’s extensive culinary usage.
Why is refined peanut oil preferred in foodservice?
Refined oil is exempt from allergen labeling, exhibits a smoke point above 450°F, and withstands repeated frying cycles, making it cost-efficient for restaurants.
How fast is organic peanut oil growing?
The organic segment is expanding at a 6.92% CAGR, faster than any other category in the market.