
PD-1 And PD-L1 Inhibitors Market Size and Share
Market Overview
| Study Period | 2020 - 2031 |
|---|---|
| Market Size (2026) | USD 74.16 Billion |
| Market Size (2031) | USD 142.04 Billion |
| Growth Rate (2026 - 2031) | 13.88 % |
| Fastest Growing Market | Asia Pacific |
| Largest Market | North America |
| Market Concentration | Medium |
Major Players *Disclaimer: Major Players sorted in no particular order Image © Mordor Intelligence. Reuse requires attribution under CC BY 4.0. | |
PD-1 And PD-L1 Inhibitors Market Analysis by Mordor Intelligence
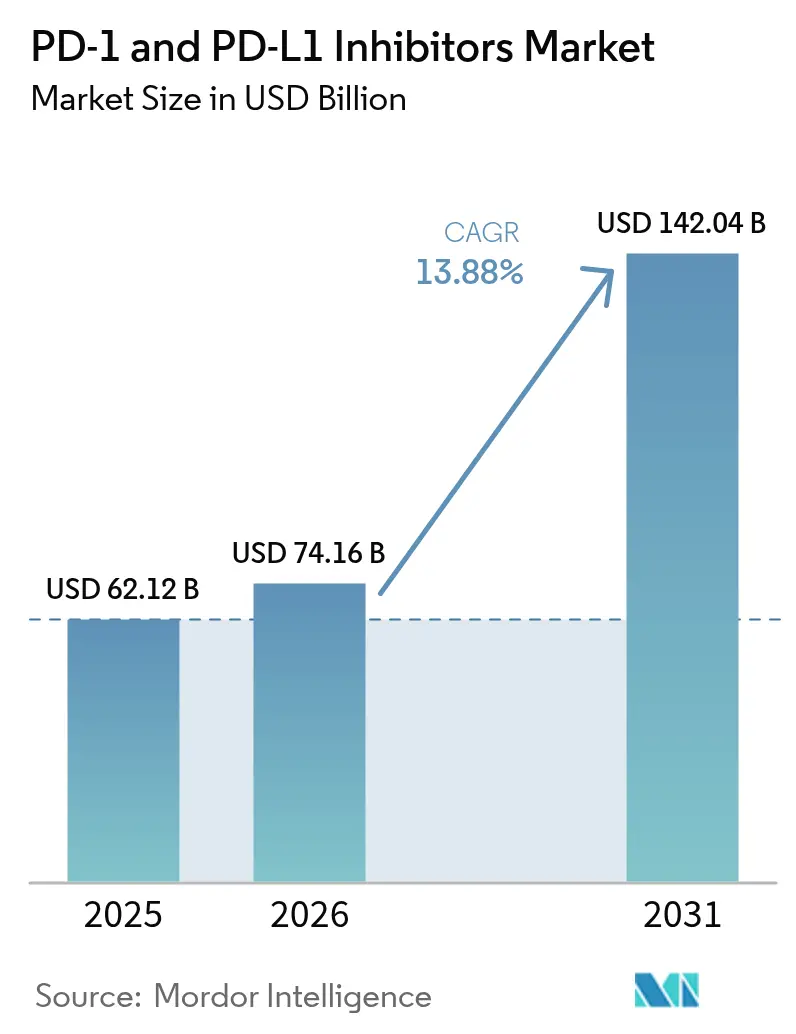
The PD-1 And PD-L1 Inhibitors Market size is projected to be USD 62.12 billion in 2025, USD 74.16 billion in 2026, and reach USD 142.04 billion by 2031, growing at a CAGR of 13.88% from 2026 to 2031.
Demand remains strong, driven by label expansions into adjuvant and neoadjuvant settings, increased adoption of biomarker-guided prescribing, and favorable reimbursement policies for infusion therapies. However, growth has slowed compared to the pre-2024 period as first-generation brands near loss of exclusivity and payers push for stronger cost-effectiveness evidence. Despite this moderation, the PD-1 and PD-L1 inhibitor market continues to demonstrate long-term potential, supported by advancements in combination immunotherapy regimens, subcutaneous reformulations, and expanded geographic access. Competitive pressures are intensifying, with Chinese manufacturers pricing 40-60% below multinational competitors, while at least eight biosimilar sponsors progress through Phase III programs targeting launches from 2027 onward.
Key Report Takeaways
- By inhibitor type, PD-1 agents led with 80.92% of PD-1 and PD-L1 inhibitors market share in 2025, while PD-L1 inhibitors posted the highest projected CAGR at 15.43% through 2031.
- By application, non-small cell lung cancer accounted for 42.05% of the PD-1 and PD-L1 inhibitor market in 2025; kidney cancer is projected to grow at a 15.87% CAGR over 2026-2031.
- By distribution channel, hospital pharmacies captured 68.32% of the 2025 volume, whereas online pharmacies are the fastest-growing outlet, with a 16.21% CAGR to 2031.
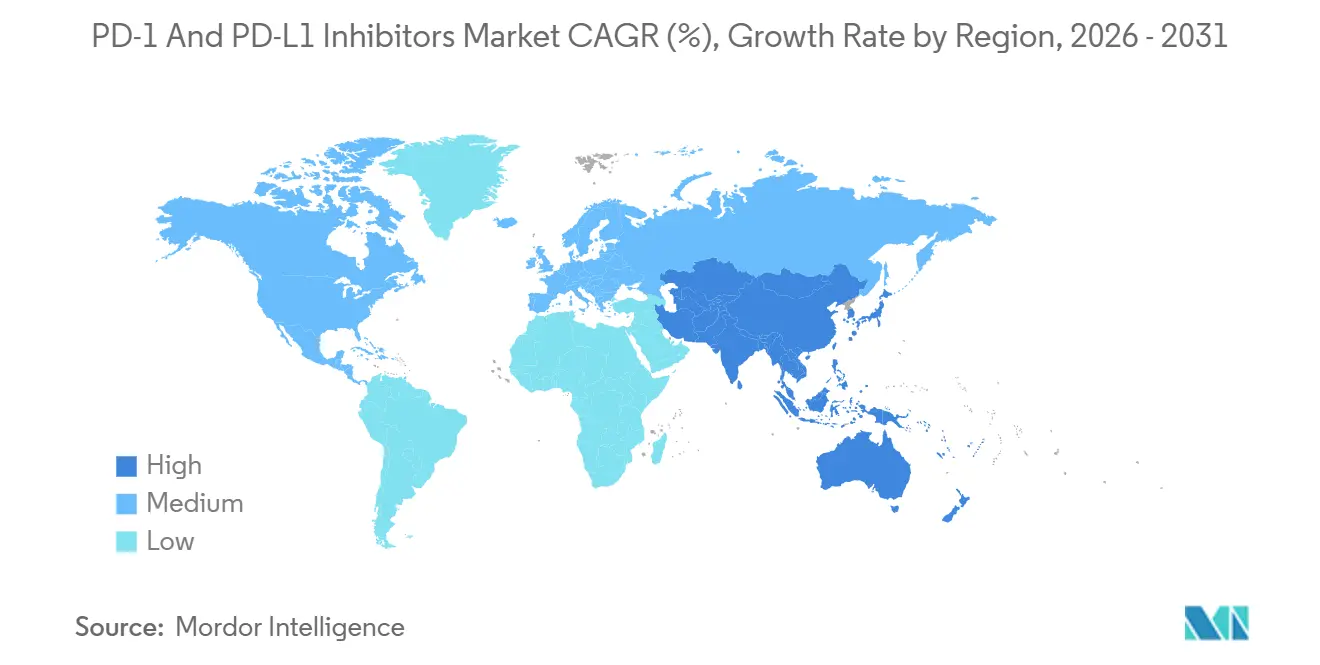
- By geography, North America accounted for 43.21% of 2025 revenue, yet Asia-Pacific is forecast to grow at 14.65% CAGR as China’s National Reimbursement Drug List widens access to domestic PD-1 brands.
Note: Market size and forecast figures in this report are generated using Mordor Intelligence’s proprietary estimation framework, updated with the latest available data and insights as of 2026.
Market Trends and Insights
Drivers Impact Analysis of PD-1 And PD-L1 Inhibitors Market*
| Driver | (~) % Impact on CAGR Forecast | Geographic Relevance | Impact Timeline |
|---|---|---|---|
| Expanding Clinical Application Across Multiple Tumor Types | +3.2% | Global, with early gains in North America and EU | Medium term (2-4 years) |
| Favorable Regulatory Pathways For Immuno-Oncology Agents | +2.1% | Global, led by FDA Breakthrough Therapy and EMA PRIME | Short term (≤ 2 years) |
| Growing Acceptance Of Combination Immunotherapies | +2.8% | North America, EU core, spill-over to APAC | Medium term (2-4 years) |
| Advancements In Predictive Biomarkers And Diagnostics | +1.9% | North America, Western Europe, Japan | Long term (≥ 4 years) |
| Increasing Oncology Healthcare Expenditures Worldwide | +2.5% | Global, accelerated in APAC middle-income economies | Long term (≥ 4 years) |
| Rising Partnerships And Licensing Deals In Immuno-Oncology | +1.4% | Global, concentrated in US-EU-China innovation hubs | Short term (≤ 2 years) |
| Source: Mordor Intelligence | |||
Favorable Regulatory Pathways for Immuno-Oncology Agents
In November 2024, Arcus Biosciences achieved accelerated approval for its drug combination, domvanalimab + zimberelimab, targeting PD-L1-high metastatic NSCLC. This approval is contingent on the company demonstrating survival benefits through Phase III trials by 2027. Similarly, China's conditional approval framework accelerates the approval process for domestic biologics, such as tislelizumab, while requiring post-marketing real-world evidence (RWE) submissions. These expedited pathways reduce early-stage capital risks but also increase exposure to potential withdrawal if critical endpoints are not met. For instance, pembrolizumab's indication for triple-negative breast cancer was rescinded in March 2024 due to unmet endpoints.
Growing Acceptance of Combination Immunotherapies
Dual checkpoint blockade, IO-chemotherapy, and IO-TKI pairings are increasingly replacing monotherapy in cases of low PD-L1 expression or immunologically "cold" tumor microenvironments. The combination of nivolumab and ipilimumab has demonstrated a median overall survival (OS) of 55.7 months in intermediate- or poor-risk renal cell carcinoma (RCC), contributing 18% to Opdivo's 2024 revenue. In the United States, pembrolizumab with chemotherapy accounts for 62% of first-line metastatic non-small cell lung cancer (NSCLC) treatments, driven by its durable 5-year survival benefits. Atezolizumab combined with bevacizumab leads the market for unresectable hepatocellular carcinoma (HCC) and has achieved reimbursement in 47 countries. While triplet regimens are advancing into late-stage trials, challenges such as high-grade toxicities (grades 3-4).
Advancements in Predictive Biomarkers and Diagnostics
Following the 2024 FDA Blueprint project, the harmonization of PD-L1 immunohistochemistry assays increased concordance to 85-92% for CPS ≥10. A 2025 study published in Nature Medicine reported that ctDNA monitoring during cycle 3 of pembrolizumab demonstrated 78% sensitivity for predicting disease progression, enabling early therapy adjustments. Strategic collaborations in spatial transcriptomics, such as the Roche-PathAI partnership, are set to be commercialized by 2027, focusing on stratifying “immune deserts.” Regulatory authorities now require prospective validation across two independent cohorts before granting companion diagnostic status, a measure that raises development costs but significantly enhances clinical applicability.
Expanding Clinical Application Across Multiple Tumor Types
Checkpoint blockade is shifting from metastatic salvage to earlier-stage disease. In May 2024, the FDA approved pembrolizumab as adjuvant therapy for resected stage IB–IIIa NSCLC, adding roughly 85,000 U.S. patients annually[1]. EMA granted conditional approval that September, pending five-year overall-survival readouts. Durvalumab secured a March 2025 U.S. label for limited-stage small cell lung cancer combined with chemoradiotherapy, opening a 30,000-patient incidence cohort. Tumor-agnostic approvals for MSI-H and TMB-H solid tumors further broaden the utility, and real-world databases already show that 12% of pembrolizumab use is directed toward rare cancers, despite the absence of large-scale trials. Together, these dynamics enlarge the PD-1 and PD-L1 inhibitors market well beyond the traditional lung and melanoma strongholds.
Restraints Impact Analysis of PD-1 And PD-L1 Inhibitors Market*
| Restraint | (~) % Impact on CAGR Forecast | Geographic Relevance | Impact Timeline |
|---|---|---|---|
| High Development And Manufacturing Costs Of Monoclonal Antibodies | -1.7% | Global (acute in emerging markets with limited infrastructure) | Medium term (2-4 years) |
| Imminent Loss Of Exclusivity For Leading Checkpoint Inhibitors | -2.3% | North America, EU (delayed effect in APAC) | Short term (≤2 years) |
| Stringent Health Technology Assessments On Cost Effectiveness | -1.2% | EU (NICE, G-BA, HAS), Canada, Australia | Medium term (2-4 years) |
| Intensifying Competition From Novel Checkpoint Modalities | -0.9% | Global (early adoption in academic centers) | Long term (≥4 years) |
| Source: Mordor Intelligence | |||
Imminent Loss of Exclusivity for Leading Checkpoint Inhibitors
Nivolumab’s core antibody patent expired in July 2026, and pembrolizumab's patent expires in June 2028, with a pediatric extension to December 2028. Eight biosimilar sponsors are in Phase III, but the FDA's 2024 extrapolation guidance may delay multi-indication launches by up to 18 months[2]. Net U.S. price erosion is projected at 25-30% over the two years post-entry, slightly below the adalimumab experience.
Stringent Health Technology Assessments on Cost Effectiveness
NICE rejected pembrolizumab-chemotherapy for triple-negative breast cancer in April 2024 at GBP 87,000 per QALY versus a GBP 30,000 threshold, forcing a confidential 45% discount before provisional approval[3]. Germany’s G-BA capped durvalumab premiums to 15% above the comparator, while ICER advised a 60% U.S. price cut for pembrolizumab-lenvatinib in RCC, prompting restrictive placement by major payers.
*Our forecasts treat driver/restraint impacts as directional, not additive. The impact forecasts reflect baseline growth, mix effects, and variable interactions.
PD-1 And PD-L1 Inhibitors Market Segment Analysis
BY Type of Inhibitors:
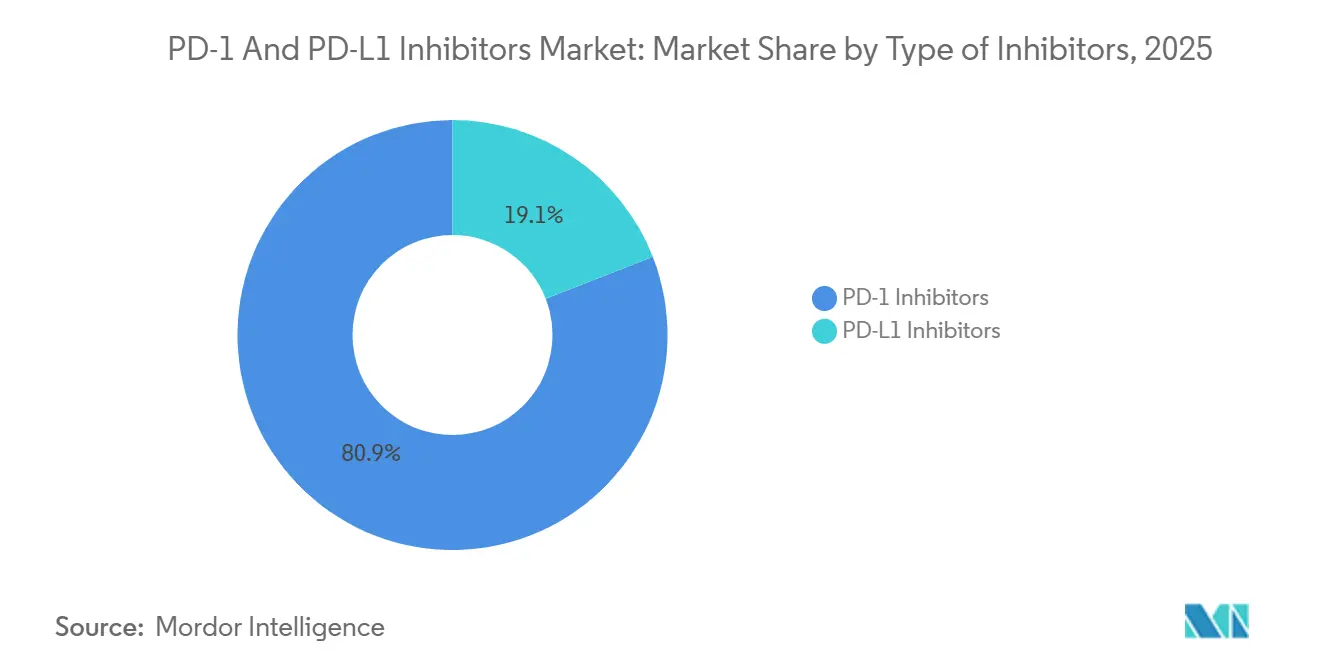
PD-1 Agents Dominate While PD-L1 Inhibitors AcceleratePD-1 agents represented 80.92% of 2025 revenue, reflecting pembrolizumab’s leadership across 20 indications and nivolumab’s entrenchment in melanoma and RCC. The PD-1 and PD-L1 inhibitor market is projected to grow from USD 60.0 billion in 2026 to USD 108.1 billion by 2031, at a 12.7% CAGR. PD-L1 inhibitors are set to outpace overall expansion, rising 15.43% annually as durvalumab consolidates its role in unresectable stage III NSCLC, and atezolizumab-bevacizumab secures reimbursement for hepatocellular carcinoma in 47 nations.
Durvalumab achieved USD 3.2 billion in global sales in 2024 under the PACIFIC paradigm and faces no direct rivals before the 2032 patent expiry. Atezolizumab captured 48% of first-line HCC starts by mid-2025, lifting its share inside the PD-1 and PD-L1 inhibitors market. Subcutaneous formulations offer further upside: Phase III Tecentriq SC aims for a five-minute injection that could shift infusions to outpatient clinics or even home care.

By Application:
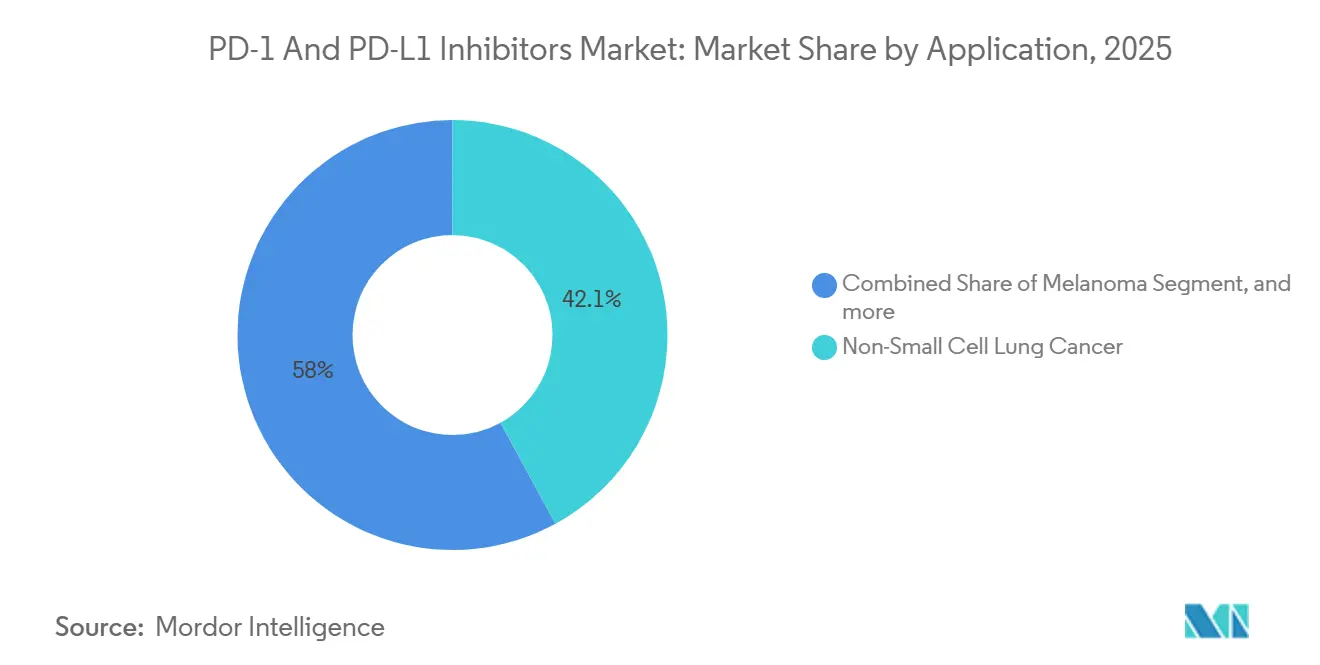
NSCLC Remains Core, Kidney Cancer Emerges FastestNSCLC accounted for 42.05% of 2025 revenue, underscoring the high incidence burden and the ubiquity of biomarker testing. Pembrolizumab-based chemo combos now dominate PD-L1-low populations, while the PACIFIC consolidation label lifted three-year real-world OS to 48 months in European cohorts. Kidney cancer accounts for only 9% of 2025 sales but is forecast to advance 15.87% CAGR on dual checkpoint and IO-TKI regimens. The PD-1 and PD-L1 inhibitors market share for kidney cancer is poised to double by 2031, driven by nivolumab-ipilimumab's durability and pembrolizumab-lenvatinib’s 71% ORR. Melanoma, Hodgkin lymphoma, and tissue-agnostic MSI-H/TMB-H indications add breadth, though payer scrutiny intensifies where survival gains remain modest.
By Distribution Channel:
Hospital Pharmacies Still Rule, Online Model Rises in APACHospital pharmacies dispensed 68.32% of checkpoint inhibitor units in 2025, sustained by Medicare Part B buy-and-bill economics in the United States and infusion infrastructure worldwide. Retail specialty outlets provided 14%. Online pharmacies hold only a 7.7% share today but will expand at a 16.21% CAGR, almost exclusively in Asia-Pacific. China’s JD Health and India’s PharmEasy link tele-oncology consults to cold-chain fulfillment, and forthcoming subcutaneous products could accelerate migration if regulators permit home administration. For now, U.S. FDA rules prohibiting mail-order infused biologics constrain digital penetration in high-income markets.
Geography Analysis
North America PD-1 and PD-L1 Inhibitors Market
North America accounted for 43.21% of 2025 revenue, driven by Medicare reimbursement and a dense clinical-trial infrastructure. The Inflation Reduction Act will negotiate pembrolizumab prices for 2027, potentially trimming U.S. sales growth to mid-single digits. Canada secured nationwide public reimbursement with an average 35% rebate, while Mexico added pembrolizumab for PD-L1 ≥ 50% NSCLC but faces supply gaps in smaller states.
Europe PD-1 and PD-L1 Inhibitors Market
Europe placed second at 28% share. Germany and France granted “considerable” or “important” benefit ratings, translating into 15-28% premiums relative to comparators, whereas the U.K. demands deep confidential discounts. Italy’s managed-entry contracts and Spain’s shorter reimbursement lags facilitate penetration beyond tertiary centers.
APAC PD-1 and PD-L1 Inhibitors Market
Asia-Pacific is projected to add 14.65% CAGR through 2031, propelled by China’s domestic quartet—tislelizumab, sintilimab, toripalimab, and serplulimab—priced at 40-60% discounts and now reimbursed nationwide. Japan broadened subsidy ceilings to cut patient co-pays by one-third, boosting initiation among seniors. India green-lit Phase III studies for a local pembrolizumab biosimilar that could arrive by 2027 at 60% lower cost, extending reach into public hospitals.
MEA and South America PD-1 and PD-L1 Inhibitors Market
The Middle East & Africa, plus South America, jointly represent 6% share. The UAE listed pembrolizumab nationally in 2024, and South Africa signed a tech-transfer license with Merck for local manufacture at 70% lower prices. Brazil’s ANVISA approved new labels but SUS reimbursement remains pending, limiting access to privately insured patients.
Regulatory Landscape
Regulatory oversight for PD-1/PD-L1 inhibitors continues to rely on stringent biologics CMC expectations and expedited oncology pathways. In the United States, the FDA's June 2026 approval of pembrolizumab in combination with belzutifan expands PD-1 backbone combinations and reinforces lifecycle management through accelerated approvals and confirmatory trials. The March 2024 withdrawal of pembrolizumab in triple-negative breast cancer also highlights enforcement when confirmatory endpoints are not met.
Value Chain Analysis
The value chain for PD-1/PD-L1 inhibitors runs from discovery and translational science through clinical development, including companion diagnostics, then into biologics drug-substance and drug-product manufacturing. Distribution ultimately depends on infusion-capable providers and hospital pharmacies, where validated biomarker testing (PD-L1 IHC and emerging ctDNA monitoring) is closely tied to patient identification speed. That diagnostic layer adds diagnostic partnerships and regulated assay supply into the value chain, shaping how quickly eligible patients can be identified at launch.
Competitive Landscape
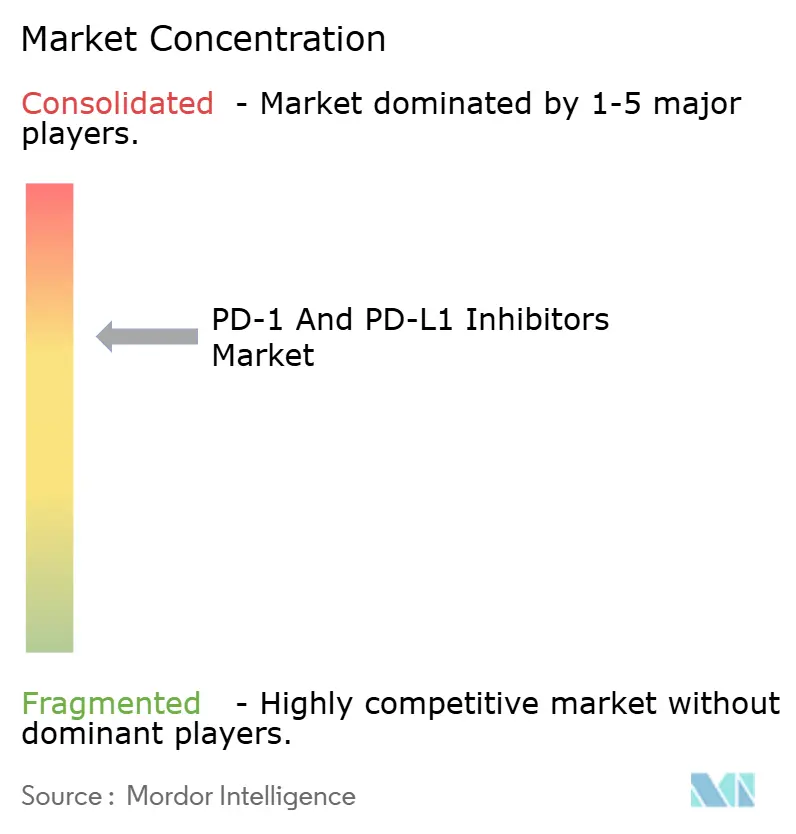
Merck, Bristol Myers Squibb, Roche, AstraZeneca and BeiGene controlled 78% of 2024 sales, underscoring a concentrated arena. Pembrolizumab alone held roughly one-third, but Merck faces price talks under U.S. law and December 2028 patent expiry. BMS responded with a USD 1.5 billion BioNTech deal for a PD-L1×VEGF-A bispecific, and Roche is banking on subcutaneous atezolizumab to defend share after the TIGIT setback. Chinese players leverage provincial tenders and lower costs to carve domestic leadership, then out-license to global majors for Western launches.
Biosimilar disruption looms: Amgen, Sandoz, Samsung Bioepis and peers have Phase III programs that, if successful, could reach the EU as early as late 2027. FDA requirements for indication-specific extrapolation may stagger U.S. debuts, but projected 25-30% net price cuts will still pressure incumbents. Subcutaneous, fixed-dose combos and bispecific architectures therefore represent key differentiation levers.
Early-pipeline challengers target cold tumors and resistance pathways. Arcus’ domvanalimab-zimberelimab secured FDA accelerated approval in 2024, and Regeneron obtained Breakthrough Therapy for fianlimab-cemiplimab. Should Phase III data replicate elevated ORRs, niche subsets could migrate away from legacy PD-1 monotherapy, fragmenting the PD-1 and PD-L1 inhibitors market ahead of biosimilar entry.
PD-1 And PD-L1 Inhibitors Industry Leaders
-
Bristol-Myers Squibb Company
-
Merck & Co.
-
F. Hoffmann-La Roche AG
-
Pfizer Inc.
-
GSK plc
- *Disclaimer: Major Players sorted in no particular order
PD-1 And PD-L1 Inhibitors Market Companies Covered in this Report
- Akeso Inc.
- Amgen
- Arcus Biosciences
- AstraZeneca
- BeiGene Ltd.
- Bristol-Myers Squibb
- Coherus BioSciences
- Daiichi Sankyo Co., Ltd.
- Eli Lilly and Company
- Roche
- GlaxoSmithKline
- Henlius Biotech
- Hengrui Medicine
- Innovent Biologics
- Leap Therapeutics
- Merck
- Novartis
- Pfizer
- Regeneron Pharmaceuticals
- Sanofi
- Shanghai Junshi Biosciences
- Zai Lab Ltd.
Market Opportunities and Future Outlook
In Europe, uptake is shaped by EMA centralized procedures alongside country-level HTA decisions from entities such as NICE and Germany's G-BA, where reimbursement is tied to incremental clinical value and cost effectiveness. In Asia-Pacific, China's NMPA and its conditional approval framework support faster access for domestic PD-1/PD-L1 programs, including the February 2026 NMPA approval for benmelstobart as consolidation therapy in unresectable stage III NSCLC.
Across regions, regulatory practice increasingly emphasizes biomarker-defined populations and post-marketing real-world evidence submissions. Safety surveillance and authorized-biologic registries further support ongoing pharmacovigilance across mature markets.
Recent Industry Developments in PD-1 And PD-L1 Inhibitors Market
- July 2026: The US FDA approved Padcev (enfortumab vedotin) plus KEYTRUDA (pembrolizumab), including KEYTRUDA QLEX, as neoadjuvant and adjuvant treatment for muscle-invasive bladder cancer regardless of cisplatin eligibility. The decision extends PD-1 use deeper into perioperative care, which increases treatment duration per patient and reinforces the role of PD-1 backbones in antibody-drug conjugate combinations.
- May 2026: Pfizer announced a partnership with Innovent Biologics to license and co-develop a portfolio of 12 antibody-drug conjugates and multispecific antibody programs, with total potential deal value reported up to USD 10.5 billion. The collaboration expands Pfizer's access to combination-ready oncology assets that can be paired with checkpoint inhibition, and it adds competitive pressure around next-generation immuno-oncology regimens.
- August 2024: The FDA cleared dostarlimab plus carboplatin-paclitaxel for advanced endometrial cancer, supported by a 36% reduction in mortality risk. This broadened the set of checkpoint-based combinations in gynecologic oncology and strengthened the case for PD-1/PD-L1 inhibitors beyond traditional lung and melanoma strongholds.
PD-1 And PD-L1 Inhibitors Market Report Scope and Research Methodology
Market Definition and Coverage
This market covers revenues generated from PD-1 and PD-L1 inhibitor therapies used in clinical practice, where value is counted from sales through hospital, retail, and online pharmacy channels across major geographies.
Scope exclusions: We exclude non PD-1 or PD-L1 checkpoint targets and we do not count preclinical molecules that are not yet commercialized.
Segments Covered in This Report
- By Type Of Inhibitors
- PD-1 Inhibitors
- PD-L1 Inhibitors
- By Application
- Non-Small Cell Lung Cancer
- Melanoma
- Kidney Cancer
- Hodgkin Lymphoma
- Other Cancers
- By Distribution Channel
- Hospital Pharmacies
- Retail Pharmacies
- Online Pharmacies
- Geography
- North America
- United States
- Canada
- Mexico
- Europe
- Germany
- United Kingdom
- France
- Italy
- Spain
- Rest of Europe
- Asia-Pacific
- China
- Japan
- India
- Australia
- South Korea
- Rest of Asia-Pacific
- Middle East & Africa
- GCC
- South Africa
- Rest of Middle East & Africa
- South America
- Brazil
- Argentina
- Rest of South America
- North America
Data Sources, Market Sizing, and Validation
Desk Research
Desk work starts by framing where demand comes from, which cancers most often use these therapies, and how access differs by country. We review public sources such as US FDA drug labels and the FDA approvals database, EMA public assessment reports, and clinical trial registries like ClinicalTrials.gov to track indication expansion and timing.
To ground utilization assumptions, we also refer to cancer incidence and prevalence releases from WHO and IARC, plus national statistics portals and peer-reviewed oncology journals for treatment pathway context. Company filings, earnings decks, and trusted press are used to validate launch timing, geography mix, and broad pricing direction. Then the numbers are cross-checked with paid subscriptions used for company financials and patent landscapes. The desk sources listed here are illustrative, and many other public documents were also used for data collection, validation, and clarification.
Primary Interviews and Surveys
Primary discussions focus on oncologists, hospital pharmacists, payers, and commercial managers to confirm adoption curves by line of therapy and the real world mix between PD-1 and PD-L1 agents. For a global market like this, we also balance perspectives across the Americas, EMEA, and APAC so that access constraints, reimbursement shifts, and indication uptake are reflected consistently in the assumptions we lock into the model.
Distribution of primary research fieldwork respondents
| Company type | Respondent position | Region |
|---|---|---|
| Top tier: 26% | CXOs: 13% | APAC: 45% |
| Mid tier: 60% | Functional/Unit leaders: 34% | EMEA: 37% |
| Smaller Players: 14% | Managers: 53% | Americas: 18% |
Market-Sizing & Forecasting
Our core build uses a top-down demand pool approach where treated patient volumes are reconstructed from cancer burden by country. These volumes are filtered through diagnosis rates, biomarker and eligibility rules, and typical lines of therapy where PD-1 or PD-L1 agents are used. Once that demand base is formed, it is converted to value using therapy mix, average dosing and duration, and net price proxies that reflect channel and reimbursement realities.
To keep the totals realistic, the outputs are corroborated through selective bottom-up approximations. For example, analysts sample country-level revenue signals from public financial disclosures and use channel checks to sanity test average therapy cost by region. Inputs that matter most include new indication approvals by year, biosimilar and brand competition timing, shifts in combination regimens, and country-level reimbursement breadth. These are then matched against observed oncology utilization patterns from expert feedback. Forecasting is done with scenario analysis supported by regression-style checks on key drivers like cancer incidence growth, approval cadence, and access expansion. Assumptions are tightened through follow-up calls when a variable looks out of line. If a bottom-up check is incomplete for a smaller country, we fill gaps using proxy markets with similar access and pricing, then adjust for population and oncology spend differences.
Data Validation & Update Cycle
Validation is done through several steps so single source bias is minimized. Model outputs are compared against independent signals such as publicly discussed oncology revenue direction, approval timelines, and region mix. Large variances are reviewed by another analyst before sign-off.
When an assumption changes the curve materially, like a new label expansion, reimbursement decision, or accelerated uptake in a major indication, we re-contact domain experts to confirm the magnitude and timing. Reports are refreshed annually, and interim updates are made for material events that can change demand or pricing. Before delivery, a fresh pass is completed so clients receive the latest updated view that matches current public facts and validated assumptions.
Mordor Intelligence's Pd1 and Pdl1 Inhibitors Market Size Compared With Other Published Estimates
Published market values for PD-1 and PD-L1 inhibitors can differ more than people expect, even when everyone is talking about the same therapy class. The gaps usually come from what is counted in scope, the year used as the base, and how net prices and adoption are treated across regions.
Some external studies fold in adjacent immuno-oncology drug classes or add autoimmune use cases into the same bucket, which inflates the headline number. For Mordor Intelligence, the value is restricted to PD-1 and PD-L1 inhibitor revenues, and it is sized by matching treated patient demand to indication-level uptake and channel-level pricing logic, then reconciled back to country and regional totals.
Benchmark comparison
| Source | Market Size | Gaps in Research Methodology |
|---|---|---|
| Mordor Intelligence | USD 62.12 B (2025) | |
| Global Consultancy A | USD 63.74 B (2025) | Uses a similar therapy definition but can apply a different net pricing progression and faster uptake assumptions for later line usage, which pushes the 2025 point estimate slightly higher. |
| Industry Publisher B | USD 51.50 B (2024) | Reports a different base year and mixes in broader application buckets across its write-up, which can shift what is counted and how regional access is weighted for the current year value. |
Taken together, the spread is mainly explained by year alignment and how tightly the therapy scope is kept to PD-1 and PD-L1 inhibitors, plus the way net price and adoption are refreshed. By anchoring the model on treated patient build-ups, approval timing, and channel pricing checks, we keep the estimate traceable to clear inputs that can be revisited as new indications and access decisions appear in the market.
Key Questions Answered in the Report
How big could worldwide sales of PD-1 and PD-L1 inhibitors become by 2031?
Consensus projections in this analysis place revenue at USD 142.04 billion, up from USD 74.16 billion in 2026, reflecting a 13.88% compound annual growth rate.
Which region is expected to post the strongest expansion over the next five years?
Asia-Pacific leads with a projected 14.65% CAGR as China's reimbursement list now covers multiple domestic PD-1 brands and Japan broadens high-cost subsidies.
When do leading brands pembrolizumab and nivolumab face loss of exclusivity in the United States?
Nivolumab's core patent expired in July 2026, while pembrolizumab's composition-of-matter patent ends in June 2028 with pediatric extension through December 2028.
What pricing impact is anticipated once biosimilar checkpoint inhibitors launch?
Net U.S. prices are forecast to fall 25Ð30% within two years of biosimilar entry, a smaller drop than the 35Ð40% seen after adalimumab competition because of infusion-site economics.
Which cancer currently generates the largest checkpoint inhibitor demand?
Non-small cell lung cancer accounts for roughly 42% of global PD-1 and PD-L1 use, driven by first-line combination regimens and adjuvant consolidation therapy.
Are patient-friendly subcutaneous versions on the horizon?
Yes, Roche's five-minute subcutaneous atezolizumab is in Phase III trials with filings targeted for late 2026, potentially enabling home or retail-clinic administration.