
Particle Counters Market Size and Share
Market Overview
| Study Period | 2020 - 2031 |
|---|---|
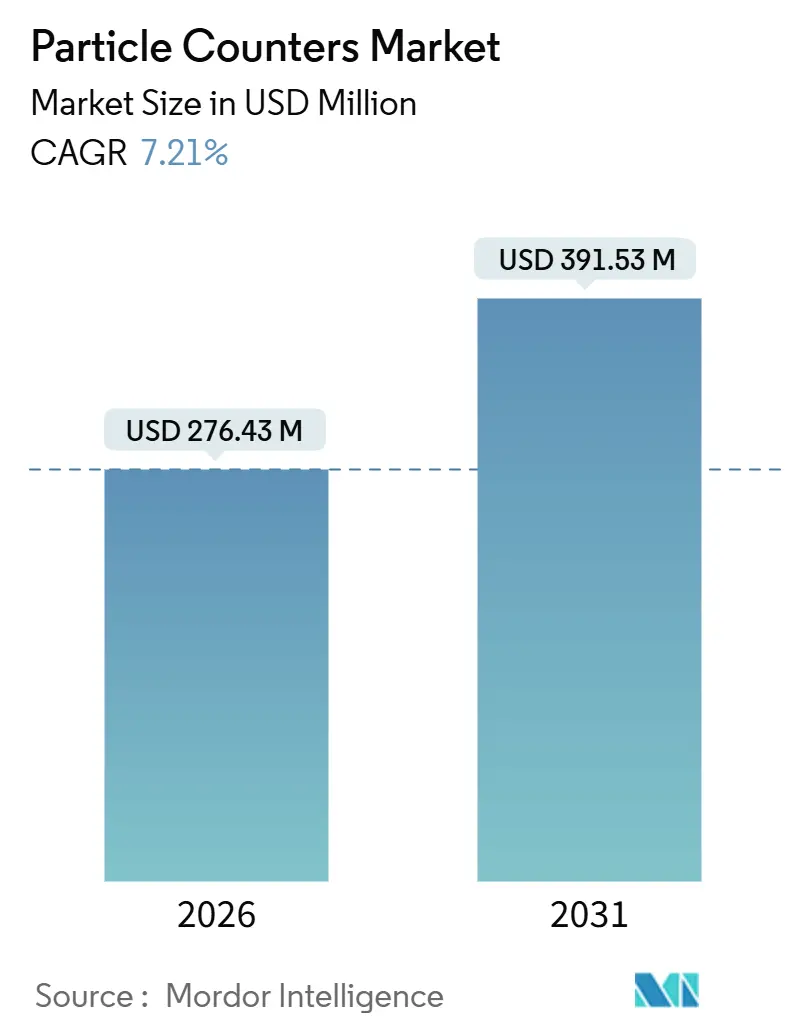
| Market Size (2026) | USD 276.43 Million |
| Market Size (2031) | USD 391.53 Million |
| Growth Rate (2026 - 2031) | 7.21 % |
| Fastest Growing Market | Asia Pacific |
| Largest Market | North America |
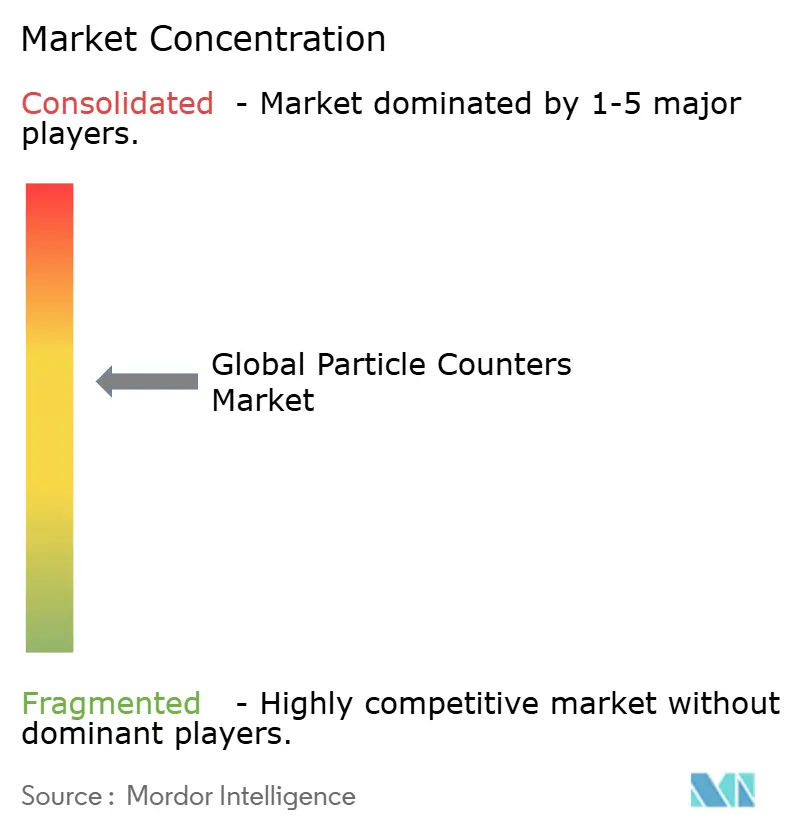
| Market Concentration | Medium |
Major Players *Disclaimer: Major Players sorted in no particular order Image © Mordor Intelligence. Reuse requires attribution under CC BY 4.0. | |
Particle Counters Market Analysis by Mordor Intelligence
The Particle Counters Market size is estimated at USD 276.43 million in 2026, and is expected to reach USD 391.53 million by 2031, at a CAGR of 7.21% during the forecast period (2026-2031).
This growth trajectory stems from revised GMP Annex 1 rules mandating continuous viable and non-viable monitoring, semiconductor fabs moving to 2-nanometer logic nodes that require sub-10 nanometer detection, and large-scale ambient air-quality programs across Asia that are expanding monitoring density by an order of magnitude. Demand is further reinforced by cell-therapy cleanrooms, EV battery gigafactories with ultra-dry rooms, and AI-enabled predictive maintenance platforms that cut calibration costs. As a result, buyers are migrating from standalone handheld units to networked remote counters that integrate audit-trail automation, edge analytics, and cloud-based data integrity.
Competition pivots on three levers: sensitivity, connectivity, and service. Incumbents led by Danaher, TSI, and Spectris are bundling water-based condensation technology, 21 CFR Part 11 software, and ISO/IEC 17025 onsite calibration to preserve recurring revenue. Niche firms target price-sensitive segments with simplified optics and subscription-free firmware, while integrators introduce digital twins that predict sensor drift. Regional dynamics amplify these strategies. North America favors high-value pharmaceutical and advanced logic fabs; Asia-Pacific scales massive ambient networks and gigafactories; Europe lags as fab postponements delay new orders. Collectively, these trends underpin an enduring replacement cycle, sustaining the particle counters market as a critical instrumentation niche across health, electronics, energy, and climate research.
Key Report Takeaways
- By product type, airborne counters led with a 61.42% market share of particle counters in 2025, while liquid counters are projected to expand at a 9.32% CAGR through 2031.
- By application, cleanroom monitoring accounted for 64.09% of the particle counter market size in 2025; aerosol monitoring and research are forecasted to advance at an 8.97% CAGR through 2031.
- By modality, benchtop instruments held 50.89% share of the particle counters market in 2025, whereas remote instruments are poised for an 8.68% CAGR between 2026 and 2031.
- By end user, pharmaceutical and biotechnology companies captured 38.20% of the particle counters market in 2025; academic and research institutes are projected to grow at a 9.67% CAGR through 2031.
- By geography, North America accounted for 41.65% of the particle counters market in 2025, but the Asia-Pacific region is expected to grow at an 8.18% CAGR over the forecast period.
Note: Market size and forecast figures in this report are generated using Mordor Intelligence’s proprietary estimation framework, updated with the latest available data and insights as of January 2026.
Market Trends and Insights
Drivers Impact Analysis of Particle Counters Market*
| Driver | (~) % Impact on CAGR Forecast | Geographic Relevance | Impact Timeline |
|---|---|---|---|
| Stricter Global Cleanroom Standards | +1.8% | North America, Europe | Medium term (2-4 years) |
| Rapid Growth in Biologics & Cell-Therapy | +1.5% | North America, Asia-Pacific | Medium term (2-4 years) |
| Sub-Micron Monitoring for 2 nm Semiconductors | +1.3% | Taiwan, South Korea, Japan, United States | Long term (≥ 4 years) |
| EV Battery Gigafactories & Ultra-Dry Rooms | +1.0% | Germany, China, South Korea | Medium term (2-4 years) |
| Government-Funded Ambient Networks | +0.9% | India, China, Southeast Asia | Short term (≤ 2 years) |
| AI-Enabled Predictive Maintenance | +0.7% | Global | Short term (≤ 2 years) |
| Source: Mordor Intelligence | |||
Stricter Global Cleanroom Standards (ISO 14644 & GMP Annex 1)
As of August 2023, Annex 1 requires sterile drug manufacturers to maintain continuous particle logs in Grade A and B zones, replacing periodic spot checks. ISO 14644-5:2025 further allows operators to extend requalification intervals from six to 24 months when online data demonstrates compliance, thereby reducing downtime and validation costs. Instruments such as Beckman Coulter’s MET ONE 3400+ automate SOPs and audit trails, ensuring one-click compliance for FDA inspectors[1]. Companies that have delayed upgrades now face heightened regulatory scrutiny, accelerating a replacement wave across legacy handheld fleets.
Rapid Growth in Biologics and Cell-Therapy Manufacturing
Single-use bioreactors pose unseen breach risks, prompting CDMOs to install real-time particle counters in filling suites that can flag bag failures before USD 5 million batches are lost. The FDA’s 2024 guidance on advanced therapies treats environmental monitoring as a critical quality attribute, cementing continuous particle trending as standard practice. TSI’s BioTrak counter differentiates viable microbes from inert particles, closing a long-standing data gap that once forced operators to cross-reference separate air samplers. More than 1,200 active cell-therapy trials concentrate demand in the United States and China, fuelling strong unit sales to facilities that reconfigure cleanrooms between campaigns.
Accelerating Semiconductor Node Shrink Demanding Sub-Micron Monitoring
At the 2-nanometer node, a stray 20 nm contaminant can short adjacent transistors and crater yield. Traditional optical counters typically stop at roughly 100 nm, so fabs often adopt condensation particle counters that generate aerosols for optical detection. TSI’s Nano LPM, launched in November 2025, delivers accurate 10 nm liquid detection by aerosolizing UPW and counting residuals with water-based condensation optics, eliminating microbubble artifacts that plagued earlier systems. Capital intensity reinforces the value proposition: a 0.1% yield gain at a USD 40 billion fab offsets millions of dollars in sensor spending.
Surge in EV Battery Gigafactories and Ultra-Dry Room Adoption
Lithium-ion cathode coating runs below 1% RH to curb lithium oxidation, necessitating ISO Class 6-8 rooms with continuous particle tracking. Volkswagen’s 40 GWh Salzgitter plant already fields more than 200 remote counters networked via industrial Ethernet. Yet, low humidity shifts the refractive indices of laser beams, so algorithms now auto-correct for moisture to contain sizing errors within 15%. Tesla’s Nevada facility couples predictive maintenance software to these sensors, cutting unplanned downtime by roughly 20% and underscoring how digital twins amplify instrument ROI.
Restraints Impact Analysis of Particle Counters Market*
| Restraint | (~) % Impact on CAGR Forecast | Geographic Relevance | Impact Timeline |
|---|---|---|---|
| High CapEx for HEPA-Grade Environments | -0.8% | Global, acute in emerging markets | Medium term (2-4 years) |
| Scarcity of Certified Calibration Capacity | -0.6% | Asia-Pacific, Middle East & Africa, Latin America | Long term (≥ 4 years) |
| Sensor Drift in High-Humidity Lines | -0.4% | Southeast Asia, India, Brazil | Short term (≤ 2 years) |
| European Fab Consolidation | -0.3% | Europe | Medium term (2-4 years) |
| Source: Mordor Intelligence | |||
High Capital Expenditure for HEPA-Grade Controlled Environments
Constructing an ISO Class 7 cleanroom averages USD 1,500-3,000 per ft², while a 20-counter network can add USD 200,000 in hardware alone. Recurring services—such as filters, calibration, and licenses—absorb 20-30% of that outlay each year, posing a challenge to smaller CDMOs and academic labs. Many generic producers in Southeast Asia, therefore, rely on handheld validation instead of continuous monitoring, accepting higher regulatory risk to conserve cash. Leasing and calibration-as-a-service models have emerged, yet uptake is slow because asset-heavy firms prefer ownership for depreciation benefits.
Scarcity of Certified Calibration Technicians and Laboratories
Fully traceable calibration hinges on ISO/IEC 17025 labs that reference national metrology institutes. Fewer than 200 such labs worldwide offer aerosol calibration, and fewer than 30 serve the entire Indian subcontinent and Southeast Asia[2]. Instruments shipped abroad face 4-week turnarounds and freight risks, so many owners run with expired certificates. Field-service teams from TSI and Beckman Coulter do bring portable transfer standards on-site, but the daily rates of USD 2,000-5,000 price out small facilities, reinforcing a two-tier compliance landscape.
*Our forecasts treat driver/restraint impacts as directional, not additive. The impact forecasts reflect baseline growth, mix effects, and variable interactions.
Particle Counters Market Segment Analysis
By Product Type:
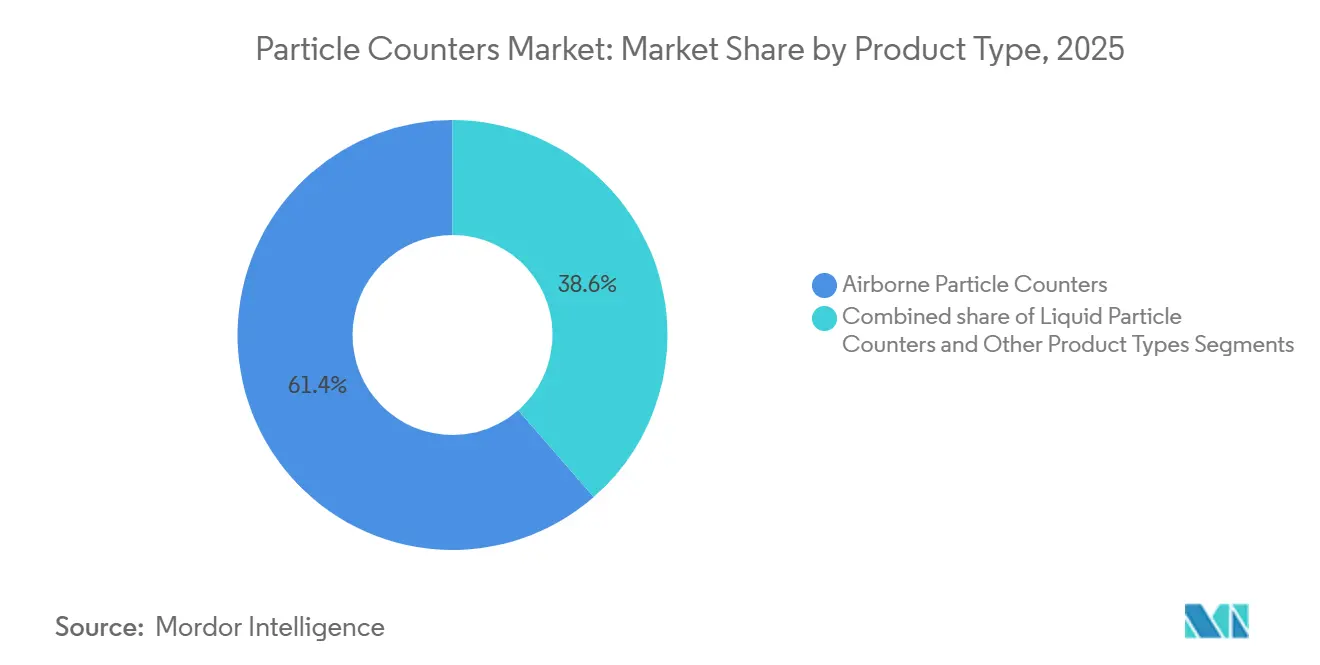
Liquid Counters Gain on Semiconductor Wet-Process NeedsAirborne particle counters retained 61.42% of the particle counters market share in 2025, cementing their role in pharmaceutical cleanrooms, wafer fabs, and national monitoring grids. Liquid particle counters, however, will register a 9.32% CAGR through 2031 as fabs push UPW purity into the single-digit parts-per-trillion range and gigafactories police deionized rinse water for metallic seeds that trigger dendrites. The particle counters market size for liquid applications is thus poised to narrow the volume gap with airborne units, while commanding higher margins due to sub-10 nm detection requirements.
Vendors now integrate aerosolization stages and water-based condensation optics to bypass Mie-scattering limits, enabling actual resolutions of 10 nm. Instruments such as the Nano LPM carry a 20-30% price premium but justify the cost by preventing scrap on USD 5 billion lithography lines. In contrast, aerodynamic and condensation sizers are used in inhaler validation, atmospheric science, and diesel filter testing. Although collectively accounting for less than 10% of shipment volume, these niche devices sustain steady demand from academic labs and regulatory agencies that require ultrafine resolution beyond standard optical microscopes.

By Application:
Aerosol Research Rides Academic Funding WaveCleanroom Monitoring generated 64.09% of 2025 revenue as Annex 1 and ISO 14644 automation turned real-time logging from best practice into baseline expectation[3]. Yet Aerosol Monitoring and Research will post the quickest growth at 8.97% CAGR to 2031, propelled by the NSF’s ASCENT network and DOE aerosols-cloud programs that flood universities with grant funds for SMPS and condensation counters. The particle counters market size for research is therefore expanding faster than legacy pharma demand, a signal that public health and climate science are shifting industry frontiers.
Projects exploring ultrafine links to Alzheimer’s, cardiovascular disease, and atmospheric radiative forcing require instruments down to 10 nm. Manufacturers respond with dual-mode units that toggle between airborne and liquid channels, letting investigators capture both particle size and chemical fingerprint in a single run. Pharmaceutical and semiconductor labs also leverage these research-grade features to map root-cause mechanisms behind micro-contamination, blurring historical lines between production QA and academic discovery.
By Modality:
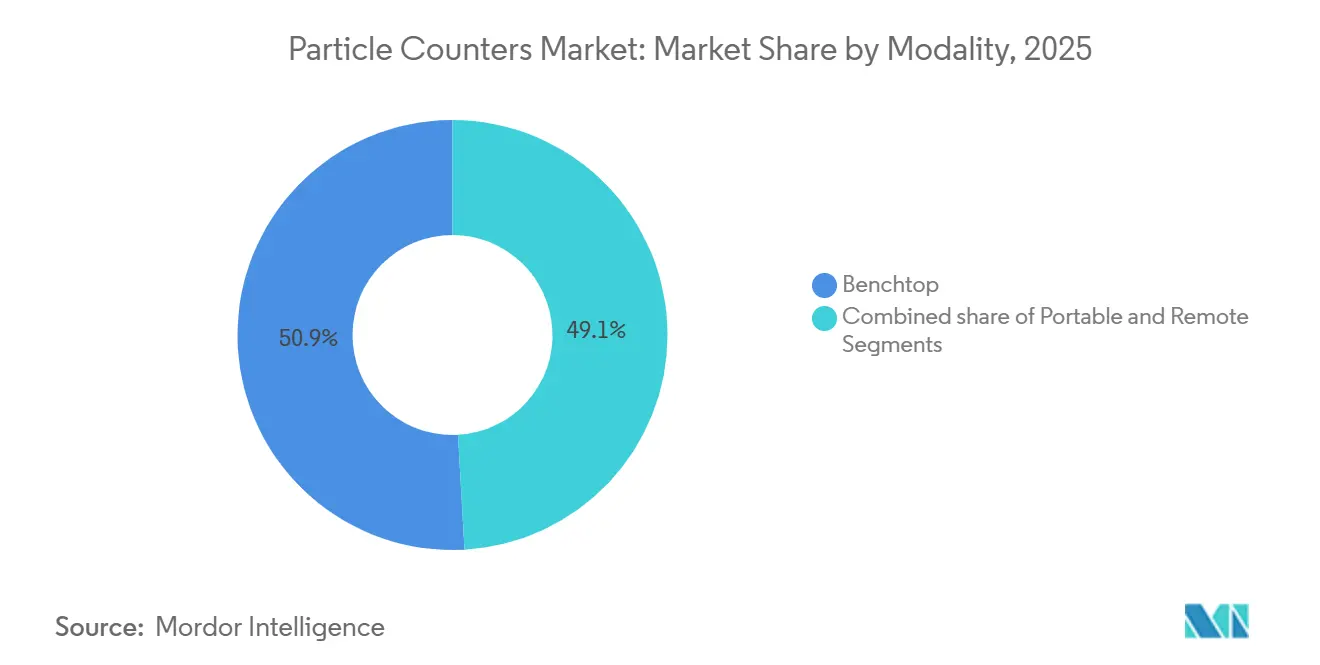
Remote Units Capture Continuous-Monitoring MandateBenchtop units accounted for 50.89% of shipments in 2025 due to their high flow rates and established role in quarterly room certification. However, remote instruments are expected to grow at an 8.68% CAGR as operators retrofit Power-over-Ethernet nodes across ceiling grids and connect them to MES or BMS software for instant deviation alerts. The particle counters market embraces this shift because continuous data closes gaps left by episodic audits, thereby reducing batch-failure risk.
AeroTrak+ remote models include five-year laser warranties and onboard storage for six months, addressing lifetime cost anxieties that once deterred adoption. Portable counters remain vital for troubleshooting and field surveys, particularly in areas where calibration labs are scarce. They now pair dual channels and battery packs to fit personal exposure studies, expanding use cases beyond factory walls. Though average sale prices are lower, portability opens new buyer pools in hospitals, data centers, and food-processing plants that historically could not justify fixed installations.
By End User:
Academic Institutes Accelerate on Aerosol-Health ResearchPharmaceutical and biotechnology companies held 38.20% of demand in 2025, anchored by sterile injectables and cell-therapy suites that cannot risk microbial ingress. Academic and Research Institutes, however, are slated to advance at a 9.67% CAGR as federal and foundation grants bankroll ultrafine-particle studies across epidemiology, climate, and materials science. The particle counters market size for universities is thus rising, both in terms of instrument count and technical sophistication, especially as on-campus nanofabs require ISO Class 5-7 containment.
Clinical labs utilize counters to validate the sterility of blood products and compounded medications, while aerospace and food processors adopt them for component cleanliness and HACCP programs. This spectrum underscores a bifurcated customer base: high-reliability buyers prioritize full life-cycle service, whereas grant-funded labs accept manual data pulls to stretch scarce budgets. Vendors are responding with tiered portfolios and subscription-based analytics, allowing users to upgrade capabilities without replacing hardware.
Geography Analysis
North America Particle Counters Market
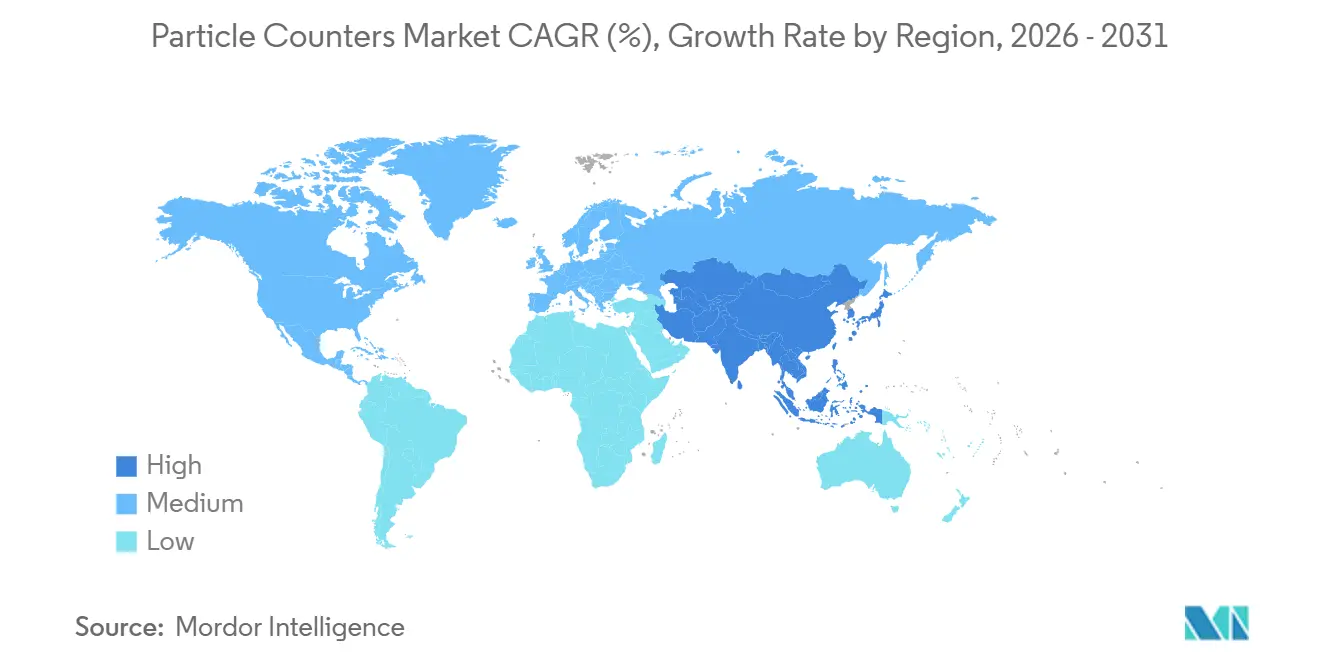
North America accounted for 41.65% of 2025 revenue, supported by FDA Annex 1-equivalent oversight and CHIPS Act incentives that underwrite the construction of new fabs in Arizona and Ohio. The particle counters market size in the region expands steadily because pharma and logic-node leaders treat continuous monitoring as non-negotiable for compliance and yield. ISO/IEC 17025 coverage exceeds 50 accredited labs, trimming calibration downtime to under one week. Local incumbents leverage this service network to lock in annuity contracts and defend share against price-focused imports.
APAC Particle Counters Market
The Asia-Pacific region will record the fastest growth at an 8.18% CAGR through 2031, as India and China invest billions in ambient networks, and as Taiwan, Japan, and South Korea ramp up 2-nm production lines. Government allocations—Rs. 19,614 crore in India and CNY 30 billion in China—fortify public tenders that often bundle calibration services to overcome technician scarcity. Meanwhile, over 80 EV battery plants across China, Korea, and Japan embed hundreds of remote counters per site, rapidly expanding the installed base. Vendors offering turnkey calibration-as-a-service gain traction because only 30 accredited aerosol labs serve the entire sub-continent, making on-site verification far more practical.
Europe Particle Counters Market
Europe claims roughly 23% share but faces headwinds. Intel has postponed its EUR 30 billion Magdeburg fab, and ASML shipped only 60 EUV tools in 2025, down from earlier projections, which has muted fresh equipment orders. Growth instead rests on Annex 1 replacement cycles and on battery-cell lines such as Volkswagen’s Salzgitter and Northvolt’s Ett, which still trail Asia in capacity. The region benefits from a dense calibration infrastructure at PTB and NPL, ensuring compliance speed; however, suppliers are increasingly pivoting toward software upgrades and sensor retrofits to offset lulls in new installations.
MEA and South America Particle Counters Market
The Middle East & Africa, as well as South America, jointly contribute under 10% but hold latent upside. Brazil’s adoption of Annex 1-style monitoring in 2024 forces local drug makers to modernize, yet the absence of domestic calibration labs slows rollouts. Gulf states exploring local semiconductor fabs could unlock demand for instruments, but projects remain at the feasibility stage. In both regions, portable counters validated against transfer standards offer a stopgap until home-grown metrology capacity matures.
Regulatory Landscape
Regulation of particle counters is primarily standards-driven, since these instruments are used to evidence compliance in controlled environments such as sterile drug manufacturing and medical device production. In the EU, the revised EU GMP Annex 1 for sterile medicinal products has been fully effective since 25 August 2024, and it elevates continuous non-viable particle monitoring in Grade A (and related critical zones) from periodic verification to a continuous, documented control requirement within a site-wide Contamination Control Strategy (CCS). This regulatory shift raises demand for networked counters, electronic records, and inspection-ready data trending, rather than standalone spot-check instruments.
On the instrumentation and device-quality side, cleanroom classification and monitoring typically reference ISO 14644 (cleanroom classification framework) and ISO 21501-4 for airborne particle counter calibration and counting performance, including traceability expectations often tied to NIST-traceable reference particles in practice. In the United States, the FDA Quality Management System Regulation (QMSR) takes effect on 2 February 2026, aligning 21 CFR Part 820 more closely with ISO 13485:2016 and reinforcing requirements around documented processes and data integrity for regulated manufacturing environments that deploy particle monitoring systems.
Competitive Landscape
The particle counters market is moderately concentrated. Danaher, TSI Incorporated, and Spectris collectively control roughly 50-55% of the global revenue, anchored by deep service staff rosters, proprietary optics, and FDA-validated software. Nonetheless, fragmentation is accelerating as challengers introduce AI modules that predict sensor drift and condensation designs that replace butanol with water, easing maintenance. Particle Measuring Systems’ 2024 acquisition of its long-time Irish distributor illustrates a broader trend toward direct sales, which strengthens post-sale engagement and secures data-service revenues.
Patents tell a defensive story. RION filed multiple Brownian-motion sizing and microbial counting patents between 2020 and 2025, while TSI expanded claims around water-based condensation growth. These moves protect incumbents’ ultrafine niches but stop short of disruptive platform shifts, leaving room for startups that mesh particle, gas, and acoustic sensing into unified edge devices. Calibration capacity remains a strategic chokepoint: fewer than 50 accredited labs serve emerging Asia, so vendors bundling onsite calibration gain negotiating leverage. Kanomax, Climet, and Suzhou Honri exploit this by offering counters 30-40% cheaper than premium brands, trading margin for quick share in price-sensitive markets.
White-space opportunities cluster around services. Mobile reference labs that co-calibrate low-cost sensor grids can trim field expenses by 40-50%, a compelling pitch for governments scaling ambient networks. Digital twins that model sensor aging permit just-in-time calibration, cutting downtime and consumables. Vendors able to wrap these analytics into annual contracts stand to elevate lifetime value per instrument even as hardware ASPs compress under competitive pressure.
Particle Counters Industry Leaders
-
TSI Inc.
-
Lighthouse Worldwide Solutions
-
RION Co., Ltd.
-
Spectris
-
Danaher
- *Disclaimer: Major Players sorted in no particular order
Particle Counters Market Companies Covered in this Report
- Beckman Coulter (Danaher)
- Chemtrac Systems
- Climet Instruments Company
- Danaher
- Fortive
- Hal Technology LLC
- Kanomax USA, Inc.
- Lighthouse Worldwide Solutions
- Markus Klotz
- Met One Instruments Inc.
- Microtrac Retsch GmbH
- PAMAS Partikelmess- Und Analysesysteme GmbH
- Particle Plus Inc.
- RION
- Spectris
- Suzhou Honri Airclean Technology Co., Ltd.
- Topas GmbH
- TSI Inc.
Market Opportunities and Future Outlook
A key whitespace is turning Annex 1-driven continuous monitoring into complete, validated digital workflows, where particle counters feed compliant electronic records, trending, and alarms that map into batch documentation. The 25 August 2024 full effectiveness of EU GMP Annex 1 and the market shift toward CCS-based inspections are pushing sites to replace fragmented handheld sampling with fixed remote counters, audit-trail automation, and software that supports 21 CFR Part 11-style data integrity expectations. Buyers are concentrating on solutions that reduce the operational burden of continuous monitoring, including systems designed for faster qualification, automated SOP execution, and simplified review-by-exception.
Another opportunity is combining viable monitoring with automation for advanced aseptic processing. In 2026, peer-reviewed PDA Journal of Pharmaceutical Science and Technology work described integration of viable biofluorescent particle counters (BFPC) into robotic, gloveless isolators to monitor viable and non-viable particles during aseptic filling, outlining a pathway for higher-frequency monitoring without disrupting isolator operations. At the same time, platform strategies that add in-field calibration and data logging (instead of lab-only recalibration cycles) target a recognized bottleneck in certified calibration capacity, particularly in parts of Asia-Pacific where accredited aerosol calibration labs are limited. These use cases support demand for integrated workflows that combine counters, connectivity, and calibration processes, especially in high-uptime environments such as semiconductor UPW monitoring, battery dry rooms, and multi-product cell-therapy cleanrooms.
Recent Industry Developments in Particle Counters Market
- July 2026: TSI Incorporated expanded its OmniTrak Solution platform to support in-field calibration and integration with OmniCount portable water-based condensation particle counter models 3002 and 3001. This reinforces the shift from standalone instruments to connected workflows that reduce downtime and simplify compliance documentation for continuous monitoring programs.
- October 2025: RION Co., Ltd. authorized Nihon Denkei Co., Ltd. as a distributor for its particle counters and related after-sales services across multiple Asian markets, including Singapore, Thailand, the Philippines, and India. The authorization expands regional channel coverage and service accessibility in a geography where calibration and support capacity can constrain deployment density.
- April 2025: TSI Incorporated released the OmniCount Portable Water-based Condensation Particle Counter Model 3002 for ultrafine particle measurement. Introducing a portable water-based condensation option broadens field and troubleshooting use cases while aligning with customer preferences for lower-maintenance condensation approaches compared with legacy chemistries.
Particle Counters Market Report Scope and Research Methodology
Market Definition and Coverage
For this study, the particle counters market covers revenues earned from instruments that detect and count particles in air or liquids for contamination monitoring across controlled and critical environments.
Scope exclusions: Used or rental units, aftermarket spares, calibration services, and standalone lab services are not counted in the market value.
Segments Covered in This Report
- By Product Type
- Airborne Particle Counters
- Liquid Particle Counters
- Other Product Types
- By Application
- Cleanroom Monitoring
- Contamination Monitoring of Liquids
- Aerosol Monitoring and Research
- By Modality
- Benchtop
- Portable
- Remote
- By End User
- Pharmaceutical and Biotechnology Companies
- Clinical and Diagnostic Laboratories
- Academic and Research Institutes
- Other End Users
- Geography
- North America
- United States
- Canada
- Mexico
- Europe
- Germany
- United Kingdom
- France
- Italy
- Spain
- Rest of Europe
- Asia-Pacific
- China
- Japan
- India
- Australia
- South Korea
- Rest of Asia-Pacific
- Middle East & Africa
- GCC
- South Africa
- Rest of Middle East & Africa
- South America
- Brazil
- Argentina
- Rest of South America
- North America
Data Sources, Market Sizing, and Validation
Desk Research
Desk research helped us set the technical and demand context, then translate it into measurable signals. We referred to public quality and contamination-control references, such as ISO cleanroom standards and government GMP guidance, to identify where particle counting is treated as a required control point.
We also used public datasets and publications to sanity-check end-market direction, such as semiconductor output and investment releases, pharmaceutical manufacturing activity signals, and trade statistics that indicate movement of analytical and measurement instruments. Examples of sources include NIST publications, USP general chapters, FDA guidance pages, SEMI materials, and UN Comtrade trade tables, supported by company annual reports, investor presentations, and credible industry news. For company financials and patent trend checks, we also used approved paid subscriptions that provide standardized company intelligence and patent coverage. The sources listed are illustrative only, and many other public and paid references were used to collect data, validate it, and clarify open questions.
Primary Interviews and Surveys
Primary work focused on confirming what gets purchased, why units are replaced, and what drives the average selling price across different use settings. Interviews included instrument suppliers, channel partners, cleanroom operators, and quality leaders in pharma, biotech, and semiconductor fabs across APAC, EMEA, and the Americas, and the feedback was used to finalize adoption and upgrade assumptions.
Distribution of primary research fieldwork respondents
| Company type | Respondent position | Region |
|---|---|---|
| Top tier: 37% | CXOs: 18% | APAC: 48% |
| Mid tier: 45% | Functional/Unit leaders: 35% | EMEA: 31% |
| Smaller Players: 18% | Managers: 47% | Americas: 21% |
Market-Sizing & Forecasting
Market sizing was built using a top-down approach where demand pools were reconstructed from cleanroom and critical-process activity, then translated into instrument needs through practical adoption and replacement ratios. To keep totals realistic, we cross-checked the results with selective bottom-up views such as sampled ASP by device format (portable, benchtop, remote, inline) multiplied by estimated shipment bands, and adjusted the numbers when the two views did not align.
A few inputs that mattered in the model include cleanroom build-outs and expansions, semiconductor fab capacity additions, GMP compliance intensity in pharma manufacturing, typical calibration and replacement cycles for particle counters, and the mix shift between air and liquid monitoring needs. We also tracked how price points vary by channel, by form factor, and by required particle-size sensitivity, since that directly changes revenue even when unit demand is stable. For forecasting, we used scenario analysis anchored to expert views on capex cycles in semiconductors, new sterile capacity additions, and expected tightening of contamination-control practices. When bottom-up signals were missing for smaller regions or niche applications, we handled gaps through ratio-based scaling from better-observed regions, followed by interview re-checks before locking the final totals.
Data Validation & Update Cycle
Validation was done through multiple checks that look for unusual jumps, mismatched growth rates, and conflicts between regional totals and the global roll-up. Our team compared outputs against independent signals like cleanroom activity trends, manufacturing investments, and import-export direction for measurement instruments, and any outliers were reviewed again before sign-off.
If a variance could not be explained by a clear scope or timing factor, we re-contacted experts and updated the assumptions, then ran an internal review pass. Reports are refreshed annually, and interim updates are triggered when material events change demand expectations or pricing logic. Right before delivery, a final pass is completed to ensure the numbers reflect the latest available public indicators.
Mordor Intelligence's Particle Counters Market Estimate Compared With Other Published Estimates
Published market values for particle counters often do not match because groups draw the market line in different places, and they also use different base years and growth paths. Differences usually show up around whether services are counted, how air and liquid applications are bundled, and how pricing is moved over time.
Another driver is the way demand is tied back to real usage signals, such as cleanroom build-outs, fab investment cycles, and replacement timing, followed by how currency timing and annual refresh cycles are handled. When adjacent items like calibration, validation, or aftermarket spares are added to device revenue, the total moves up quickly, and that spread becomes more visible in faster-growth forecast stories used by some publishers, a scope choice applied by Mordor Intelligence.
Benchmark comparison
| Source | Market Size | Gaps in Research Methodology |
|---|---|---|
| Mordor Intelligence | USD 276.43 M (2026) | |
| Trade Journal A | USD 365.30 M (2021) | Uses an earlier base year and a faster growth track through 2031, and the stated segmentation suggests broader bundling across applications and formats, which can lift totals when adjacent measurement use cases are included. |
| Industry Bulletin B | USD 223.60 M (2023) | Starts from a smaller base-year value and appears to emphasize select applications and instrument categories, which can undercount total demand if broader cleanroom and critical-process deployments are not fully captured. |
The comparison shows that most gaps come from scope boundaries, base-year selection, and how pricing and growth are pushed forward. By keeping the model tied to device-only revenue and checking it against cleanroom and critical-process demand signals, the final value stays traceable to clear inputs and repeatable steps.
Key Questions Answered in the Report
What is the current valuation of the particle counters market?
The particle counters market size was USD 276.43 million in 2026 and is projected to reach USD 391.53 million by 2031.
Which segment is expanding the fastest?
Liquid particle counters are forecast to grow at 9.32% CAGR, outpacing all other product categories.
Why are remote particle counters gaining traction?
Annex 1 and ISO 14644 revisions mandate continuous monitoring, prompting facilities to adopt networked remote units that log data 24/7 and issue real-time alerts.
Which region offers the highest growth potential?
Asia-Pacific is projected to advance at an 8.18% CAGR, buoyed by semiconductor fabs, battery gigafactories, and expanding ambient air-quality networks.
How are vendors adding value beyond hardware sales?
Leaders now package calibration-as-a-service, AI-driven predictive maintenance, and cloud analytics to lock in recurring revenue and improve instrument uptime.