
Parking Management Market Size and Share
Market Overview
| Study Period | 2020 - 2031 |
|---|---|
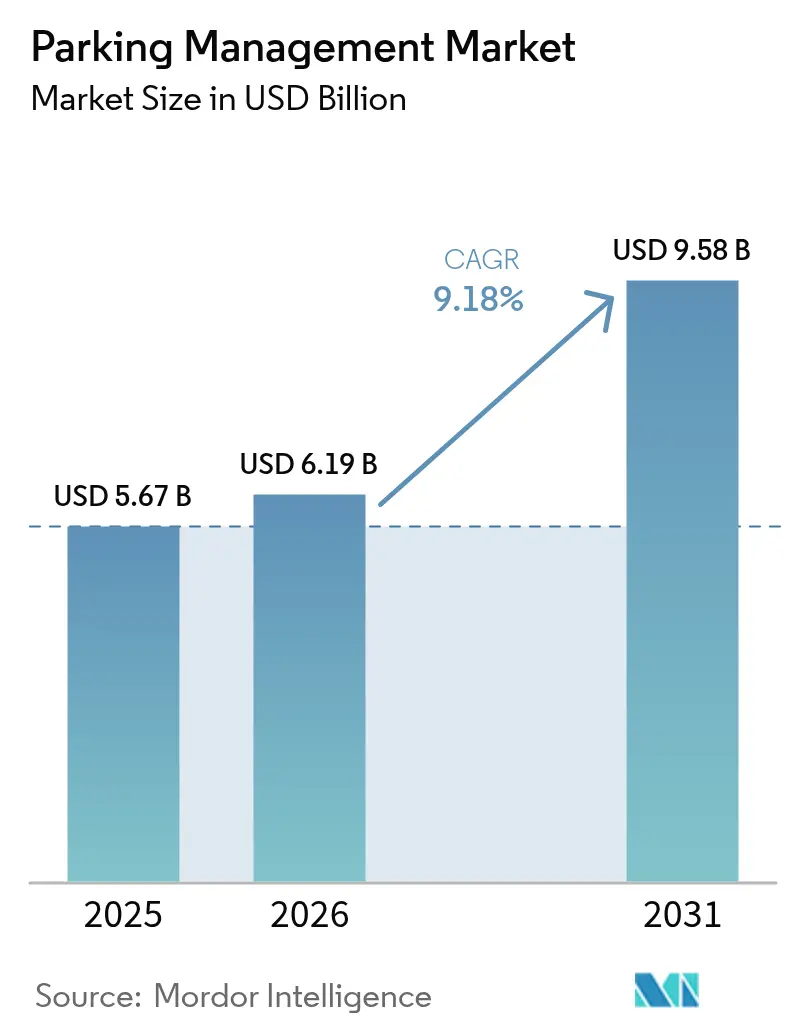
| Market Size (2026) | USD 6.19 Billion |
| Market Size (2031) | USD 9.58 Billion |
| Growth Rate (2026 - 2031) | 9.18% CAGR |
| Fastest Growing Market | Asia Pacific |
| Largest Market | North America |
| Market Concentration | Medium |
Major Players *Disclaimer: Major Players sorted in no particular order Image © Mordor Intelligence. Reuse requires attribution under CC BY 4.0. | |
Parking Management Market Analysis by Mordor Intelligence
The parking management market size was valued at USD 5.67 billion in 2025 and estimated to grow from USD 6.19 billion in 2026 to reach USD 9.58 billion by 2031, at a CAGR of 9.18% during the forecast period (2026-2031). Urban densification, dedicated smart-city funding, and the migration toward data-rich, cloud-based platforms are reshaping how cities, airports, and private operators monetize and regulate curb space.[1]Stephen Goldsmith, “Policy Change, Technology Key to Better Curb Management,” Government Technology, govtech.com Municipal digitization mandates in North America, national smart-city programs in Asia Pacific, and evolving EU sustainability targets collectively fuel demand for integrated solutions that pair license-plate recognition, dynamic pricing, and mobility-as-a-service (MaaS) capabilities. Hardware remains the largest revenue contributor, yet the fastest value creation now comes from analytics and managed services that turn occupancy data into operational intelligence. Competitive dynamics are shifting as infrastructure incumbents defend installed bases while AI-native entrants aggregate multi-site portfolios, often through high-profile acquisitions.
Key Report Takeaways
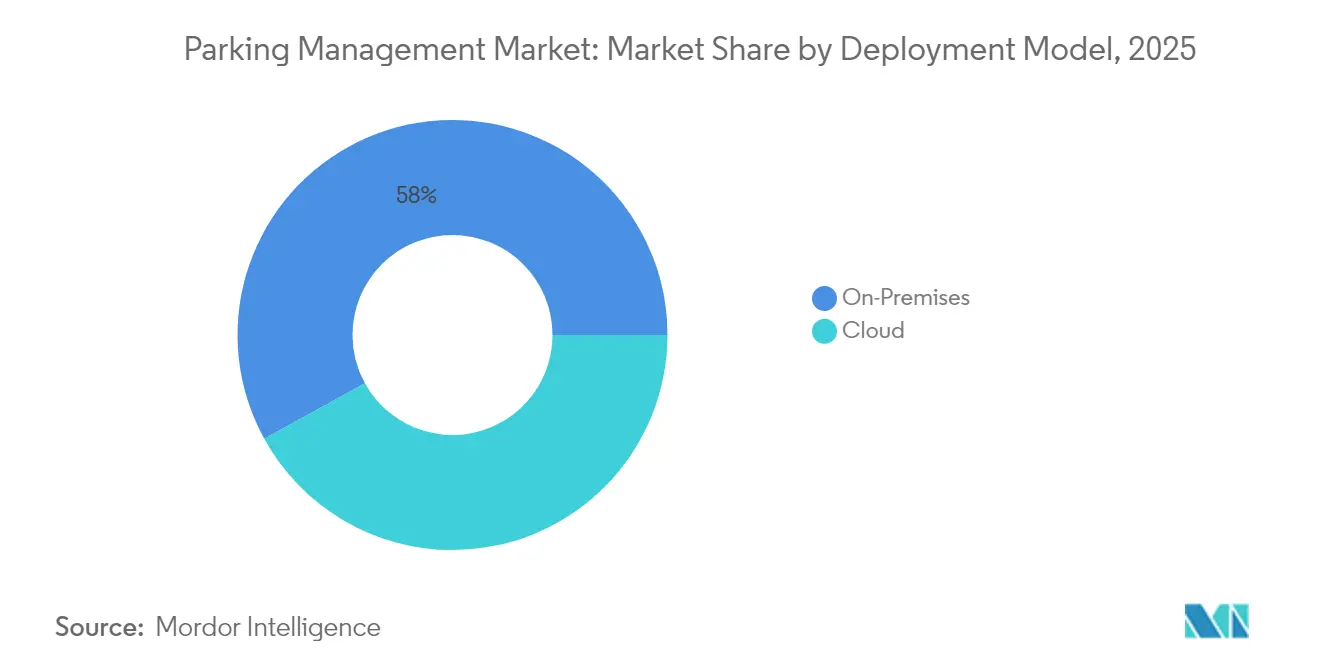
- By deployment model, on-premise systems led with 58.02% of parking management market share in 2025, while cloud platforms are forecast to expand at an 11.12% CAGR through 2031.
- By parking site, off-street facilities accounted for 61.57% of the parking management market size in 2025; on-street is advancing at an 11.28% CAGR to 2031.
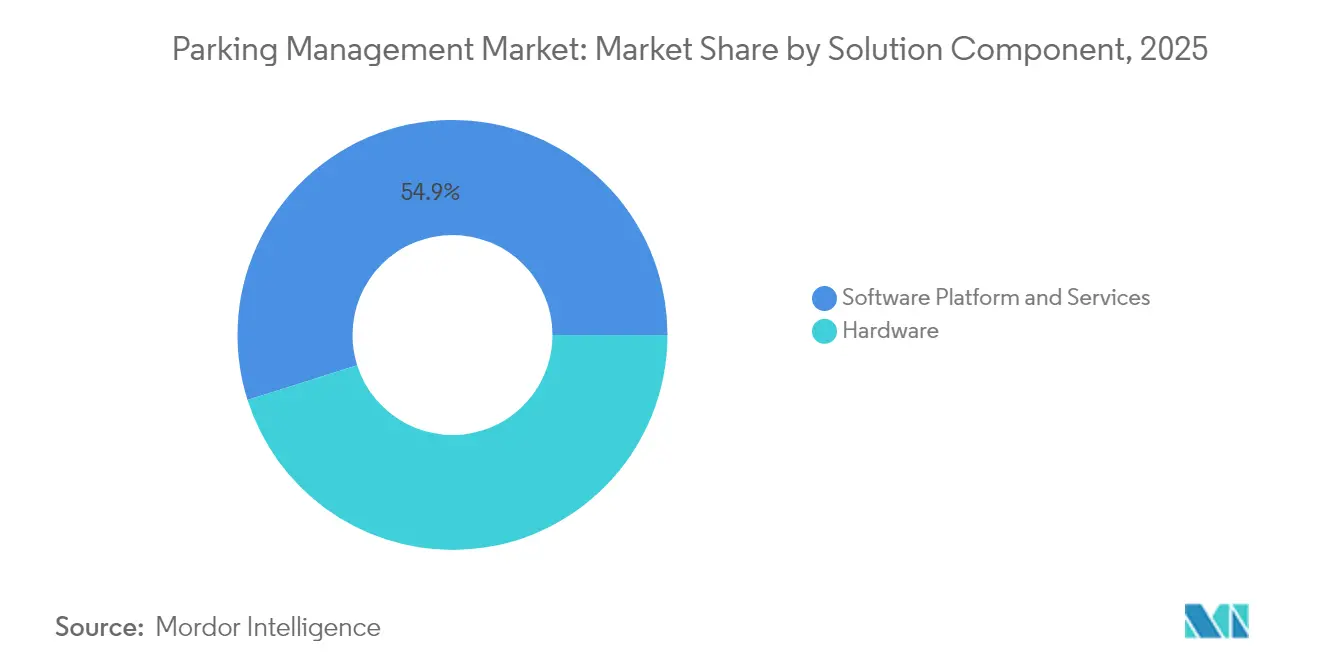
- By solution component, hardware captured 45.12% revenue share in 2025, whereas services represent the fastest-growing stream at a 10.41% CAGR to 2031.
- By end-user vertical, municipal and government operators held 36.31% revenue share in 2025; transit and airports are poised for a 9.66% CAGR through 2031.
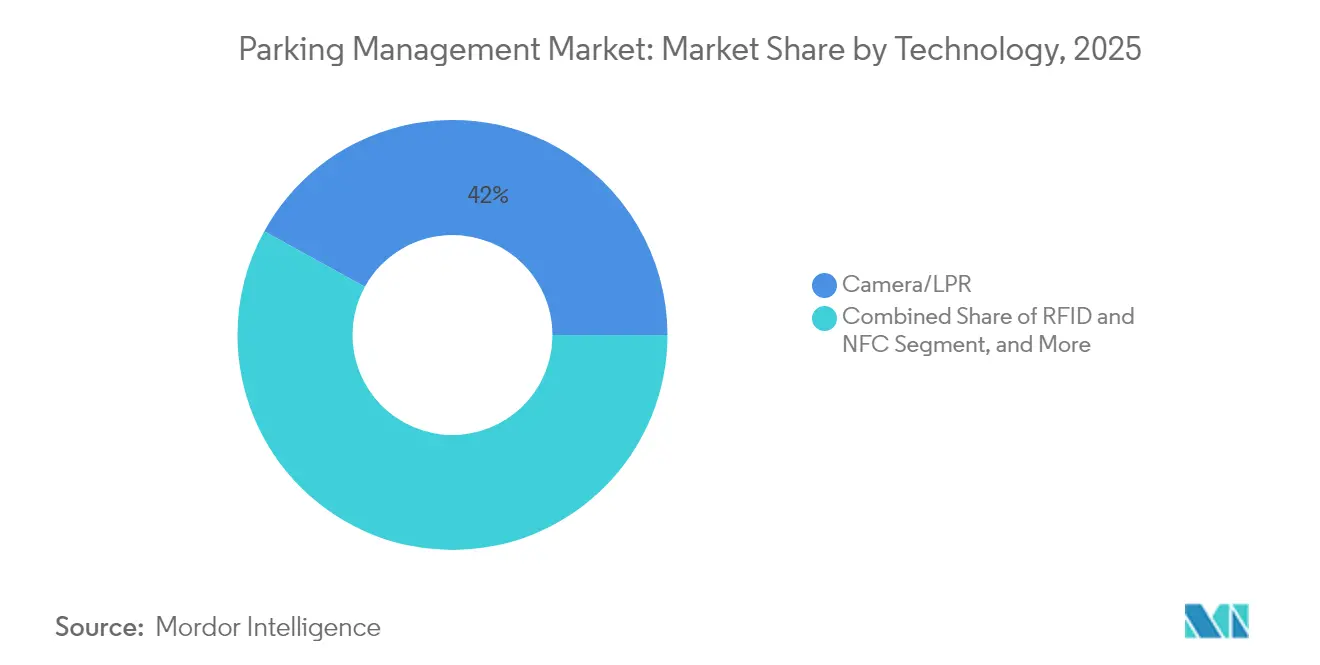
- By technology, camera and license-plate recognition dominated with 41.98% share of parking management market size in 2025, but mobile-app and Bluetooth solutions are rising at a 9.98% CAGR to 2031.
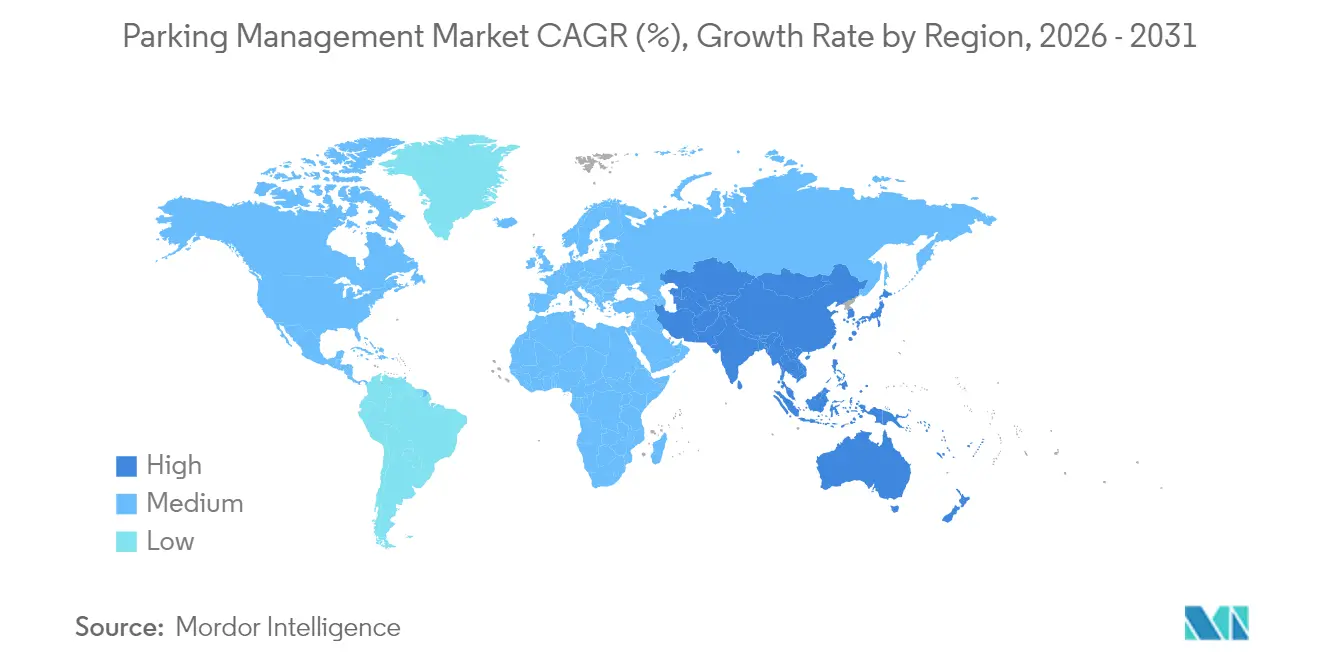
- By geography, North America commanded 38.96% revenue share in 2025, whereas Asia Pacific is projected to record a 9.78% CAGR through 2031.
Note: Market size and forecast figures in this report are generated using Mordor Intelligence’s proprietary estimation framework, updated with the latest available data and insights as of 2026.
Global Parking Management Market Trends and Insights
Drivers Impact Analysis*
| Driver | (~) % Impact on CAGR Forecast | Geographic Relevance | Impact Timeline |
|---|---|---|---|
| Urban traffic congestion mitigation | +2.1% | Global, with peak impact in North America and APAC megacities | Medium term (2-4 years) |
| Smart-city funding for intelligent transport systems | +1.8% | North America and EU leading, APAC core following | Long term (≥ 4 years) |
| Cloud-native parking-as-a-service adoption | +1.6% | Global, with early adoption in North America | Short term (≤ 2 years) |
| Mobile payment and digital ticketing penetration | +1.4% | Global, accelerated in APAC and North America | Short term (≤ 2 years) |
| MaaS-driven dynamic curb-pricing integration | +1.2% | EU and North America core, spill-over to APAC | Medium term (2-4 years) |
| Real-estate REIT monetisation of parking assets | +0.9% | North America and EU, with emerging interest in APAC | Long term (≥ 4 years) |
| Source: Mordor Intelligence | |||
Urban Traffic Congestion Mitigation
Dynamic curb management programs demonstrate how parking can reduce vehicle circling and greenhouse-gas emissions. San Francisco’s SF Park recalibrates rates every six weeks to maintain 85% occupancy, producing documented 30% reductions in search traffic within pilot zones. Similar sensor-based deployments in Portland and Hoboken showcase transferable playbooks for mid-sized cities that lack the resources for bespoke research. Municipal agencies now position parking APIs alongside transit feeds, allowing navigation apps to direct drivers to the lowest-cost bay in real time. The approach reframes parking fees from static taxes to behavior-modifying levers that re-balance peak-hour loads. Emerging congestion-pricing proposals in Los Angeles and Singapore further elevate the role of parking data as an enforcement backbone.
Smart-City Funding for Intelligent Transport Systems
Dedicated federal and supra-national grants are lowering adoption risk for cash-strapped municipalities. In the United States, the Federal Highway Administration earmarked USD 2.3 billion through 2026 for 5G-enabled roadway and parking systems, with disbursements contingent on open-architecture and cybersecurity compliance.[2]Jason Carnes, “5G Impacts to Vehicles and Highway Infrastructure,” Federal Highway Administration, dhs.gov European cities tap into Horizon Europe funds to pilot curb-side EV-charging combined with automated parking guidance. Long-cycle capital unlocks multi-agency projects that fuse parking occupancy, traffic-signal timing, and public-transit arrival data into a single urban-mobility dashboard. Because eligibility criteria require interoperability, vendors that support standardized APIs gain a structural advantage when bids are scored.
Cloud-Native Parking-as-a-Service Adoption
Cloud migration compresses deployment windows and slashes upkeep costs by 40-60% relative to on-premise servers, according to operator case studies. Subscription bundles from providers such as SKIDATA include continuous security patches, AI-based fraud detection, and one-click tariff changes across multi-city portfolios. Centralized hosting also eases GDPR and PCI-DSS 4.0 compliance, enabling even small garages to meet enterprise-grade encryption benchmarks. As new mobility modes—from micromobility docks to autonomous-vehicle staging zones, surface, a cloud back end becomes the only practical way to coordinate asset status across thousands of edge devices.
Mobile Payment and Digital Ticketing Penetration
Seamless in-app checkout has shifted from convenience to baseline expectation in the parking management market. The Universal Plug and Charge protocol illustrates the convergence of EV charging, parking access, and payment authentication in a single handshake. Automakers embed parking APIs in infotainment stacks; 77% of Chinese drivers now demand such integration in connected vehicles. Operators report 20% revenue lifts after migrating from cash kiosks to contactless QR and NFC flows, due primarily to lower transaction friction and richer loyalty analytics. Digital receipts facilitate corporate expensing, further broadening the addressable user base.
Restraints Impact Analysis*
| Restraint | (~) % Impact on CAGR Forecast | Geographic Relevance | Impact Timeline |
|---|---|---|---|
| Cyber-security and data-privacy vulnerabilities | -1.7% | Global, with stricter enforcement in EU and California | Short term (≤ 2 years) |
| High CAPEX and legacy-system integration complexity | -1.3% | North America and EU legacy infrastructure, emerging markets less affected | Medium term (2-4 years) |
| Equity backlash against dynamic pricing | -0.8% | North America and EU urban centers, with spillover to APAC | Medium term (2-4 years) |
| Lack of interoperability standards (vendor lock-in) | -0.6% | Global, with particular impact in fragmented municipal markets | Long term (≥ 4 years) |
| Source: Mordor Intelligence | |||
Cyber-Security and Data-Privacy Vulnerabilities
Mandatory migration to PCI-DSS 4.0 after April 2024 exposed security gaps at facilities still running decade-old controllers. Breaches of license-plate databases in California and the Netherlands amplified public scrutiny, prompting regulators to widen audit scopes to include anonymization protocols. Large platforms responded by embedding zero-trust architectures and partnering with specialist security firms, but smaller garages struggle to fund continual penetration testing. EU proposals to classify curb-management data as “high-risk AI processing” may add algorithmic-transparency requirements that further stretch compliance budgets.
High CAPEX and Legacy-System Integration Complexity
Brownfield garages often require demolition of ticket dispensers and loop detectors before optical recognition can be installed, pushing per-facility upgrade costs above USD 50,000 for mid-tier assets. Flash Parking’s USD 85 million special-purpose vehicle offers lease-to-own packages that bundle equipment, software, and servicing fees, yet uptake remains uneven among municipal operators constrained by multiyear procurement cycles. Integration bottlenecks also arise when aligning numerous proprietary firmware versions, delaying rollout schedules and prolonging staff retraining periods.
*Our forecasts treat driver/restraint impacts as directional, not additive. The impact forecasts reflect baseline growth, mix effects, and variable interactions.
Segment Analysis
By Deployment Model: Cloud Acceleration Despite On-Premises Dominance
The parking management market size for on-premise systems reached USD 3.29 billion in 2025, translating into a 58.02% revenue share. Operators value on-premise control for mission-critical gateways where sub-basement cellular signals remain unreliable. Even so, cloud-native offerings are expanding at an 11.12% CAGR as metropolitan Wi-Fi and private-LTE backbones mature. Cross-site dashboards allow portfolio owners to adjust tariffs globally with a single rule set, and automated disaster-recovery protocols minimize downtime risk.
Cloud adoption strengthens recurring-revenue visibility for vendors and stabilizes cash flows for asset owners via subscription OPEX rather than lumpy CAPEX. Because software patches roll out centrally, vulnerability windows shrink, aligning with PCI-DSS 4.0 audit cycles. Cloud architectures also simplify MaaS integrations, letting third-party apps conduct tokenized reservations without exposing garage networks. As a result, the parking management market sees a progressive blending of hybrid deployments where local gateways cache transactions but sync to cloud analytics.


By Parking Site: Off-Street Leadership with On-Street Growth Momentum
Off-street facilities generated USD 3.49 billion in revenue in 2025, underpinned by stable demand at airports, hospitals, and multi-tenant retail complexes. This accounted for 61.57% of the parking management market share. Yet on-street deployments show superior expansion, rising at an 11.28% CAGR on the back of digital curb-management ordinances in cities such as Birmingham and Guelph.
The on-street advance reflects a policy pivot that treats curb space as a multimodal asset. Real-time dashboards dispatch enforcement patrols only when sensors flag overstays, cutting overtime costs by 18%. Contactless meters and pay-by-plate apps lower cash-handling security risks, while variable rates raise turnover, boosting surrounding retail footfall. Vendors that offer integrated citation workflows and open-data feeds gain mindshare among planners seeking end-to-end transparency.
By Solution Component: Hardware Foundation with Services Acceleration
Hardware commanded USD 2.56 billion of parking management market size in 2025, covering cameras, gateways, and payment kiosks. Although capex-heavy, hardware establishes the data pipeline that software monetizes. Services—implementation, managed operations, and analytics consulting—posted the strongest growth at 10.41% CAGR as operators outsource complexity.
Outcome-based service contracts tie vendor remuneration to KPIs such as occupancy utilization and compliance uplift. Advanced IoT deployments with automated license-plate recognition have yielded 30% fewer billing disputes and 20% incremental revenue, validating the premium on expert configuration. Vendors embed AI models that forecast demand and propose tariff tweaks, nudging garages toward revenue-optimization paradigms long embraced in airline yield management.
By End-User Vertical: Municipal Leadership with Transit Growth
Municipal and government operators held USD 2.06 billion in revenue during 2025, equivalent to 36.31% share. City councils view parking data as a linchpin for emissions mitigation and street-design reform. Conversely, transit hubs and airports, although smaller today, are growing at a 9.66% CAGR as passenger-experience metrics elevate parking convenience to a competitive differentiator.
Airports now bundle curb reservations with flight-status alerts, shrinking average dwell times and freeing curb space for rideshare pick-ups. Some hubs integrate parking loyalty points redeemable for lounge access, creating ancillary revenue synergies. Rail operators retrofit park-and-ride lots with solar canopies and fast chargers, positioning parking assets as renewable micro-grids that offset traction-power needs.
By Technology: Camera/LPR Dominance with Mobile Innovation
Camera and license-plate recognition platforms represented 41.98% of 2025 revenue, anchoring automated entry, audit, and enforcement flows. Edge AI reduces false positives, allowing gateless “free-flow” garages to invoice vehicles post-exit, mirroring tolling paradigms. Mobile-app and Bluetooth credentials, however, are the fastest-rising category at a 9.98% CAGR as users gravitate toward access methods resident in smartphones and in-dash systems.
Sensor fusion is the next milestone: integrating LPR, ultrasonic stall counters, and BLE beacons provides redundant validation layers that enhance fraud detection and accessibility mapping. ISO 15118 vehicle-to-grid standards promise bidirectional authentication between EVs and parking infrastructure, enabling automated valet charging and dynamic energy-pricing participation.
Geography Analysis
North America retained 38.96% of global revenue in 2025, reflecting mature digitization mandates and early adoption of dynamic pricing. Municipalities leverage open-data policies that compel vendors to expose occupancy APIs, spurring third-party innovation in navigation and curb-delivery routing. PCI-DSS 4.0 enforcement and California Consumer Privacy Act amendments drive demand for tamper-resistant architectures. Operators deploy AI vision to remove gates, cutting average ingress times by 40% and elevating user satisfaction scores.
Asia Pacific follows a different trajectory, posting the fastest regional CAGR at 9.78%. Rapid urbanization in China, Japan, and South Korea creates acute land-use pressures, making efficient curb allocation a policy imperative. National smart-city blueprints fund sensor grids and 5G backbones that lower latency for cloud guidance. Automakers integrate Parkopedia feeds into dashboards, and QR payments embedded in super-apps normalize contactless parking even in tier-three cities. The region’s consumer tech literacy accelerates adoption curves, compressing time-to-scale for pilot solutions.
Europe balances data-privacy rigor with sustainability objectives. Revised GDPR cross-border transfer clauses in 2025 require data-localization or approved contractual mechanisms, leading many operators to choose regional cloud zones. EU Green Deal legislation links curb policy to modal-shift targets, incentivizing spaces reserved for micro-mobility docks and EV charging. Dynamic-pricing pilots in Stockholm and Madrid tie tariffs to emission classes, nudging fleets toward cleaner vehicles. While market growth is moderate, regulatory clarity supports vendor investment certainty.
South America and the Middle East and Africa remain emergent but increasingly visible in expansion roadmaps. São Paulo integrates parking sensors with flood-alert networks to reroute traffic during monsoon events, while Dubai positions smart-parking concessions as part of a “paperless government” strategy. Although project counts are lower, greenfield builds allow leapfrogging directly to cloud architectures without legacy constraints.

Regulatory Landscape
Compliance requirements for parking management are increasingly shaped by payment security, privacy, and interoperability mandates that affect both municipal curb programs and private operators. PCI-DSS 4.0 enforcement from April 2024 has pushed operators to modernize payment flows and harden connected kiosk and back-end environments. Privacy rules such as the California Consumer Privacy Act (CCPA) and Europe’s GDPR also influence how license-plate data, vehicle images, and user identifiers are collected, stored, and shared across platforms.
Policy design is further steering technology choices in on-street digitization. In California, SB-532 enables mobile-device-only payment zones in specified cities if an equitable cash payment plan is adopted, alongside required evaluations that address equity and privacy impacts. Interoperability is reinforced through standards and frameworks used by vendors and cities, including ISO data and traffic information specifications (for example, ISO/TS 5206-1:2023 and ISO 21219-14:2023), and the EU’s Delegated Regulation 885/2013 that targets continuity and interoperability for information services around safe and secure truck parking, supporting cross-operator data exchange and consistent end-user services.
Competitive Landscape
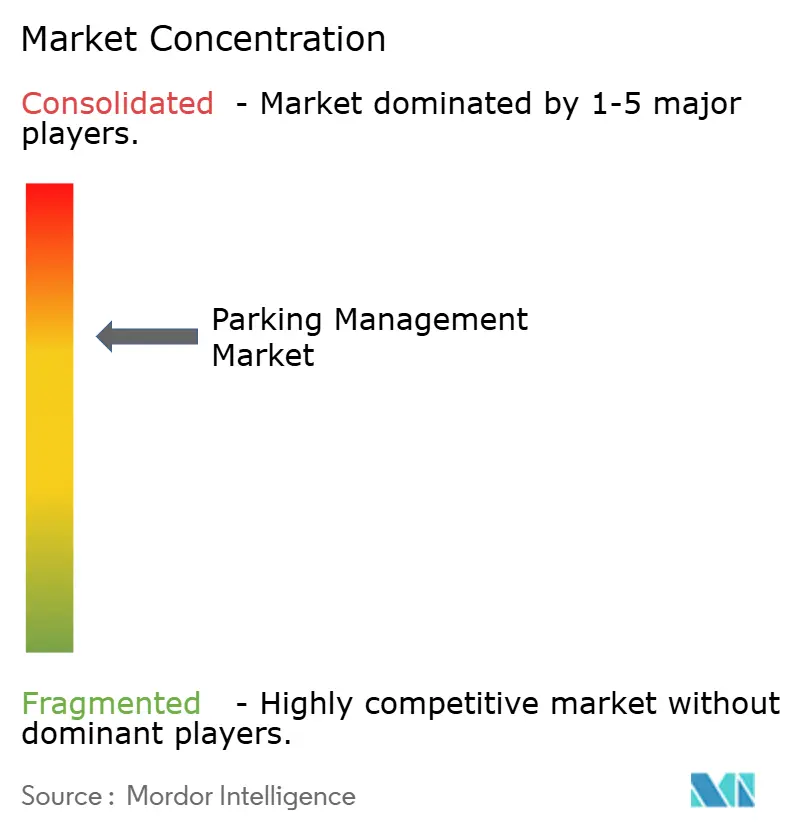
Competition in the parking management market skews toward mid-level concentration. Infrastructure stalwarts such as SKIDATA, Flowbird, and Scheidt & Bachmann safeguard entrenched hardware footprints, offering modular upgrades to defend share. AI-native disruptors like Metropolis and Peter Park leverage computer vision and cloud orchestration to win greenfield urban-lot contracts. The strategic nature of curb data pushes vendors to ally rather than pursue stand-alone growth: EasyPark’s 2025 acquisition of Flowbird forged a hybrid powerhouse spanning mobile payments and terminal hardware.[4]EasyPark Group, “EasyPark Group Closes Acquisition of Flowbird,” easyparkgroup.com
Value-chain convergence continues. Bosch’s automated valet charging demonstration at CES 2024 marries parking and energy-management domains, opening revenue streams from vehicle-to-grid services. Flash Parking’s integration with Google Maps and Waze injects real-time bay availability into mainstream navigation, amplifying network effects. Vendors differentiate through compliance posture; those meeting PCI-DSS 4.0 and ISO 27001 benchmarks outpace rivals in public-sector tenders.
Capital deployment favors scalability plays: Metropolis used a USD 1.8 billion war chest to acquire SP Plus and instantly double its footprint to 4,000 locations. PE-backed roll-ups accelerate consolidation, yet local integrators retain niches by offering hyper-custom signage and zoning-code expertise. On balance, the top five companies control roughly 55% of revenue, indicating moderate concentration that leaves room for regional specialists.
Parking Management Industry Leaders
Amano McGann Inc.
TIBA Parking Systems (FAAC SpA)
FlashParking Inc.
Passport Labs Inc.
Flowbird Group SAS
- *Disclaimer: Major Players sorted in no particular order

Market Opportunities and Future Outlook
Municipal digitization of curb and parking programs continues to create whitespace for vendors that can unify payments, enforcement, and policy controls while meeting equity and privacy constraints. A concrete example is Rio de Janeiro’s Rio Rotativo Digital, where the city regulated the app-based system and launched a pilot on July 17, 2026 across seven areas. The program indicates active procurement and operational change management around digital permitting, compliance workflows, and user payments. California’s legislative pathway for enhanced curb management (SB-1292) also explicitly authorizes specified cities to implement image-based enforcement and automated payment mechanisms through January 1, 2032, which favors platforms that combine computer vision, evidence management, and auditable retention policies.
Operator and developer-led deployments offer another route to multi-site scaling, particularly when automated number plate recognition and cloud orchestration reduce friction for mixed-use districts. In July 2026, Dubai-based Parkin partnered with Arada to implement smart parking with automated number plate recognition at the Aljada development in Sharjah, highlighting demand from master-planned communities for integrated access, guidance, and enforcement. Platform convergence is also visible in payments and enforcement combinations: Arrive’s July 2026 announced intent to acquire Passport underscores a consolidation theme around single-platform experiences for on-street and off-street assets, with associated integration opportunities for LPR, mobile payments, and managed services that connect municipal rules to operator operations.
Recent Industry Developments
- March 2026: Amano Corporation reported that its parking management contract service business increased managed sites by 33,000 units (4.2%) versus the prior fiscal year end. The disclosure points to continued expansion in recurring contract operations, supporting wider adoption of managed services and centralized operational tooling across larger parking portfolios.
- February 2026: TIBA Parking Systems announced an expanded strategic partnership with Precision Technology Solutions, naming it the primary service and sales support partner across the US Northeast and Mid-Atlantic, effective March 2, 2026. The agreement strengthens regional coverage for installation and after-sales support, which is important for uptime and lifecycle service revenue in hardware-heavy deployments.
- February 2025: Amano Corporation implemented Digital Garage, Inc. integrated QR code payment solution Cloud Pay into its GT-4200 cashless parking payment machine. The integration reflects continued productization of contactless and QR payment methods at the device layer, helping operators modernize payment acceptance while aligning with heightened payment-security and audit requirements.


Research Methodology Framework and Report Scope
Market Definition and Coverage
This market covers the revenue generated from parking management solutions used to monitor, control, and monetize parking spaces across on-street and off-street locations, including the related software, supporting hardware, and services that keep daily operations running.
Scope exclusions: We exclude standalone real estate construction of parking facilities and land ownership value, unless it is bundled into a parking management solution sale or service contract.
Segmentation Overview
- By Deployment Model
- On-premises
- Cloud-based
- By Parking Site
- Off-street
- On-street
- By Solution Component
- Hardware (Meters, Sensors, Cameras, LPR, Kiosks)
- Software Platform
- Services (Installation, Managed, Consulting)
- By End-User Vertical
- Municipal and Government
- Commercial Off-street Operators
- Transit and Airports
- Hospitality and Retail
- Healthcare and Universities
- Other End-User Verticals
- By Technology
- Sensor-based (ultrasonic, magnetometer)
- Camera / LPR-based
- Mobile-app and Bluetooth
- RFID and NFC
- Geography
- North America
- United States
- Canada
- Mexico
- Europe
- United Kingdom
- Germany
- France
- Italy
- Rest of Europe
- Asia Pacific
- China
- India
- Japan
- South Korea
- Rest of Asia Pacific
- South America
- Brazil
- Argentina
- Rest of South America
- Middle East and Africa
- Middle East
- United Arab Emirates
- Saudi Arabia
- Turkey
- Rest of Middle East
- Africa
- South Africa
- Egypt
- Rest of Africa
- Middle East
- North America
Data Sources, Market Sizing, and Validation
Desk Research
To build the starting fact base, we first reviewed public, non-paywalled references that describe how parking supply and demand move over time. This included sources such as US DOT and FHWA mobility and parking-related publications, city transportation and curb management portals, Eurostat urban transport indicators, and UN Habitat city statistics where available. We also used standards and guidance notes from groups such as ITE and IEEE to understand how systems are deployed and maintained.
On the commercial side, we cross-checked market activity using company annual reports, investor presentations, press releases, and procurement portals that publish awarded tenders. For select markets, shipment-led signals were sanity checked using an import and export shipment-level database, and patent database scans were used to understand solution evolution (for example, plate recognition and payment workflows). These sources are not exhaustive, and many other public documents were reviewed to collect inputs, validate assumptions, and clear up gaps found during analysis.
Primary Interviews and Surveys
Next, we validated the model with expert interviews and structured surveys across solution providers, system integrators, parking operators, and end users such as municipalities and large commercial facilities. Respondent input helped clarify adoption pace, pricing logic, and site-level operational constraints, and it also highlighted where desk sources were thin for specific geographies. We gathered inputs across major regions so adoption pace, pricing, and operating realities could be compared, and then used to tighten assumptions where needed.
Distribution of primary research fieldwork respondents
| Company type | Respondent position | Region |
|---|---|---|
| Top tier: 33% | CXOs: 18% | APAC: 42% |
| Mid tier: 46% | Functional/Unit leaders: 35% | EMEA: 32% |
| Smaller Players: 21% | Managers: 47% | Americas: 26% |
Market-Sizing & Forecasting
Sizing starts with a top-down build that reconstructs the demand pool by linking urban vehicle growth, parking space utilization patterns, and smart-city spending signals to likely adoption of managed parking systems. Once that path is set, it is corroborated using selective bottom-up checks such as sampled average selling price ranges for software and services, typical deployment volumes by site type (on-street corridors versus garages), and channel checks on replacement and upgrade cycles.
For market inputs, we leaned on a small set of fingerprints that can be consistently tracked: number of registered vehicles and urbanization rates, paid parking penetration in core city areas, parking occupancy and turnover assumptions by site type, share of cloud-based deployments versus on-premises, and typical service attach rates for support and maintenance. Where hard numbers were missing for smaller countries, proxy indicators were used (for example, city population tiers and public mobility budgets), and those gaps were then calibrated back to expert feedback so the totals stay realistic.
Forecasts were built using scenario analysis supported by trend lines in the above variables, and the final growth path was adjusted only when multiple interviewees pointed to a clear change in regulation, enforcement intensity, or payment digitization that would move adoption faster or slower.
Data Validation & Update Cycle
Each major output is checked against independent signals, such as smart-city program rollouts, tender volumes for parking technology, and the expected split between on-street and off-street revenue pools. When a region shows an unusual jump, the assumptions are reviewed, outliers are flagged, and follow-up calls are triggered with the same respondent types to confirm if a real market event explains the change.
Before sign-off, the model goes through multi-step internal reviews so unit logic, currency conversions, and growth rates are consistent across regions and solution components. Reports are refreshed annually, and interim updates are made when material events occur, followed by a final pre-delivery pass so clients receive the latest updated view.
Mordor Intelligence's Parking Management Market Size Compared Against Other Published Estimates
Published market values for parking management do not always match because firms often start from different revenue pools and then apply different adoption and pricing assumptions. Differences also show up when one estimate uses an older base year, a different inflation view, or a different way of converting local revenues into USD.
Hardware that is sold purely as stand-alone access equipment without an accompanying management platform or recurring service is kept outside Mordor Intelligence's scope, which is one practical reason the 2026 value can look higher or lower than figures that bundle wider parking equipment sales. In addition, some estimates apply aggressive growth by assuming rapid citywide rollouts everywhere, while our forecast path is anchored to observed procurement cycles, cloud migration pace, and service attach rates that operators said are feasible.
Benchmark comparison
| Source | Market Size | Gaps in Research Methodology |
|---|---|---|
| Mordor Intelligence | USD 6.19 B (2026) | |
| Global Consultancy A | USD 4.88 B (2024) | Uses an earlier stated year and may treat the market mainly as software and service revenue, which can undercount hardware-led deployments and newer cloud transitions captured in later-year builds. |
| Industry Publisher B | USD 5.11 B (2025) | Anchors estimates to a different base year and forecast window, and the component split can differ depending on whether implementation and support services are fully counted across on-street and off-street sites. |
The table shows that the spread is largely explained by year selection and what gets counted as parking management revenue versus adjacent equipment sales. By tying the totals to repeatable variables like paid parking penetration, deployment mix, and service attach rates, we can keep the market size traceable and easier to reconcile during client discussions.


Key Questions Answered in the Report
How large is the parking management market in 2026?
The parking management market size stood at USD 6.19 billion in 2026, backed by smart-city investments and digital payment adoption.
What is the forecast CAGR for parking management solutions through 2031?
Revenue is projected to rise at a 9.18% CAGR, taking the market to USD 9.58 billion by 2031.
Which deployment model is growing fastest?
Cloud-based platforms are expanding at an 11.12% CAGR as operators migrate to scalable, centrally managed solutions.
Which region shows the strongest growth momentum?
Asia Pacific is the fastest-growing region with a 9.78% CAGR, propelled by rapid urbanization and government smart-city programs.
What technology currently dominates parking operations?
Camera and license-plate recognition systems hold 41.98% revenue share, forming the backbone of automated access and billing.
Page last updated on:


