
Market Overview
| Study Period | 2020 - 2031 |
|---|---|
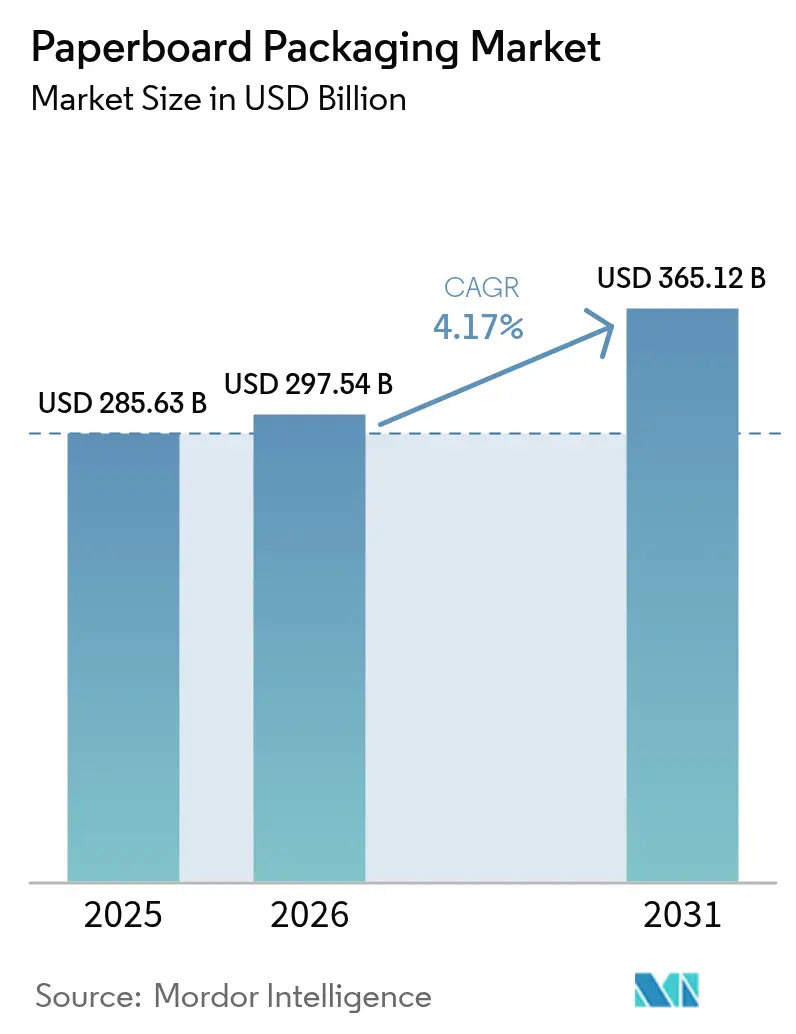
| Market Size (2026) | USD 297.54 Billion |
| Market Size (2031) | USD 365.12 Billion |
| Growth Rate (2026 - 2031) | 4.17 % |
| Fastest Growing Market | Asia Pacific |
| Largest Market | North America |
| Market Concentration | Medium |
Major Players *Disclaimer: Major Players sorted in no particular order Image © Mordor Intelligence. Reuse requires attribution under CC BY 4.0. | |
Paperboard Packaging Market Analysis by Mordor Intelligence
The Paperboard Packaging market size is expected to grow from USD 285.63 billion in 2025 to USD 297.54 billion in 2026 and is forecast to reach USD 365.12 billion by 2031 at 4.17% CAGR over 2026-2031.
Rising e-commerce volumes, regulatory momentum favoring fiber over plastic, and continuous improvements in lightweighting and digital converting technologies collectively propel expansion. Recycled fiber’s strong cost-to-performance profile complements retailer commitments to circular supply chains, sustaining demand despite raw-material cost swings. Corrugated formats remain the backbone of fulfillment networks, while folding cartons gain ground in premium consumer categories. Market participants counter mounting energy and recovered-paper price volatility by investing in vertical integration and pulp capacity in low-cost forestry regions.
Key Report Takeaways
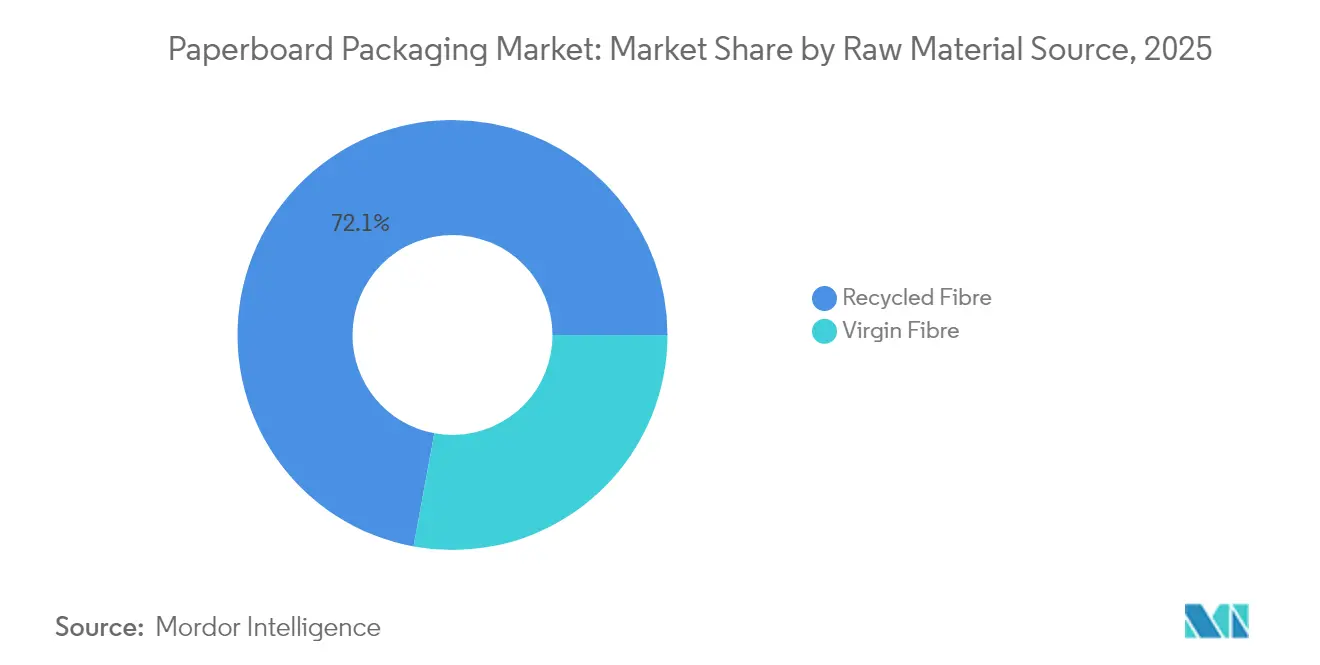
- By raw-material source, recycled fiber held 72.10% of the paperboard packaging market share in 2025, forecast to expand at a 6.65% CAGR to 2031.
- By product type, corrugated boxes led with 42.10% revenue share in 2025, while folding cartons are forecast to expand at a 5.55% CAGR to 2031.
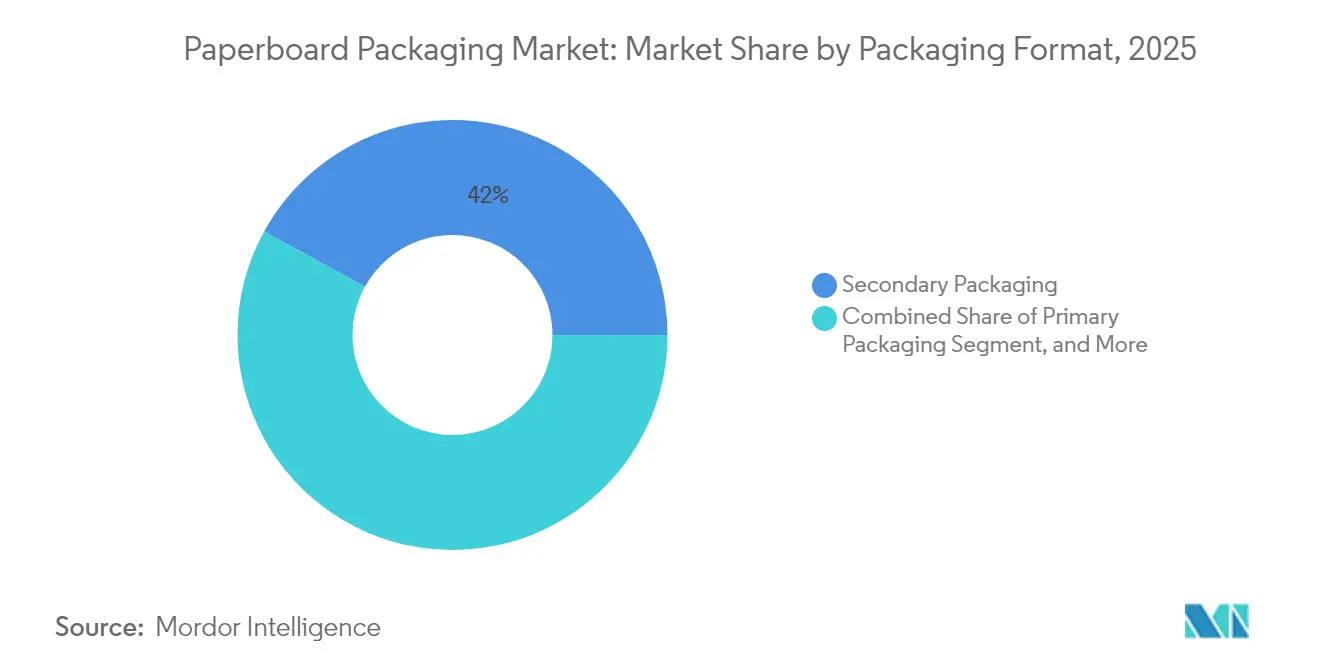
- By packaging format, secondary packaging accounted for 42.00% of the paperboard packaging market size in 2025 and is growing at a 4.95% CAGR through 2031.
- By end-user industry, personal care and cosmetics is advancing at a 5.90% CAGR through 2031, outpacing the food segment that retained a 28.10% revenue share in 2025.
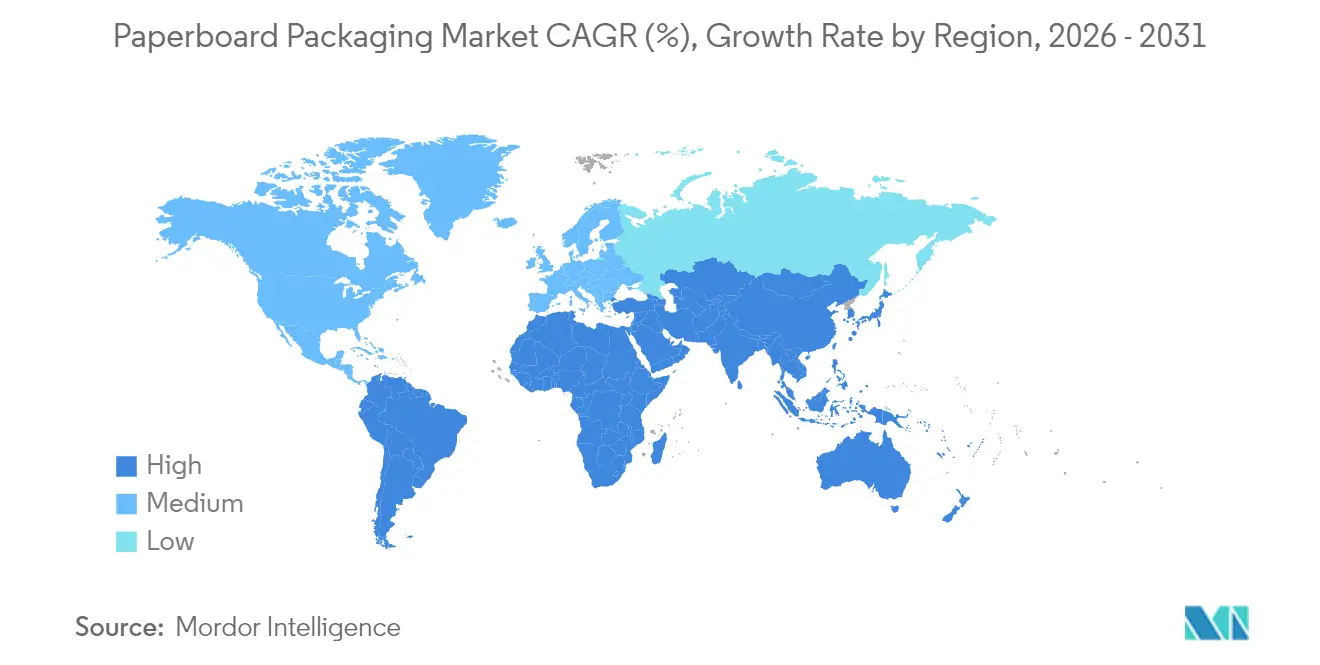
- By Geography, Asia-Pacific is projected to post the fastest 6.78% CAGR to 2031, whereas North America commanded a 38.55% revenue share in 2025.
Note: Market size and forecast figures in this report are generated using Mordor Intelligence’s proprietary estimation framework, updated with the latest available data and insights as of 2026.
Market Trends and Insights
Drivers Impact Analysis of Paperboard Packaging Market*
| Driver | (~) % Impact on CAGR Forecast | Geographic Relevance | Impact Timeline |
|---|---|---|---|
| E-commerce surge boosting corrugated-shipping demand | +1.8% | Global (North America and Asia-Pacific focus) | Short term (≤ 2 years) |
| Plastic-substitution regulations favor fiber packaging | +0.5% | Europe and North America, spreading to Asia-Pacific | Medium term (2-4 years) |
| Light-weighting innovations lowering logistics cost | +0.7% | Global (early adoption in developed markets) | Medium term (2-4 years) |
| Rapid growth of packaged food and beverages in the Asia-Pacific | +1.2% | Asia-Pacific core, spill-over to Middle East and Africa | Long term (≥ 4 years) |
| AI-enabled on-demand custom printing | +0.8% | North America and Europe, expanding globally | Long term (≥ 4 years) |
| LatAm eucalyptus pulp boom lowering virgin-fibre cost | +0.6% | Global supply impact, with regional production in South America | Medium term (2-4 years) |
| Source: Mordor Intelligence | |||


E-commerce Surge Boosting Corrugated-Shipping Demand
Online retail penetration requires stronger, dimension-optimized shipping containers that withstand multiple touchpoints. Box producers captured surging orders by pairing high-performance flute profiles with real-time design tools that tailor packaging to SKU geometry. Packaging Corporation of America’s USD 70-per-ton price increase in early 2025 illustrated a tight demand-supply balance. Direct-to-consumer models further reinforce the need for branding space on outer packs, incentivizing converters to integrate high-graphics digital print modules. Smart-label technologies supporting location and shock monitoring now ship on corrugated liners, creating value beyond protection.
Plastic-Substitution Regulations Favor Fiber Packaging
The European Union’s Packaging and Packaging Waste Regulation mandates 90% recyclability by 2030, accelerating the shift from multilayer plastics toward recyclable fiber formats.[1]European Union, “Packaging and Packaging Waste Regulation,” eur-lex.europa.eu North American states replicate extended-producer-responsibility frameworks, while several Asia-Pacific markets draft similar statutes. Producers respond with dispersion-based barrier coatings and PFAS-free grease-proof chemistries that safeguard food while maintaining repulpability. Brand owners leverage these solutions to meet public sustainability pledges and evade upcoming plastic taxes.
Light-Weighting Innovations Lowering Logistics Cost
Micro-fluting, enhanced fiber orientation, and nanocellulose coatings cut board grammage by 15-20% without sacrificing stacking strength. Mill trials by Sappi confirm double-digit truckload-volume gains that translate into freight savings and lower carbon intensity. As carriers broaden dimensional-weight pricing, e-commerce shippers prioritize space-efficient secondary packs. Lightweighting thus offers dual incentives: immediate cost relief and progress toward emissions targets.
Rapid Growth of Packaged F&B in Asia-Pacific
Vietnam’s packaging demand is forecast to hit USD 3.5 billion by 2026 at a 9.73% CAGR, mirroring middle-class appetite for convenience foods.[2]Vietnam Packaging Association, “Vietnam Packaging Market Outlook 2026,” vietnampackaging.org Rising quick-service restaurant penetration amplifies single-use container volumes, while regional governments increasingly ban non-recyclable plastics. Paperboard manufacturers capitalize on this momentum by launching compostable noodle bowls and grease-resistant snack cartons tailored to tropical climates.
Restraints Impact Analysis of Paperboard Packaging Market*
| Restraint | (~) % Impact on CAGR Forecast | Geographic Relevance | Impact Timeline |
|---|---|---|---|
| Deforestation and fiber-sourcing scrutiny | -0.6% | Global (tropical regions focus) | Medium term (2-4 years) |
| Volatile recovered-paper and energy costs | -0.4% | Global (regional variance) | Short term (≤ 2 years) |
| Brand-owner pull-back on sustainability pledges | -0.5% | North America and Europe, expanding globally | Medium term (2-4 years) |
| Flexible plastic pouches eroding share | -0.3% | Global (food and beverage focus) | Long term (≥ 4 years) |
| Source: Mordor Intelligence | |||
Deforestation and Fiber-Sourcing Scrutiny
Implementation of the European Union Deforestation Regulation compels mills to trace wood back to plots verified as deforestation-free after December 2020, adding auditing costs and exposing non-compliant supply chains to import bans.[3]Forest Stewardship Council, “European Union Deforestation Regulation Implementation,” fsc.org Multinationals extend the same protocols worldwide, effectively globalizing compliance. Smaller converters face disproportionate administrative burdens, nudging them toward certification pooling or vertical partnerships with plantation owners. Premiums paid for certified logs increase the break-even point for certain grades, compressing margins until chain-of-custody systems mature.
Volatile Recovered-Paper and Energy Costs
Recovered-fiber reference prices doubled in Q1 2024, while natural-gas volatility inflated pulping and drying expenses. Mills hedge through supply contracts and cogeneration projects, but input swings still distort quarterly earnings and complicate long-term pricing agreements. Some operators secure virgin eucalyptus pulp from Latin America to counterbalance recycled shortages, aided by Suzano’s INR 1.66 billion (USD 19 million) capacity expansion completed in January 2025.
*Our forecasts treat driver/restraint impacts as directional, not additive. The impact forecasts reflect baseline growth, mix effects, and variable interactions.
Paperboard Packaging Market Segment Analysis
By Raw Material Source:
Recycled Dominance Drives SustainabilityRecycled fiber secured a 72.10% share of the paperboard packaging market in 2025, underpinned by extensive curbside collection networks and maturing de-inking technologies. This segment is also projected to clock a 6.65% CAGR, outpacing virgin grades due to regulatory credits linked to circularity goals. The paperboard packaging market size for recycled grades is forecast to widen as brand owners mandate minimum post-consumer content for high-volume SKUs. Virgin fiber retains relevance where impeccable visual quality or high wet-strength is mandatory, such as cosmetics gift boxes and pharmaceutical blister cards.
Continuous investments in low-cost plantation forestry bolster recycled leadership. Suzano’s new Brazilian eucalyptus complex provides 2.55 million t/year of high-brightness pulp that blends seamlessly with recovered streams, lowering average furnish costs for global mills. Certification through FSC and PEFC further differentiates recycled sheets, enabling converters to add carbon-neutral claims that resonate with eco-conscious consumers. Resulting supply security and branding leverage keep recycled fiber at the forefront of the paperboard packaging market.


By Product Type:
Corrugated Boxes Lead Digital TransformationCorrugated boxes captured 42.10% revenue share in 2025, propelled by shipment frequency spikes tied to omnichannel retail. Embedded moisture barriers and crush-resistant micro-flutes allow these boxes to traverse automated sortation systems with minimal damage, reinforcing their indispensability. Folding cartons, though smaller in tonnage, promise the fastest 5.55% CAGR, as high-graphics capabilities align with premium food and personal-care placement. The paperboard packaging market size for folding cartons is projected to expand alongside demand for shelf-ready packs that combine vivid print with easier recyclability.
On the innovation front, Greif’s EnviroRAP™ showcases mono-material wrap formats that replace laminated mailers while retaining curbside recyclability. Parallel progress in digital corrugators lets converters print variable data at press speed, supporting localized holiday themes or influencer collaborations. Such flexibility differentiates corrugated solutions within the paperboard packaging market and sustains their lead as the workhorse of distribution.
By Packaging Format:
Secondary Packaging Balances Function and SustainabilitySecondary packaging accounted for 42.00% of the paperboard packaging market size in 2025, reflecting its pivotal role in safeguarding goods through extended logistics chains. Growth continues at a 4.95% CAGR as shippers fine-tune case dimensions to slash fill rates and emissions. Innovations in package geometry and board caliper enable double-stacking of pallets without structural compromise, appealing to cost-sensitive FMCG firms. Conversely, primary packs face stiffer competition from lightweight pouches, pressing converters to add tactile varnishes and easy-open features to preserve shelf presence.
Ranpak’s NatureMailer and Climaliner Plus lines underscore transit packaging advancements that integrate insulation and void fill within curbside-recyclable wraps. E-commerce-specific SKUs marry smart-label sensors with QR-code consumer engagement portals, widening value propositions beyond containment. Such differentiated offerings fortify the secondary segment against incursions from alternative substrates in the paperboard packaging market.
By End-user Industry:
Personal Care Drives Premium InnovationFood retained the largest 28.10% slice of the 2025 revenue pool thanks to rigorous safety standards and rapid takeaway growth, yet CAGR momentum now tilts toward personal care and cosmetics at 5.90%. Beauty brands view tactile, embossed cartons as integral to unboxing rituals, rewarding converters able to embed metallic foils without compromising recyclability. Graphic Packaging’s coffee-capsule know-how migrated to fragrance sample sleeves, illustrating cross-category technology transfer.
Healthcare remains a steady contributor; serialization codes mandated on pharma blister wallets reinforce demand for pristine virgin board with exacting print tolerances. Electronics makers prioritize anti-static coatings and precision inserts that cushion devices while communicating sustainability credentials. Collectively, these dynamics diversify revenue streams and mitigate exposure to cyclical single-category swings, cementing end-market resilience within the paperboard packaging market.
Geography Analysis
North America Paperboard Packaging Market
North America commanded 38.55% revenue share in 2025, buoyed by integrated recovered-fiber networks and state-level plastic-reduction mandates that steer converters toward curbside-recyclable solutions. Packaging Corporation of America’s USD 1.8 billion containerboard acquisition bolsters regional capacity, evidencing consolidation that harnesses scale efficiencies. Retailers’ same-day delivery services further stimulate demand for right-sized corrugated shippers, helping the paperboard packaging market sustain mid-single-digit growth despite energy-cost headwinds.
APAC Paperboard Packaging Market
Asia-Pacific represents the fastest-expanding arena, clocking a 6.78% CAGR through 2031 as urban households buy more packaged staples and quick-service meals. China’s export orders increasingly specify fiber-based transit wraps, while Vietnam’s local industry eyes USD 3.5 billion in packaging revenue by 2026. Regional governments embed circular-economy clauses in new waste directives, granting tariff concessions to importers of recycled sheets. These policy levers, coupled with low-cost labor and expanding online retail, turn Asia-Pacific into the growth engine of the paperboard packaging market.
Europe Paperboard Packaging Market
Europe sustains material innovations underpinned by regulations such as the PPWR and the EUDR, which tighten recyclability and sourcing standards. Sappi’s EUR 500 million(USD 587.73 million) machine upgrade enhances lightweight coated capacity, while Mondi’s acquisition spree widens folding-carton footprints across consumer-goods clusters. High recovery rates and consumer receptiveness to eco-labels maintain a robust baseline, although sluggish macro demand tempers tonnage growth. Still, stringent compliance hurdles create a moat that favors established players inside the paperboard packaging market.

Regulatory Landscape
Regulation continues to favor fiber-based packaging, while tightening compliance expectations around recyclability, sourcing, and food-contact chemistry. In the European Union, the Packaging and Packaging Waste Regulation (PPWR), Regulation (EU) 2025/40, entered into force on 11 February 2025 and becomes generally applicable across Member States on 12 August 2026, raising requirements for technical documentation, EU Declarations of Conformity, and traceability for packaging placed on the EU market.
Food-contact compliance remains a core gating factor for paperboard used in food and beverage applications. In the United States, paper and paperboard intended for contact with food are governed by FDA requirements and specific provisions such as 21 CFR 176.170 (aqueous and fatty foods) and 21 CFR 176.180 (dry foods), which constrain authorized substances and extractives, shaping barrier-coating selection and the shift toward PFAS-free grease resistance solutions.
Value Chain Analysis
The paperboard packaging value chain runs from upstream forestry and recovered-fiber collection to pulping and paper and board manufacturing, then converting into cartons, corrugated boxes, and other formats for brand owners and e-commerce shippers. Input streams split between virgin fiber (from managed forestry and sawmill residues) and recovered fiber (OCC and mixed paper), with functional additives such as coatings, varnishes, and barrier chemistries that support printability and food-contact performance.
Integrated producers and large converters manage multiple stages to control furnish quality, mill runnability, and cost exposure, while non-integrated players depend more on market pulp and recovered-paper availability. Logistics is dominated by regional truck and rail movements, and international flows remain sensitive to port congestion and schedule reliability, which has supported wider use of vendor-managed inventory and regionalized sourcing with large CPG customers. Operational bottlenecks typically emerge from recovered-fiber tightness and energy-cost spikes that lift pulping and drying costs, alongside converting-side constraints such as equipment uptime and order-splitting complexity during demand surges.
Competitive Landscape
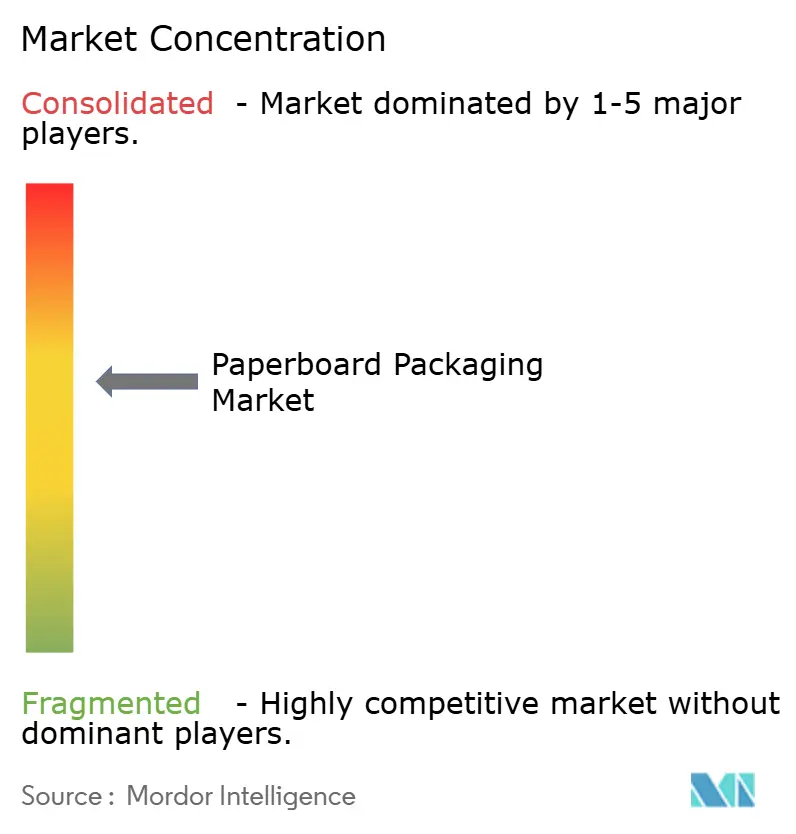
The sector remains moderately fragmented, yet M&A velocity is climbing as leaders chase geographic reach and closed-loop raw-material access. International Paper’s EUR 8.2 billion (USD 9.64 billion) buyout of DS Smith strengthens European corrugated holdings, while the USD 20 billion Smurfit-WestRock merger births a transatlantic powerhouse with unprecedented mill-to-market breadth. Market entrants differentiate via specialty coatings and AI-enabled converting, but scale advantages in fiber procurement and freight still tilt cost curves in favor of multinationals.
Strategically, vertical integration is the prevailing theme. Pulp investments in Latin America feed North American mills, mitigating recovered-paper price spikes and ensuring quality consistency. Concurrently, converters automate line changeovers and deploy digital twins to optimize asset maintenance, lowering downtime and elevating output per labor hour. Intellectual-property filings for smart-packaging sensors surged at the USPTO in 2025, signaling a fresh competitive battleground rooted in data-rich features.[4]United States Patent and Trademark Office, “Smart Packaging Technology Patents,” uspto.gov
Regional specialty players remain relevant by mastering local regulation and customer intimacy, particularly in high-barrier niches like pharma inserts and temperature-controlled meal-kit sleeves. Yet consolidation momentum suggests the top five firms could exceed a combined 55% share by decade’s end, nudging the paperboard packaging market toward a more concentrated structure without eliminating room for agile innovators.
Paperboard Packaging Industry Leaders
International Paper Company
Smurfit WestRock
Mondi plc
Packaging Corporation of America
Stora Enso Oyj
- *Disclaimer: Major Players sorted in no particular order
Paperboard Packaging Market Companies Covered in this Report
- International Paper Company
- Smurfit WestRock
- Mondi plc
- Packaging Corporation of America
- Stora Enso Oyj
- Oji Holdings Corporation
- Nippon Paper Industries Co., Ltd.
- Rengo Co., Ltd.
- Metsa Board Oyj
- Graphic Packaging Holding Company
- Cascades Inc.
- Sonoco Products Company
- Nine Dragons Paper (Holdings) Ltd.
- Georgia-Pacific LLC
- Klabin S.A.
- Sappi Limited
- Mayr-Melnhof Karton AG
- Huhtamaki Oyj
- Visy Industries Holdings Pty Ltd.
- Seaboard Folding Box Company Inc.
- Clearwater Paper Corporation
- ITC Limited

Market Opportunities and Future Outlook
Barrier-coated, repulpable paperboard is a clear whitespace as brand owners replace plastic-coated structures to meet recyclability, chemical, and traceability requirements across major markets. April 2026 highlights this shift: Stora Enso launched Performa Natura Aqua, a dispersion-coated folding boxboard positioned for grease-resistant, food-contact applications, aimed at substitution away from traditional plastic barriers while maintaining fiber recyclability.
Capacity and grade-mix changes are also opening demand for suppliers that can serve both high-volume transit needs and premium carton requirements amid recovered-paper and energy volatility. In July 2026, Graphic Packaging International announced entry into uncoated recycled paperboard with PaceSetter Ridgeline made at its Waco, Texas mill, expanding options for recycled-content cartonboard and helping converters and brands broaden fiber-based portfolios. Equipment and mill investments announced for 2026, including rebuilds and new board-making lines, further point to modernization that supports lightweight, high-strength designs designed to reduce shipping costs while aligning with tightening packaging documentation and labeling expectations in regulated regions.
Recent Industry Developments in Paperboard Packaging Market
- July 2026: Smurfit WestRock partnered with Coca-Cola on specialized packaging tied to World Cup-related demand. The collaboration shows how large beverage campaigns are being supported through customized paper-based formats that balance brand impact with recyclability requirements. It also highlights the role of scale converters in delivering rapid-turn promotional runs across multiple geographies.
- June 2026: International Paper completed the USD 360 million acquisition of North Pacific Paper Company (NORPAC). The deal expands access to capabilities positioned around lightweight, high-performance packaging grades, strengthening its upstream-to-downstream fit for corrugated and paperboard applications. Consolidation of this type supports tighter control over fiber supply and grade development for e-commerce and consumer packaging end uses.
- March 2026: International Paper announced plans for a USD 225 million, 468,000-square-foot sustainable packaging facility in Rankin County, Mississippi, with construction scheduled to start in June 2026. The greenfield project indicates continued capital deployment into modern, more automated packaging networks designed to improve service levels and cost efficiency. It also reflects the shift toward newer assets as companies rebalance footprints to match demand centers.


Paperboard Packaging Market Report Scope and Research Methodology
Market Definition and Coverage
This market covers revenues generated from paperboard-based packaging products used to pack, protect, and distribute goods across consumer and industrial end uses, counted at the point where packaging is sold into the market and recorded in USD.
Scope exclusions: We exclude non-packaging paper products and upstream pulp or recovered paper sales that do not represent finished paperboard packaging revenues.
Segments Covered in This Report
- By Raw Material Source
- Virgin Fibre
- Recycled Fibre
- By Product Type
- Folding Cartons
- Corrugated Boxes
- Rigid Boxes
- Other Product types
- By Packaging Format
- Primary Packaging
- Secondary Packaging
- Transit / E-commerce Shipping
- By End-user Industry
- Food
- Beverage
- Healthcare
- Personal Care and Cosmetics
- Household Care
- Electrical and Electronics
- Other End-user Industries
- By Geography
- North America
- United States
- Canada
- Mexico
- South America
- Brazil
- Argentina
- Chile
- Rest of South America
- Europe
- United Kingdom
- Germany
- France
- Spain
- Italy
- Rest of Europe
- Asia-Pacific
- China
- India
- Japan
- Australia
- South Korea
- Vietnam
- Rest of Asia-Pacific
- Middle East and Africa
- Middle East
- Saudi Arabia
- United Arab Emirates
- Turkey
- Rest of Middle East
- Africa
- South Africa
- Nigeria
- Egypt
- Rest of Africa
- Middle East
- North America
Data Sources, Market Sizing, and Validation
Desk Research
Desk research was used to set the backbone of the model and to make sure our assumptions match real-world packaging activity. We leaned on public sources such as US Census and Bureau of Economic Analysis series for packaging-linked output signals, UN Comtrade trade statistics for paperboard and packaging-related flows, FAO forestry and paper statistics for board production context, and OECD or World Bank macro indicators that help normalize demand by economy size.
To connect supply capacity with packaging demand, we also reviewed company annual reports, investor presentations, and packaging association publications that discuss board grades, mill capacity changes, and demand shifts by end use such as food, beverage, and e-commerce. Where needed, paid subscriptions for company financials and intelligence, news and financials, patent databases, and shipment-level trade records were used to cross-check revenues, price direction, and technology adoption, before assumptions were carried into the sizing model. These desk research sources are illustrative only, and many other public and paid references were also consulted for data collection, validation, and clarification.
Primary Interviews and Surveys
Primary work was used to confirm which paperboard packaging products are actually being sold, how pricing is being reset (especially for recycled versus virgin fiber), and how demand is moving by end use. We spoke with a spread of manufacturers, converters, distributors, and large buyers, and we included views across APAC, EMEA, and the Americas so regional demand patterns and trade effects could be checked before finalizing the model outputs.
Distribution of primary research fieldwork respondents
| Company type | Respondent position | Region |
|---|---|---|
| Top tier: 27% | CXOs: 21% | APAC: 44% |
| Mid tier: 51% | Functional/Unit leaders: 37% | EMEA: 32% |
| Smaller Players: 22% | Managers: 42% | Americas: 24% |
Market-Sizing & Forecasting
Sizing starts from a top-down reconstruction of the addressable demand pool, where board consumption is linked to packaging output signals and then allocated to paperboard packaging revenue using region-level price and mix checks. The model is then corroborated with selective bottom-up approximations, including rolling up sampled supplier revenues, checking converter throughput, and applying sampled average selling prices to observed volume indicators. Where gaps remain, we use proxy ratios that were confirmed in interviews.
For paperboard packaging, we tracked inputs that typically drive value and volume together: production and trade direction, recycled fiber versus virgin fiber mix shifts, average selling price movements tied to recovered paper and energy costs, packaging demand indicators from food and beverage and e-commerce shipping, and lightweighting or downgauging trends that can change value per unit shipped. Forecasts were built using scenario analysis supported by short time-series smoothing on key drivers, and then the forward view was adjusted after experts reviewed the likely path of pricing resets, capacity additions, and substitution between board grades.
Data Validation & Update Cycle
Outputs are triangulated across independent signals so the final number is not driven by a single series. We run variance checks at regional and end-use levels to spot step changes that do not match known packaging demand or trade behavior.
When a mismatch appears, the assumptions behind price, mix, or demand allocation are revisited, and follow-up calls are triggered to resolve the driver rather than forcing the total to fit. Before sign-off, the model and narrative go through multi-step analyst reviews, including logic checks on growth rates, currency timing, and the link between volume proxies and revenue. Reports are refreshed annually, with interim updates when material events occur, and a final pre-delivery review is completed so clients receive an updated view aligned to the latest public releases and validated assumptions.
Mordor Intelligence's Paperboard Packaging Market Size Versus Other Published Estimates
Published market sizes for paperboard packaging can differ widely because different studies pick different product boundaries, time bases, and pricing logic, and those choices can shift the total quickly. The gap also shows up when some estimates incorporate adjacent paper packaging categories or use shipment volume proxies without fully aligning them to the revenue capture point used in paperboard packaging.
Key gap drivers in this space usually come from what is counted as paperboard packaging versus broader paper packaging, how recycled and virgin fiber pricing is projected, whether trade flows are treated as net additions or double-counted through re-exports, and how the current year is normalized for inflation and currency conversion timing. We also see spreads when one publisher runs a capacity-led case, while another stays conservative using end-use demand signals like food and beverage packaging runs and e-commerce box consumption.
Benchmark comparison
| Source | Market Size | Gaps in Research Methodology |
|---|---|---|
| Mordor Intelligence | USD 297.54 B (2026) | |
| Global Consultancy A | USD 186.20 B (2024) | This figure appears to anchor on an earlier base year and can understate the current cycle if price resets and post-2024 demand normalization are not fully carried through, especially where recovered paper driven pricing moved quickly. |
| Industry Publisher B | USD 167.00 B (2025) | The lower value is consistent with a narrower revenue capture approach and more conservative price progression, which can also occur when some board grades or packaging formats are treated as out of scope or when end-use allocation is kept tight. |
The table shows a wide spread mainly because the counted year and what gets treated as paperboard packaging revenue are not consistent across sources, and in Mordor Intelligence's model the value is tied to the 2026 revenue capture point with price and mix checks across regions to avoid mixing in adjacent paper packaging categories. When the same scope and timing rules are applied, the final market size becomes easier to reconcile to production, trade, and end-use packaging signals, and the steps stay repeatable for future updates.


Key Questions Answered in the Report
How large is the paperboard packaging market in 2026?
It is valued at USD 297.54 billion with a 4.17% projected CAGR to 2031.
Which material commands the highest share?
Recycled fiber holds 72.10% of 2025 revenue thanks to established collection systems and regulatory credits.
What drives rapid growth in Asia-Pacific?
Expanding middle-class consumption, e-commerce penetration, and government circular-economy policies push a 6.78% CAGR through 2031.
Why are corrugated boxes so dominant?
They support omnichannel fulfillment with structural strength, branding surfaces, and evolving smart-label integrations.
Which end-use segment is growing fastest?
Personal care and cosmetics packaging is advancing at 5.90% CAGR as brands seek premium yet sustainable cartons.
Page last updated on:


 Your data is secure and never sold or shared.


