
Pallets Market Size and Share
Market Overview
| Study Period | 2020 - 2031 |
|---|---|
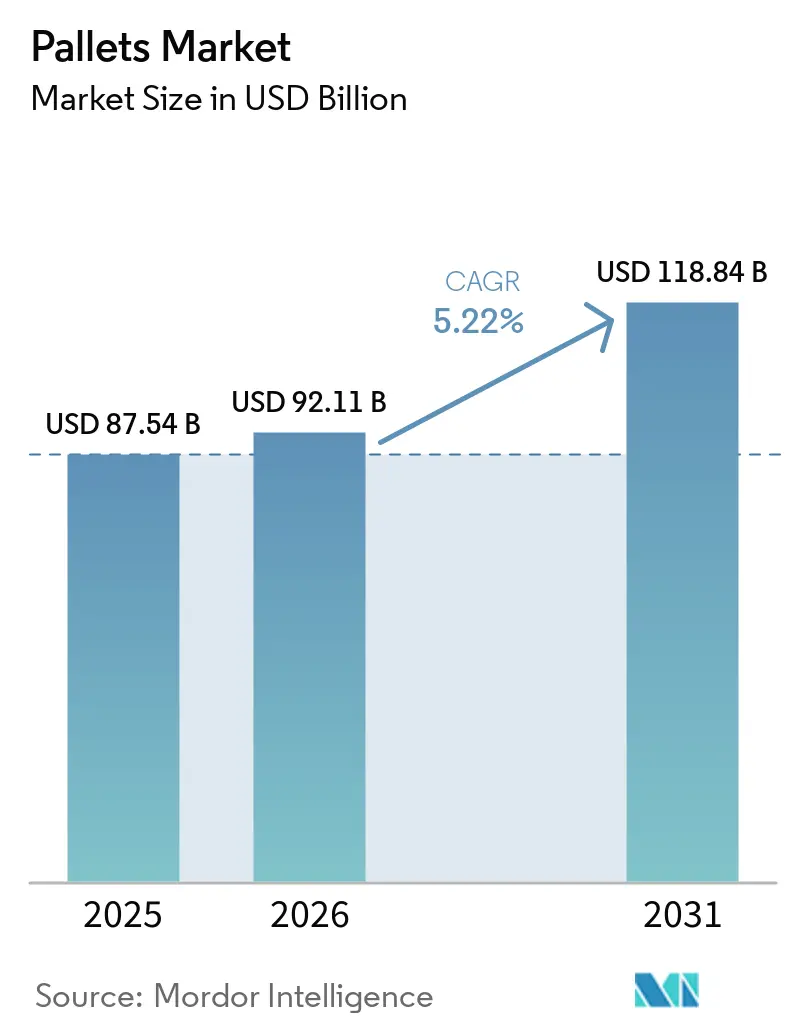
| Market Size (2026) | USD 92.11 Billion |
| Market Size (2031) | USD 118.84 Billion |
| Growth Rate (2026 - 2031) | 5.22 % |
| Fastest Growing Market | Asia Pacific |
| Largest Market | Asia Pacific |
| Market Concentration | Low |
Major Players *Disclaimer: Major Players sorted in no particular order Image © Mordor Intelligence. Reuse requires attribution under CC BY 4.0. | |
Pallets Market Analysis by Mordor Intelligence
The pallets market size in 2026 is estimated at USD 92.11 billion, growing from 2025 value of USD 87.54 billion with 2031 projections showing USD 118.84 billion, growing at 5.22% CAGR over 2026-2031. Robust e-commerce activity, automation-ready warehouse design and global alignment with ISPM-15 standards underpin demand. Companies are prioritizing block pallets to avoid costly recalibration of automated storage and retrieval systems, while plastics gain share in food, beverage and pharmaceutical chains that require non-porous contact surfaces. Regional pooling models are scaling rapidly in Asia-Pacific, helped by cross-border trade initiatives that favor certified, track-and-trace assets. At the same time, lumber price volatility and weak reverse-logistics for plastics in parts of South America and Africa hold growth below potential. Despite these frictions, technology-enabled pooling and bio-composite innovations continue to open cost-efficient and sustainable pathways for users.
Key Report Takeaways
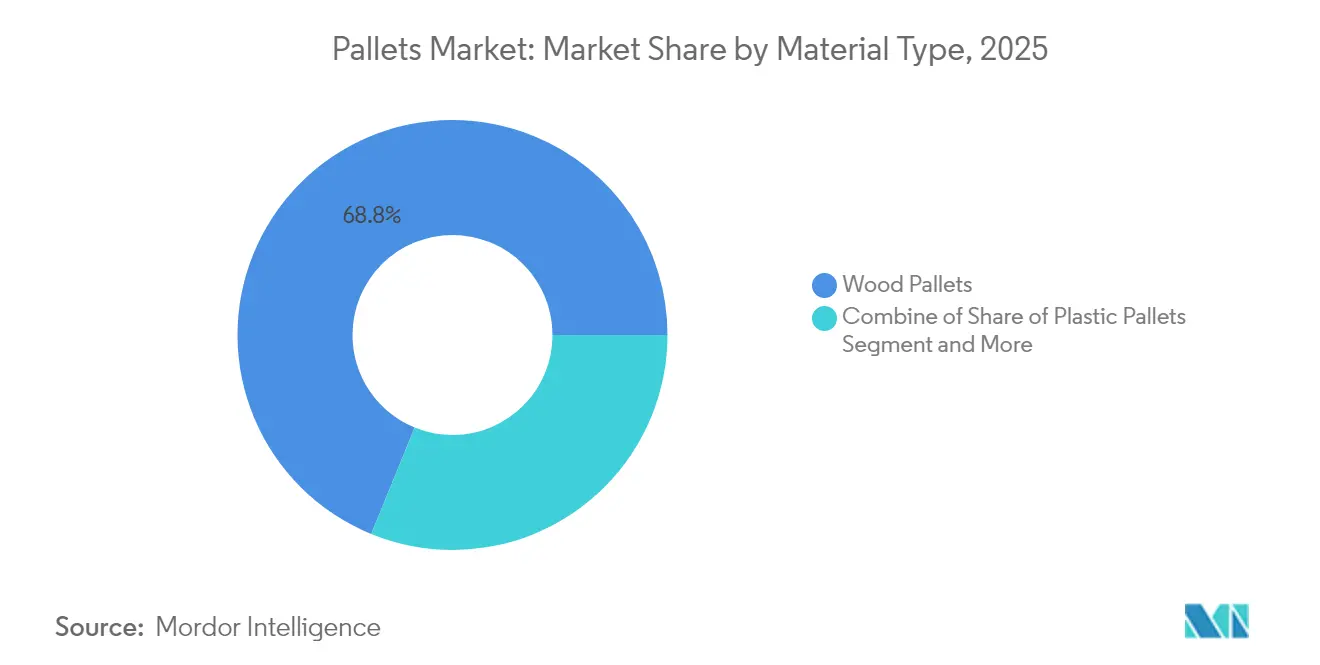
- By material type, wood held 68.83% of pallets market share in 2025; plastic is projected to register the fastest 10.38% CAGR through 2031.
- By design, block pallets led with 54.78% revenue share in 2025, whereas customized formats are expected to expand at a 7.28% CAGR to 2031.
- By pallet type, rackable solutions accounted for 44.86% of the pallets market size in 2025; nestable variants are advancing at a 6.76% CAGR to 2031.
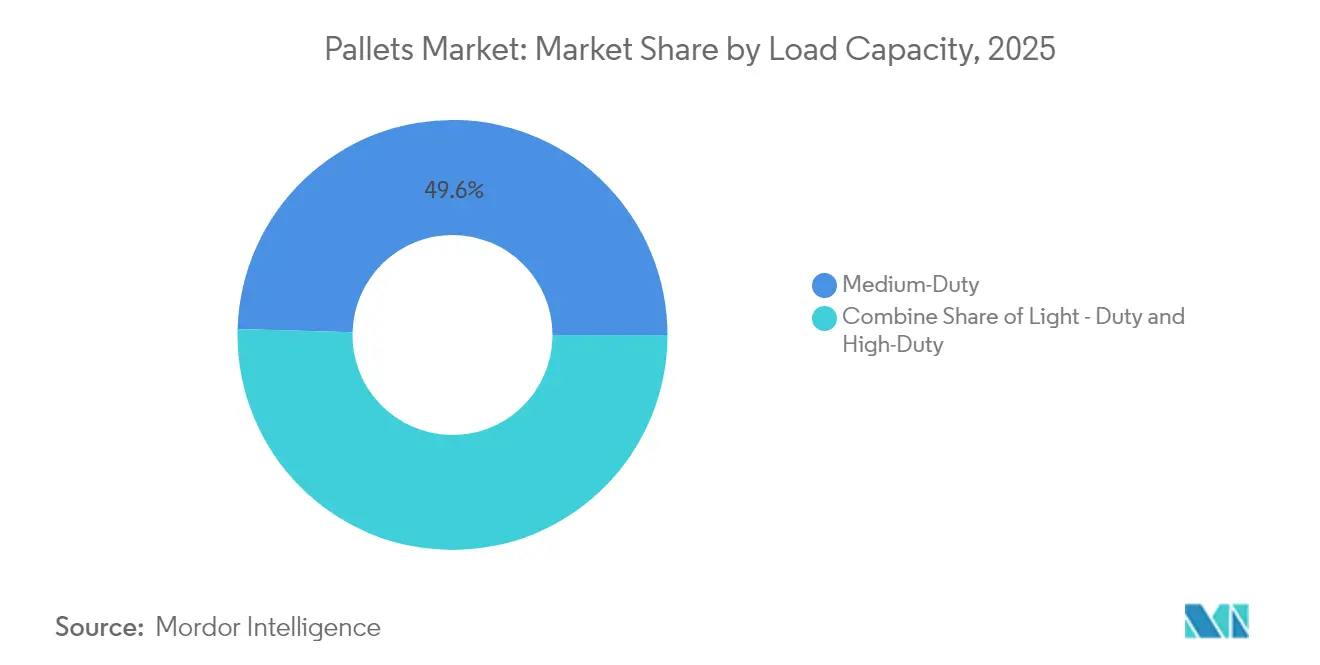
- By load class, medium-duty pallets dominated with 49.55% share in 2025; high-duty units are set for a 6.15% CAGR through 2031.
- By end-user industry, logistics and warehousing commanded 34.92% share of the pallets market size in 2025, while pharmaceutical and healthcare applications are growing at 8.53% CAGR to 2031.
- By geography, Asia-Pacific captured 44.66% of pallets market share in 2025 and is rising at a 6.23% CAGR to 2031.
Note: Market size and forecast figures in this report are generated using Mordor Intelligence’s proprietary estimation framework, updated with the latest available data and insights as of 2026.
Global Pallets Market Trends and Insights
Drivers Impact Analysis*
| Driver | (~) % Impact on CAGR Forecast | Geographic Relevance | Impact Timeline |
|---|---|---|---|
| E-commerce fulfilment centres driving block-pallet adoption | +1.2% | North America & Europe | Medium term (2-4 years) |
| Regulatory push for ISPM-15 pallets fuelling pooling | +0.8% | Asia-Pacific core; spill-over to MEA | Long term (≥ 4 years) |
| Hygienic plastic pallets demand from FSMA and EU compliance | +0.6% | Global; concentrated in NA & EU | Medium term (2-4 years) |
| RTP uptake in pharma cold-chain logistics | +0.9% | Global; early gains in Oceania & India | Short term (≤ 2 years) |
| Warehouse robotics requiring dimensionally consistent pallets | +0.7% | North America & EU; expanding to APAC | Medium term (2-4 years) |
| Net-zero targets accelerating bio-composite pallets | +0.4% | China & SE-Asia; pilot programs in EU | Long term (≥ 4 years) |
| Source: Mordor Intelligence | |||


E-commerce fulfilment centres driving block-pallet adoption
High-velocity omnichannel warehouses are standardising on block formats to secure four-way access and structural integrity. Deviation from the reference block specification can trigger USD 50,000–200,000 recalibration costs per site, locking operators into dimensionally consistent units.[1]AutoStore System, “9 Steps on How To Master Palletizing,” autostoresystem.comThroughput improvements of up to 30% and robotic mixed-case palletising gains of 288% have been recorded, reinforcing the preference for block designs.
Regulatory push for ISPM-15 pallets fuelling pooling in Asia-Pacific
The ISPM-15 framework now spans 182 countries and levies roughly USD 45 million in annual penalties, forcing shippers toward certified pooling networks that guarantee heat-treated assets. [2]European Pallet Association, “ISPM15 – Protection of International Ecosystems,” epal-pallets.orgPooling volumes in Asia-Pacific have risen 23% since 2024, aided by digital traceability devices that keep compliance data linked to each pallet.
Hygienic plastic pallets demand from FSMA and EU 1935/2004 compliance
Food and pharma operators are switching to plastics that remain below 10 mg/dm² migration limits mandated by EU rules. [3]European Commission, “Legislation,” food.ec.europa.eu Plastic units cut bacterial contamination risk by 99.9% and perform reliably from -20 °C to 40 °C.
RTP uptake in pharma cold-chain logistics across Oceania and India
Reusable packaging in cold chains is set to lift utilisation from 30% to 70% by 2030, slashing life-cycle costs up to 60%. Investments such as Cold Chain Technologies’ EUR 12 million Netherlands plant illustrate the infrastructure build-out supporting this shift.
Restraints Impact Analysis*
| Restraint | (~) % Impact on CAGR Forecast | Geographic Relevance | Impact Timelin |
|---|---|---|---|
| Volatile lumber prices from US-Canada tariffs | -0.7% | North America; spill-over globally | Short term (≤ 2 years) |
| Weak reverse-logistics for plastic pallets in South America and Africa | -0.5% | South America & Africa | Medium term (2-4 years) |
| High cost and weight limiting metal pallets in EMEA air-freight | -0.3% | EMEA air-freight corridors | Long term (≥ 4 years) |
| Fragmented ASEAN standards hindering pooling scalability | -0.4% | ASEAN region | Medium term (2-4 years) |
| Source: Mordor Intelligence | |||
Volatile lumber prices from US-Canada tariffs
A 14.54% duty on Canadian softwood swings wood input costs by as much as 40% per quarter, forcing manufacturers to hedge purchases and compress margins. The exposure encourages investment in alternative fibres such as corn stover panels now in pilot production.
Weak reverse-logistics for plastic pallets in South America and Africa
Recovery rates below 40% double ownership costs versus pooled models, discouraging plastic uptake even where climate benefits exist. Sparse road networks and low pooling penetration complicate collection economics.
*Our forecasts treat driver/restraint impacts as directional, not additive. The impact forecasts reflect baseline growth, mix effects, and variable interactions.
Segment Analysis
By Material Type: Wood Dominance Faces Sustainability Pressures
Wood retained 68.83% of pallets market share in 2025, underpinned by a USD 8–12 unit price advantage. However, tariff-driven cost inflation, ISPM-15 heat-treatment fees, and customer decarbonization targets are eroding this lead. Brambles sources 78% certified timber and plants two trees for each harvested one to sustain its pool, yet users still seek lighter, recyclable options.
Plastic pallets are tracking a 10.38% CAGR through 2031 as hygiene and reusability requirements mount. Adoption accelerates where the total cost of ownership offsets higher acquisition prices, especially in pharma and food sectors bound by strict contact-material rules. Bio-composites derived from rice husk and corn stover offer biodegradability within two months, meeting both regulatory and corporate carbon objectives. These attributes are gaining traction across Asia-Pacific, where agricultural residues are abundant and waste-reduction policies are supportive.


By Design: Block Pallets Enable Automation Integration
Block formats commanded 54.78% of the pallets market in 2025 due to four-way access and robotic compatibility. Automated fulfilment floors report 15–20% faster handling relative to stringer alternatives.
Customized pallets are growing 7.28% CAGR as operators demand RFID inserts, sensor slots and deck surfaces tailored to specific conveyor coefficients. Hybrid builds that marry wooden decks to plastic runners balance friction optimisation with cost, supporting the rising automation installed base in grocery and apparel distribution.
By Pallet Type: Rackable Solutions Dominate Warehouse Operations
Rackable options held 44.86% of pallets market size in 2025, enabling 40–50% higher storage density in high-bay racking. Nestable units are advancing at a 6.76% CAGR as shippers prioritise back-haul efficiency; nested stacks cut empty-transport costs by as much as 70%.
Stackable and other niche designs continue to serve specialty sectors, such as fresh-produce exporters that need temporary field storage before cross-dock transfer, or hazardous-materials handlers that require steel reinforcement for safety compliance.
By Load Capacity: Medium-Duty Applications Drive Volume
Medium-duty formats captured 49.55% share by accommodating 1,000–2,500 kg loads typical of mainstream consumer-goods flows. High-duty variants above 3,000 kg are projected to rise 6.15% CAGR, fuelled by reshoring of metal-working and machinery production requiring heavier payloads.
Light-duty pallets remain the choice for apparel, lightweight electronics and parcel fulfilment, where low tare weight minimises shipping costs and manual handling injury risk.
By End-User Industry: Logistics Infrastructure Expansion Drives Demand
Logistics and warehousing users represented 34.92% share of pallets market size in 2025, reflecting consolidation of third-party logistics and omnichannel distribution. Operators such as CHEP manage multi-client share-and-reuse pools that optimise pallet turns and curb waste.
Pharmaceutical and healthcare pallets market demand is growing fastest at 8.53% CAGR to 2031. Temperature-controlled pools that maintain 2–8 °C for 96 hours underpin vaccine, biologics and specialty-drug shipments, complemented by reusable insulated shippers. Food, beverage and automotive users remain steady consumers, each dictating distinct load, hygiene and automation parameters.
Geography Analysis
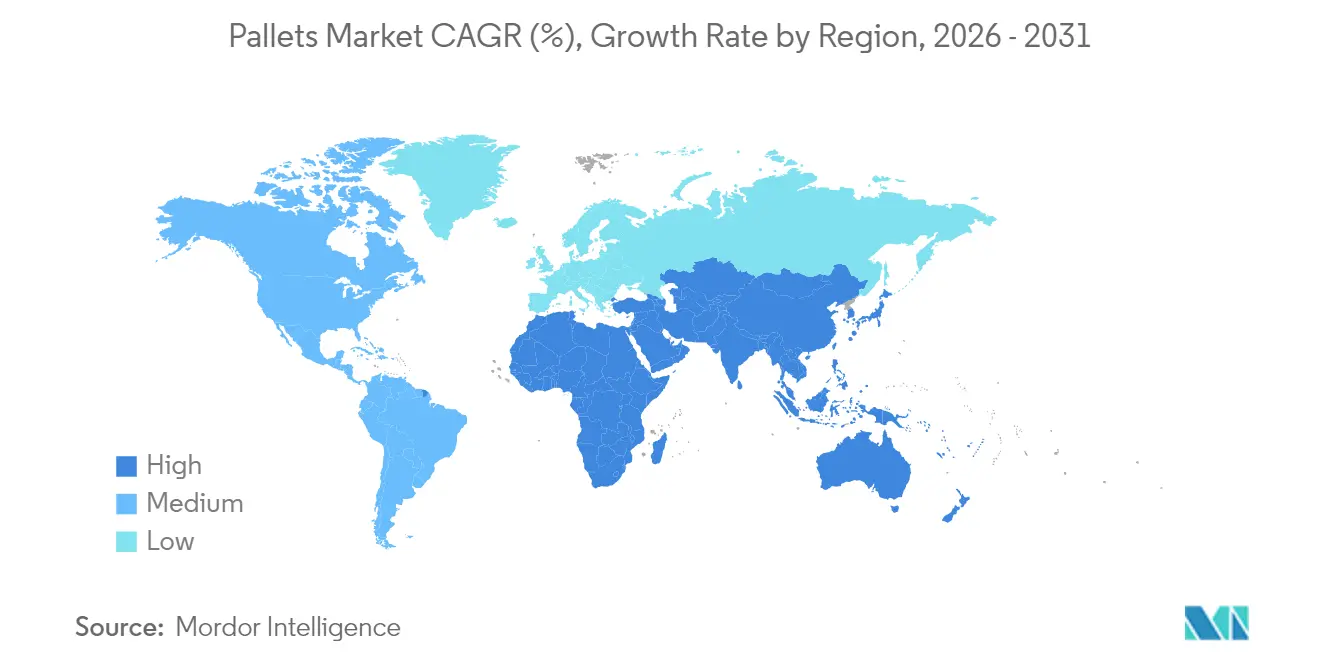
Asia-Pacific led with 44.66% of pallets market share in 2025 and is expected to post a 6.23% CAGR. Manufacturing hub consolidation in China and India, plus e-commerce acceleration in Southeast Asia, continue to lift volume. Loscam’s pool expansion illustrates how cross-border asset rotation lowers repositioning miles and reduces imbalances.
North America ranks second as automation retrofits and near-shoring policy drive pallet upgrades. Lumber tariffs inject volatility but also promote alternative fibres and plastic adoption. Mexico’s deeper integration into US supply chains generates fresh demand for ISPM-15-certified pallets serving both domestic and export lanes.
Europe’s market benefits from circular-economy law, carbon pricing and high labour costs that favour automation. Implementation of reusable pallet schemes compresses waste, while bio-composite pilots in Germany and the Nordics test next-generation materials. Middle East, Africa and South America exhibit high latent potential yet remain constrained by reverse-logistics and standards fragmentation, although national logistics plans in Saudi Arabia and Brazil point to upside beyond 2027.

Regulatory Landscape
Phytosanitary compliance remains a core cross-border requirement for wood pallets under ISPM 15 within the IPPC framework. It requires debarking plus heat treatment or fumigation, along with standardized marking for wood packaging material used in international trade. In the United States, USDA APHIS moved to full enforcement of ISPM 15 marking requirements starting January 2026, increasing the operational importance of verified stamps and compliant treatment records for exporters, importers, and pallet pool operators.
In Europe, circularity rules for transport packaging are tightening. Regulation (EU) 2025/40 entered into force on 11 February 2025 and applies from 12 August 2026, with a reuse requirement for transport packaging (including pallets and intermediate bulk containers) set at 40% from 1 January 2030. This raises demand for managed reusable assets and track-and-trace to evidence rotations. The European Commission also clarified elements of the reuse framework in February 2026 by exempting pallet wrappings and straps from specific 100% reuse targets referenced in the regulation, which is likely to shape how pallet systems are designed and audited for compliance.
Competitive Landscape
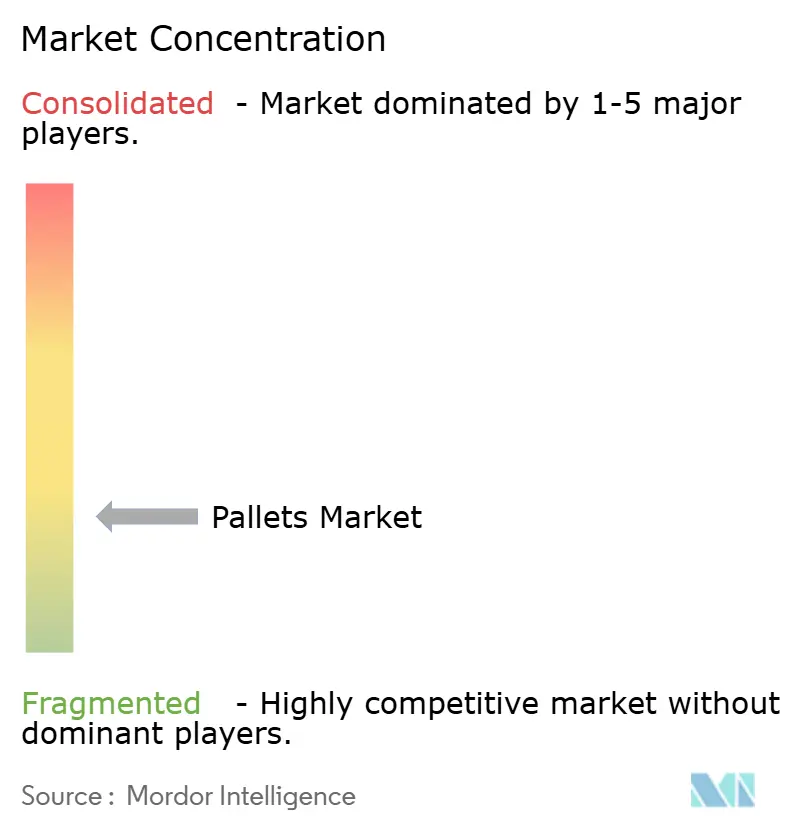
The top five suppliers account for about 25% of global capacity, signalling a moderately fragmented field where regional specialists and innovators can thrive. Brambles (CHEP) leverages more than 550,000 IoT trackers to boost utilisation and sustainability reporting. ORBIS invested in a 660,000 sq ft Texas plant to align production with Mexico-US corridors, creating 190 new jobs.
Patent filings concentrate on shape optimisation and sensor integration for robot handling. Regional players pursue niche advantages: PalletBiz scaled an Eastern Europe plant to serve specialty timber segments, while CornBoard targets biomass composites that bypass lumber pricing cycles.
Sustainability finance is rising, with Brambles issuing a EUR 500 million green bond to fund low-carbon asset pools. Partnerships such as Barilla–CHEP in Italy highlight brand owners’ preference for reusable supply-chain components that cut emissions and avoid virgin wood use.
Pallets Industry Leaders
Falkenhahn AG
CABKA Group GmbH
CHEP (Commonwealth Handling Equipment Pool)
Palettes Gestion Services
PalletOne, Inc.
- *Disclaimer: Major Players sorted in no particular order

Market Opportunities and Future Outlook
Regulatory-driven reuse and automation requirements create room for PPWR-aligned, trackable, dimensionally consistent pallets and related services, including pooling, refurbishment, and compliance data management. An example is the April 2026 launch of the Euro-sized Tosca Circular Pallet (CP 1208) by Tosca and Cabka, positioned as PPWR-compliant and automation-ready, which reflects buyer pull for standardized, reusable transport assets that fit automated warehouse flows and reduce recalibration risk.
Capacity additions and network expansion by pallet manufacturers and service providers support opportunities for localized production near major logistics corridors, alongside secondary-market reconditioning to extend asset life. In 2026, Hinton Lumber Products brought online a 200,000 sq ft automated pallet facility in Charleston, South Carolina, and UAB JPackaging began operating a EUR 30 million plant in Seduva, Lithuania, designed for EPAL-standard output, signaling investment in higher-throughput, specification-driven supply. Consolidation and service bundling also support managed-asset models, shown by PGS Group entering Italy via the acquisition of Beretta Pallets (adding production and reconditioning) and UFP Packaging expanding its footprint through the acquisition of Berry Pallets in Minnesota.
Recent Industry Developments
- June 2026: CHEP and Animex Foods expanded long-term cooperation across multiple facilities to standardize pallet flow management. The multi-site scope strengthens pooling penetration in food supply chains and supports more uniform handling practices across a customer network.
- September 2025: Cabka and Renewi launched the Eco CP3 pallet made from 100% recycled polyethylene, designed for more than 25 reuse cycles. The launch broadens circular product options for closed-loop users and aligns plastic pallet offerings with reuse and recycled-content priorities.
- November 2024: Brambles entered into a binding agreement to divest its CHEP India business to LEAP India Private Limited for about USD 85 million. The transaction reshapes competitive positioning in India and shifts control of a major pooling footprint to a local operator.


Research Methodology Framework and Report Scope
Market Definition and Coverage
For this study, the pallets market includes revenue earned from pallets used for unit load handling and shipment across industrial and commercial supply chains, across common materials such as wood and plastic. It captures sales tied to logistics movement and storage needs, in value terms.
Scope exclusions: Pallet pooling and rental services and pure material inputs (like lumber prices only) are excluded unless they are sold as part of a finished pallet product.
Segmentation Overview
- By Material Type
- Wood
- Plastic
- Metal
- Corrugated Paper/Composite
- By Design
- Block
- Stringer
- Customized
- By Pallet Type
- Nestable
- Rackable
- Stackable
- Other Pallet Types
- By Load Capacity
- Light - Duty Pallets
- Medium - Duty Pallets
- High - Duty Pallets
- By End-User Industry
- Food and Beverage
- Chemical
- Pharmaceutical and Healthcare
- Retail and E-Commerce
- Logistics and Warehousing
- Automotive
- Other Industries
- By Geography
- North America
- United States
- Canada
- Mexico
- Europe
- Germany
- United Kingdom
- France
- Italy
- Spain
- Russia
- Rest of Europe
- Asia-Pacific
- China
- India
- Japan
- South Korea
- Australia and New Zealand
- Rest of Asia-Pacific
- Middle East and Africa
- Middle East
- United Arab Emirates
- Saudi Arabia
- Turkey
- Rest of Middle East
- Africa
- South Africa
- Nigeria
- Egypt
- Rest of Africa
- Middle East
- South America
- Brazil
- Argentina
- Rest of South America
- North America
Data Sources, Market Sizing, and Validation
Desk Research
Desk work starts with building a clean fact base around pallet demand drivers and the supply environment, and then aligning definitions so the market boundary stays stable across regions. We rely on public sources such as US Census Bureau trade and manufacturing tables, US International Trade Commission trade statistics, UN Comtrade, and World Bank and OECD logistics and industrial indicators to understand shipment movement and packaging intensity.
To avoid single point assumptions, we also scan sources such as patent databases for pallet design activity, customs and phytosanitary guidance (for example ISPM 15 related rules), and credible association and port or freight statistics that signal warehouse and transport throughput. Company annual reports, investor presentations, and press releases help validate capacity moves, material shifts, and pricing commentary, while a paid subscription for company financials and news is used to cross-check revenue scale and timing. These examples are not exhaustive, and many other public documents and datasets were also used for data collection, validation, and clarification.
Primary Interviews and Surveys
Primary conversations were used to confirm real buying patterns, replacement cycles, and how pricing changes when customers switch between wood, plastic, and other pallet types. We spoke with participants across manufacturing, distribution, and logistics roles in APAC, EMEA, and the Americas so assumptions from desk work could be tested, refined, and validated again.
Distribution of primary research fieldwork respondents
| Company type | Respondent position | Region |
|---|---|---|
| Top tier: 30% | CXOs: 13% | APAC: 50% |
| Mid tier: 53% | Functional/Unit leaders: 29% | EMEA: 31% |
| Smaller Players: 17% | Managers: 58% | Americas: 19% |
Market-Sizing & Forecasting
The core model is built using a top-down approach where production and trade indicators are used to reconstruct the addressable pallet demand tied to industrial output and logistics activity, and then converted into value using observable pricing patterns. We map the demand pool by region using variables such as manufacturing output and inventory movement, export and import volumes for pallet-linked goods, warehouse footprint additions, and freight and port throughput as practical signals of pallet turns.
Once the demand pool is shaped, pricing is handled through a blended ASP logic that reflects material mix shifts, repairability, and cycle life differences, and it is checked against interview feedback on quarterly pricing behavior and contract reset timing. To keep the totals realistic, selective bottom-up approximations are used, such as sampling supplier revenue bands from public filings, applying channel checks on unit pricing, and sanity testing volume expectations against replacement rates in high use end markets like food, beverage, and general manufacturing. Gaps are handled by using proxy indicators from nearby countries with similar industrial structure, and then the assumptions are re-tested with local interview inputs before finalization.
For forecasting, scenario analysis is used so changes in trade intensity, industrial production, and material substitution can be reflected without forcing a single straight line outcome. The scenario weights and variable ranges are aligned with what primary respondents expect for pallet reuse trends, compliance related treatment costs, and the pace of automation in warehousing.
Data Validation & Update Cycle
Outputs are validated through triangulation across independent signals, where market totals are compared with trade flows, manufacturing activity, and price direction checks to spot inconsistencies early. If a region shows abnormal jumps, the inputs are reviewed again, outlier assumptions are flagged, and follow-up calls are triggered to confirm whether the change is structural or timing related.
Before sign-off, the model and narrative go through multi-step analyst reviews so definitions, units, and currency conversions are consistent across all tables. The report is refreshed annually, and interim updates are made when material events occur, such as sharp raw material price moves or major regulatory changes (for example ISPM 15 related treatment and handling updates). Right before delivery, an analyst runs a fresh pass on the key variables and the market sizes so clients receive an updated view rather than an older snapshot.
Mordor Intelligence's Pallets Market Estimate Compared With Other Published Estimates
Published market numbers for pallets can vary a lot, even when they look like they cover the same topic, because the refresh timing and the pricing basis are often not aligned. Differences also come from whether the estimate is for all pallet materials or only wood, and whether values are reported at factory gate, wholesale, or another pricing point.
When currency timing is locked to a specific year average, and ASPs are updated using supplier and buyer checks rather than a simple inflation uplift, the totals move toward what buyers actually paid in that period, which is how Mordor Intelligence treats the 2026 value point used below. Some other estimates lean on nominal wholesale prices, or they narrow the definition to only wood pallets, which changes the numerator and makes the number look lower or higher depending on what is included.
Benchmark comparison
| Source | Market Size | Gaps in Research Methodology |
|---|---|---|
| Mordor Intelligence | USD 92.11 B (2026) | |
| Trade Data Publisher A | USD 67.40 B (2024) | Wood flat pallets and pallet collars only, with value stated in nominal wholesale prices, which can exclude non-wood pallets and shift the pricing point versus mixed-material pallet revenue. |
| Industry Research Portal B | USD 15.60 B (2024) | Wood-only scope with product-type segmentation inside wood pallets, which removes plastic and other materials and therefore represents a narrower market boundary than all pallets. |
The table shows that most of the spread is explained by scope and pricing basis rather than arithmetic errors. When the model keeps material coverage consistent, applies a traceable ASP path, and rechecks assumptions on timing and currency, the final total becomes easier to reproduce and more practical to use for planning.


Key Questions Answered in the Report
What is the current value of the pallets market?
The pallets market size reached USD 92.11 billion in 2026 and is projected to climb to USD 118.84 billion by 2031.
Which material segment is growing fastest?
Plastic pallets are expanding at a 10.38% CAGR through 2031, outpacing other materials due to hygiene and regulatory benefits.
Why are block pallets preferred in automated warehouses?
They provide four-way access and dimensional consistency, delivering 15–30% faster handling and avoiding costly system recalibration.
How significant is Asia-Pacific in the global pallets market?
Asia-Pacific commanded 44.66% of pallets market share in 2025 and remains the fastest-growing region at a 6.23% CAGR.
What role do pooling networks play in market growth?
Pooling lowers total cost of ownership, ensures ISPM-15 compliance and supports circular-economy goals, driving widespread adoption across regions.
Page last updated on:


 Your data is secure and never sold or shared.


