
Market Overview
| Study Period | 2020 - 2031 |
|---|---|
| Forecast Data Period | 2026 - 2031 |
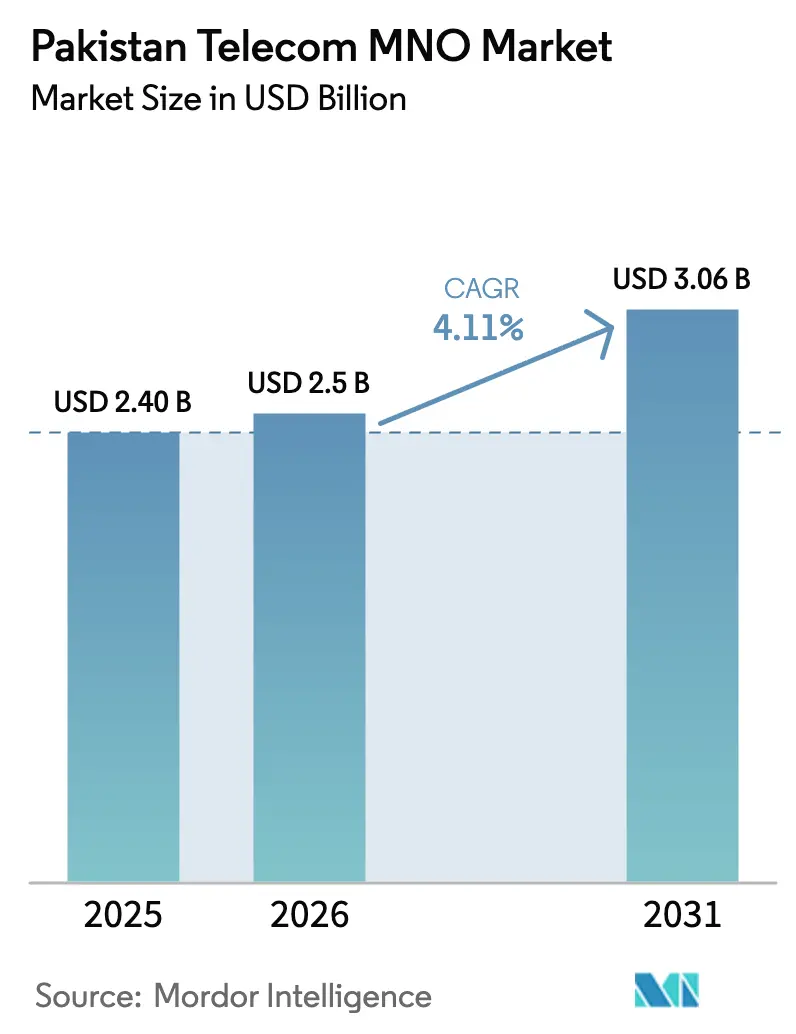
| Base Year Market Size (2025) | USD 2.40 Billion |
| Market Size (2026) | USD 2.5 Billion |
| Market Size (2031) | USD 3.06 Billion |
| Growth Rate (2026 - 2031) | 4.11% CAGR |
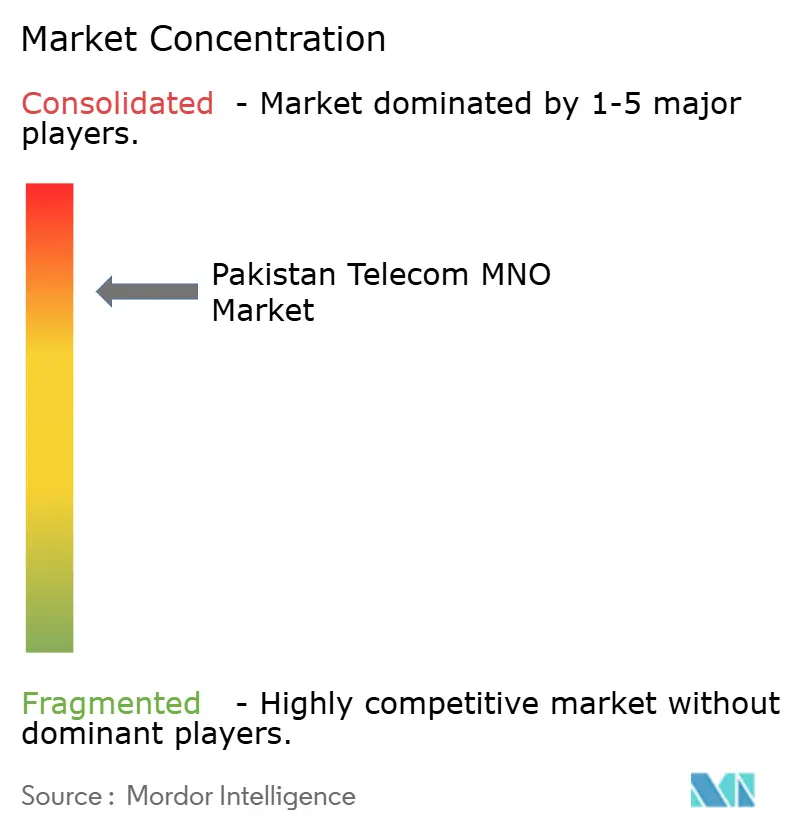
| Market Concentration | High |
Major Players *Disclaimer: Major Players sorted in no particular order Image © Mordor Intelligence. Reuse requires attribution under CC BY 4.0. | |
Pakistan Telecom MNO Market Analysis by Mordor Intelligence
Pakistan Telecom MNO Market size in 2026 is estimated at USD 2.5 billion, growing from 2025 value of USD 2.40 billion with 2031 projections showing USD 3.06 billion, growing at 4.11% CAGR over 2026-2031.
This healthy trajectory reflects sustained data consumption growth, the scheduled June 2025 5G launch, and regulator-driven quality-of-service mandates that are compelling operators to accelerate network upgrades. Rapid 4G migration, rising smartphone penetration, and an expanding digital-payments ecosystem are lifting average data usage per subscriber. At the same time, operators face a tight squeeze between dollar-denominated spectrum fees and rupee volatility, forcing careful tariff recalibration and energy-efficiency investments. Enterprise demand for private LTE and IoT connectivity in Pakistan’s industrial corridors is opening new, higher-margin revenue streams that diversify away from low-ARPU consumer voice. Intensifying competition among the four national MNOs, coupled with looming market consolidation through the proposed PTCL-Telenor transaction, underscores the need for differentiated digital services, especially mobile financial solutions and content bundles.
Key Report Takeaways
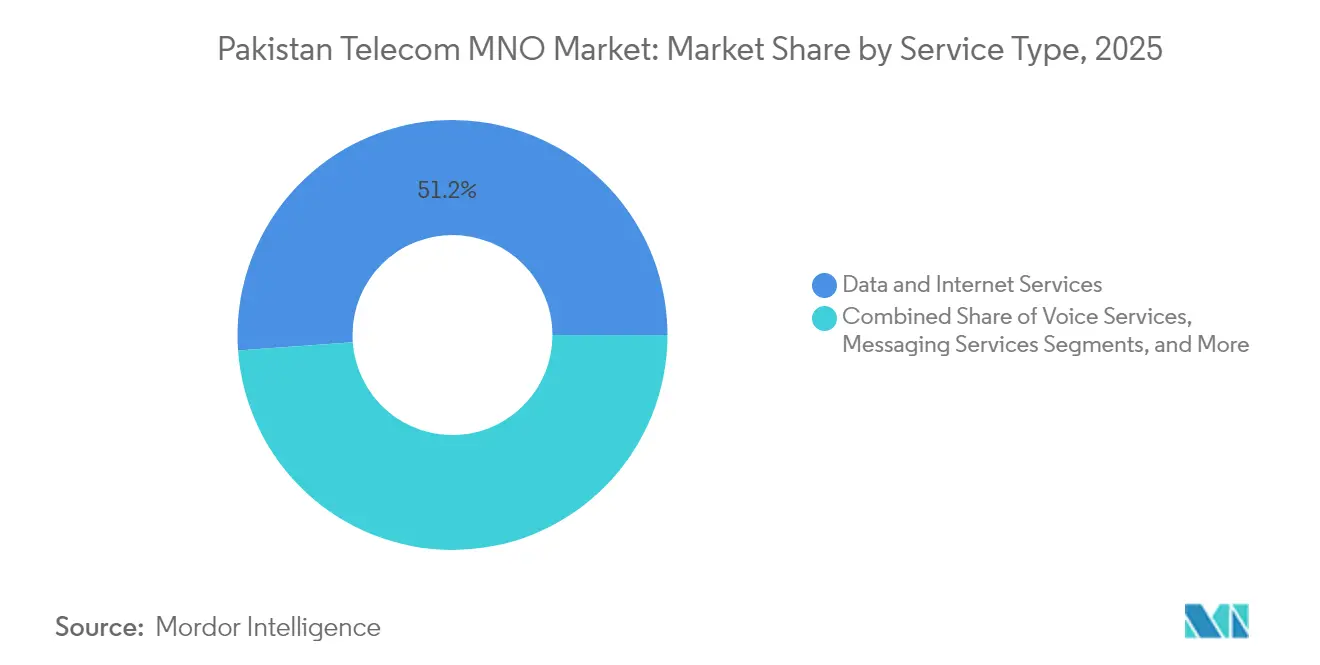
- By service type, data and internet services captured a 51.15% revenue share of the Pakistan telecom MNO market in 2025, whereas IoT and M2M services are advancing at a 4.18% CAGR through 2031.
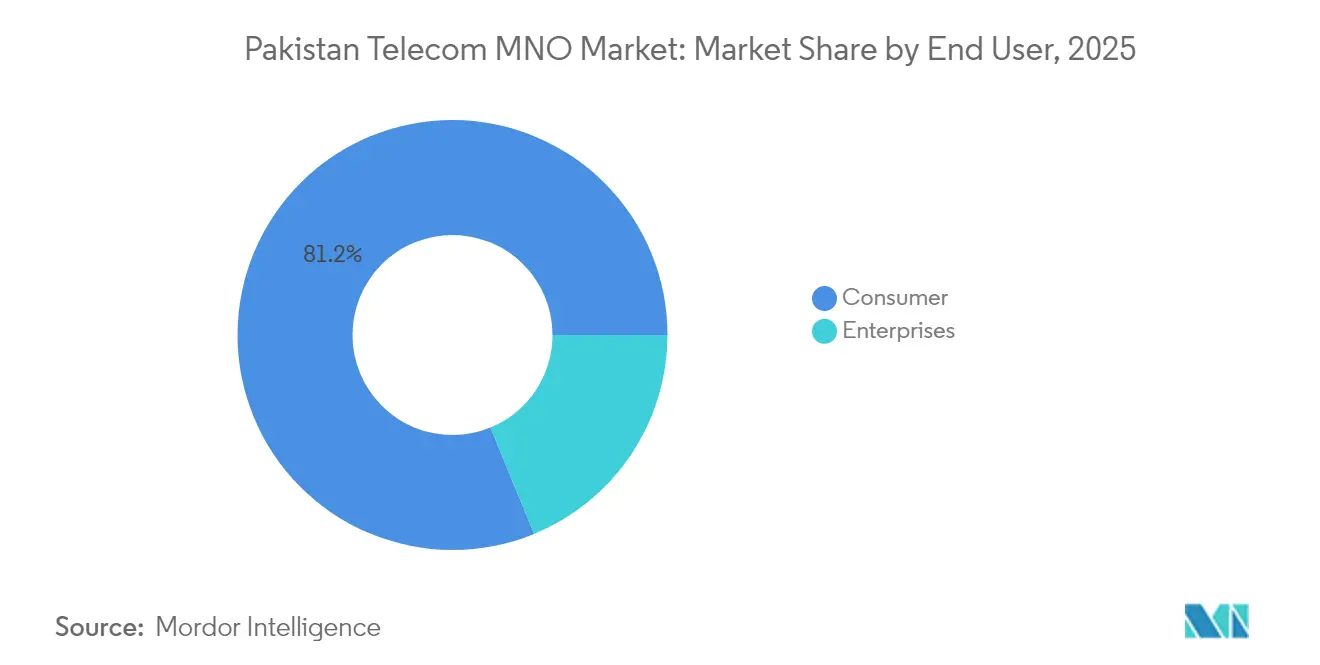
- By end user, consumer connections held 81.20% of the Pakistan telecom MNO market size in 2025, while enterprise subscriptions are expanding at a 4.59% CAGR over the forecast horizon.
Note: Market size and forecast figures in this report are generated using Mordor Intelligence’s proprietary estimation framework, updated with the latest available data and insights as of 2026.
Pakistan Telecom MNO Market Trends and Insights
Drivers Impact Analysis*
| Driver | (~)% Impact on CAGR Forecast | Geographic Relevance | Impact Timeline |
|---|---|---|---|
| Rapid 4G/5G spectrum refarming and rollout commitments | +1.2% | National, with early deployment in Karachi, Lahore, Islamabad | Medium term (2-4 years) |
| Surge in mobile broadband consumption and digital-payments adoption | +1.5% | Urban centers expanding to tier-2 cities | Short term (≤ 2 years) |
| PTA-driven quality-of-service (QoS) enforcement boosting network CAPEX | +0.8% | National coverage areas, focused on network quality metrics | Medium term (2-4 years) |
| Enterprise push for private LTE/5G and IoT connectivity in manufacturing corridors | +0.6% | Industrial zones in Punjab, Sindh manufacturing hubs | Long term (≥ 4 years) |
| Growing diaspora traffic stimulating international voice and OTT bundles | +0.4% | Major urban centers with diaspora connections | Short term (≤ 2 years) |
| Nationwide fiber-to-tower programme unlocking backhaul bottlenecks | +0.7% | Rural and semi-urban areas, northern regions via CPEC | Long term (≥ 4 years) |
| Source: Mordor Intelligence | |||
Rapid 4G/5G Spectrum Refarming and Rollout Commitments
Jazz completed its nationwide 3G switch-off in November 2024, freeing 900 MHz and 2100 MHz blocks for 4G, while the Ministry of IT and Telecom approved a June 2025 commercial 5G launch covering 700 MHz, 2300 MHz, 2600 MHz, and 3500 MHz bands valued at USD 831.8 million [1]Tahir Amin, “Jazz to phase out 3G services,” Business Recorder, brecorder.com. Coordinated refarming increases spectral efficiency, lowers per-bit cost, and accelerates nationwide 4G population coverage toward the PTA’s 98% target.
Surge in Mobile Broadband Consumption and Digital-Payments Adoption
Average monthly data use climbed to 4.3 GB per subscriber in FY 2024-25, a 68.9% jump year over year, while mobile banking transactions hit 1.69 billion during the same period [2]Attia Naveed, “Digital-payments surge,” Daily Times, dailytimes.com.pk . JazzCash’s 48 million registered wallets confirm how integrating payments with connectivity boosts stickiness and lifts blended ARPU above the sector’s USD 1 baseline.
PTA-Driven Quality-of-Service Enforcement Boosting Network CAPEX
The Pakistan Telecommunication Authority routinely publishes city-level KPIs and has fined operators for sub-par call-drop ratios, pushing capital intensity above 30% of service revenue in 2024. PTA also recognized Zong as the top performer in voice and data, encouraging a virtuous investment race that lifts nationwide network reliability.
Enterprise Push for Private LTE/5G and IoT Connectivity in Manufacturing Corridors
Jazz Business has rolled out industrial routers, NB-IoT trackers, and edge-cloud analytics packages for exporters clustered around Lahore and Karachi port zones. Edge connectivity allows real-time quality control and predictive maintenance, translating into measurable productivity gains that justify premium tariffs and multi-year contracts.
Restraints Impact Analysis*
| Restraint | (~)% Impact on CAGR Forecast | Geographic Relevance | Impact Timeline |
|---|---|---|---|
| Rupee volatility inflating dollar-denominated spectrum fees | -1.1% | National impact on all licensed operators | Short term (≤ 2 years) |
| Energy-cost spikes eroding EBITDA margins of tower/edge sites | -0.9% | National, particularly affecting rural tower operations | Medium term (2-4 years) |
| Delayed USF disbursements slowing rural coverage targets | -0.3% | Rural and underserved areas nationwide | Medium term (2-4 years) |
| Grey-routing via OTT side-loading curbing international call revenues | -0.5% | Urban centers with high OTT adoption rates | Short term (≤ 2 years) |
| Source: Mordor Intelligence | |||
Energy-Cost Spikes Eroding EBITDA Margins of Tower and Edge Sites
Average utility tariffs rose 29% in FY 2024-25, and diesel costs increased a further 16%, inflating network OPEX by roughly PKR 18 billion across the four licensees. Hybrid solar-battery retrofits are underway but carry high upfront costs, slowing break-even and stretching balance sheets already burdened by foreign-currency debt.
Rupee Volatility Inflating Dollar-Denominated Spectrum Fees
The rupee lost 17% against the USD in 2024, forcing operators to find an extra PKR 44 billion to meet annual license-renewal installments pegged to the greenback [3]Kalbe Ali, “Telcos protest dollar-linked license fees,” Dawn, dawn.com. Operators warn that ARPU must rise to at least USD 1.5 to sustain capex requirements for 5G rollout without jeopardizing debt covenants.
*Our forecasts treat driver/restraint impacts as directional, not additive. The impact forecasts reflect baseline growth, mix effects, and variable interactions.
Segment Analysis
By Service Type: Data Services Sustain Dominance while IoT Gains Momentum
Data and internet services controlled a 51.15% share of the Pakistan telecom MNO market in 2025 and will remain the revenue anchor through 2031. Voice continues to contribute meaningful cash flows despite usage declines as operators pivot toward diaspora-oriented international bundles priced in hard currency. IoT and M2M connections represent only 1.3% of SIMs today but are growing fastest at a 4.18% CAGR. The agricultural cold-chain, smart metering, and fleet-tracking verticals are early adopters, and regulator-approved e-SIM frameworks should improve provisioning efficiency. Messaging revenue is shrinking because free OTT applications substitute SMS, yet bundled enterprise A2P services such as one-time-password delivery still generate sticky margins. OTT and PayTV gains reflect operator platforms that aggregate local dramas and sports rights, creating upsell paths beyond connectivity. These shifts confirm that data monetization, IoT enablement, and content bundling constitute the three pillars for sustaining top-line growth in a low-ARPU environment.
The IoT opportunity also elevates the importance of edge computing and narrowband spectrum allocations. Operators capable of integrating connectivity, devices, and analytics hold a first-mover advantage with export-oriented manufacturers subject to strict ISO traceability. In this context, the Pakistan telecom MNO market size for IoT services could surpass USD 191 million by 2031, albeit from a small base. Meanwhile, persistent rupee weakness adds urgency for operators to localize device supply chains to mitigate forex exposure, reinforcing the strategic value of domestic assembly partnerships.


By End User: Consumer Base Remains Foundation while Enterprise Accelerates
Consumers accounted for 81.20% of the Pakistan telecom MNO market share in 2025, translating into 193 million active SIMs. Smartphone penetration now exceeds 56%, and 4G users represent nearly 60% of total subscribers. Nonetheless, enterprise lines are expanding at a 4.59% CAGR, outpacing the overall subscriber base. Demand stems from manufacturers, logistics providers, and financial institutions that need guaranteed throughput, dedicated SLAs, and secure IoT overlays. The Universal Service Fund (USF) disbursed PKR 141.66 billion to expand rural fiber and LTE coverage, indirectly benefiting enterprise customers operating in secondary cities and export-processing zones.
Corporate digitization further lifts data center and cloud colocation demand, widening opportunities for operators with integrated connectivity-plus-cloud propositions. Jazz’s enterprise segment already delivers mid-teens EBITDA margins, well above the group’s consumer average. Over the forecast period, enterprise ARPU is projected to climb toward USD 21 per month, mitigating the chronic low consumer ARPU that hovers just under USD 1. The Pakistan telecom MNO industry, therefore, views enterprise engagement not merely as diversification but as a margin-accretive imperative.
Geography Analysis
Punjab and Sindh provinces generate almost 69.20% of sector revenue, thanks to dense urban clusters and relatively high disposable incomes. Punjab alone hosts 33% of total cell sites, and average 4G downlink rate of 19.9 Mbps in H1 2024, ranked highest nationwide. Faisalabad recorded peak speeds of 22 Mbps, underscoring the correlation between fiberized backhaul and throughput. Karachi maintains the greatest subscriber base but grapples with right-of-way delays that slow tower builds and cap spectral efficiency gains.
Khyber Pakhtunkhwa and Balochistan together account for just 11.20% of sector revenue, yet represent the largest untapped rural population. The USF’s 400-kilometer fiber-to-tower program, completed in December 2024, delivered backhaul to 646 remote sites, cutting diesel reliance by 18% and enabling LTE expansion. Operators continue to deploy solar-hybrid power systems in rugged, off-grid terrain, although security concerns inflate insurance premiums and extend project cycles.
The 820-kilometer cross-border fiber link with China has upgraded northern region connectivity, lowering latency for Gilgit-Baltistan e-commerce traffic and creating redundancy against submarine-cable outages. Upcoming Starlink service, slated for December 2025, may offer satellite backhaul for mountainous districts, though its PKR 25,000 (USD 146) monthly fee restricts mass uptake. Consequently, terrestrial MNOs maintain a price advantage in sparsely populated zones, provided they continue to leverage USF subsidies and shared-tower models to contain deployment costs.
Regulatory Landscape
Pakistan telecom MNO operations are governed by the Pakistan Telecommunication Authority (PTA) under the Pakistan Telecommunication (Re-organization) Act, 1996, with licensing, spectrum management, and service-quality oversight shaping operator capex and rollout priorities. In January 2025, PTA finalized the 5G auction timetable aligned with a June 2025 commercial launch plan, anchoring operator investment decisions around the 700 MHz, 2300 MHz, 2600 MHz, and 3500 MHz bands.
In 2026, the policy agenda broadened beyond spectrum toward infrastructure and consumer protection. The Pakistan Telecommunication (Re-organization) (Amendment) Bill, 2026 advanced with a focus on Right of Way provisions to reduce deployment friction for fiber and towers, while PTA issued new instruments such as the Subscribers Antecedents Verification (Amendment) Regulations, 2026 and Local Peering and Internet Exchange Point Regulations, 2026. PTA also maintained active enforcement, including March 2026 directives for a free balance-save service to limit unintended data charges and mid-2026 actions against illegal sale of telecom user data, which is raising compliance expectations around customer protection and data governance.
Competitive Landscape
Pakistan’s telecom sector is a concentrated four-player arena where Jazz commands 66.4 million subscribers, Zong holds roughly 26%, and Ufone and Telenor share the remainder. The proposed PTCL-Telenor integration, financed by a USD 400 million IFC-led tranche, would merge Ufone’s mobile assets with Telenor’s 45 million customers and 13,000 towers, reducing the field to three national licensees. Jazz’s cumulative USD 9.6 billion capital outlay since 2016 underscores the investment threshold required for leadership, while VEON’s launch of ROX, a lifestyle-centric brand, signals a pivot toward digital engagement tailored to Pakistan’s under-30 demographic.
Competition increasingly revolves around spectrum depth, network quality scores, and value-added ecosystems. Zong’s 10×10 MHz holdings in both 1800 MHz and 2100 MHz bands underpin its “No.1 voice and data” award from PTA, whereas Jazz leverages its mobile-money scale to cross-sell loans and investments. PTCL Group is betting on fiber backhaul and cloud hosting to bundle end-to-end digital services for SMEs. Against this backdrop, energy cost inflation and FX liabilities drive collaborative tower sharing; Jazz and Zong already co-locate on 6,200 sites, and new passive-infrastructure joint ventures are under evaluation.
Regulatory scrutiny will intensify post-merger to safeguard consumer welfare. PTA’s draft Cyber Security Strategy 2023-2028 mandates ISO 27001 certification, centralized threat-intelligence sharing, and network-function-virtualization hardening, all of which raise compliance expenditure. Operators that can internalize these costs while sustaining capex on 5G and rural coverage are better positioned to defend share.
Pakistan Telecom MNO Industry Leaders
Jazz (Pakistan Mobile Communications Ltd)
Zong (CMPak)
Telenor Pakistan
Ufone (PTCL Group)
Special Communications Organization (SCO)
- *Disclaimer: Major Players sorted in no particular order

Market Opportunities and Future Outlook
Network consolidation creates a near-term whitespace around integration-led network modernization and differentiated bundles. The July 1, 2026 completion of the Telenor Pakistan merger into Ufone (PTML), following regulatory and court approvals, formed a scaled challenger with an integrated footprint that can rationalize overlapping sites and refarm spectrum toward higher-capacity 4G/5G layers. That shift increases the bar for quality-led share gains and supports demand for backhaul fiberization and automation that aligns with tighter QoS metrics already emphasized by PTA.
A set of regulatory and ecosystem moves also points to monetization lanes beyond basic consumer data. PTA consultations on new licensing regimes, including MVNOs and inflight telecommunication satellite services, suggest room for additional service models and wholesale partnerships that can monetize MNO coverage, core-network assets, and enterprise-grade SLAs. On the infrastructure side, the government focus on addressing Right of Way constraints through the 2026 Amendment Bill supports faster tower and fiber deployment, while PTA directives to fast-track 5G rollout add urgency to convert device bases and introduce premium tiers; Zong enabling 5G on iPhones (May 2026) illustrates how handset ecosystem readiness can translate into more addressable 5G demand and expanded bundling across content, fintech, and enterprise connectivity.
Recent Industry Developments
- July 2026: Islamabad High Court formally approved the merger of Telenor Pakistan into Pak Telecom Mobile Limited (PTML), with Telenor Pakistan ceasing to exist as a separate legal entity on July 1, 2026. The regulatory-leaning consolidation of a major operator strengthens the market position and creates a stronger combined challenger with a ~35.9% share, enabling scale and network synergy to accelerate 5G and digital-service rollout.
- May 2026: Zong announced official enablement of 5G services on iPhones in Pakistan via the iOS 26.5 update. The 5G device ecosystem acceleration supports broader 5G uptake and monetization through smartphone-led customer migration and bundled services.
- March 2026: Jazz officially launched 5G services following PTA license award, with 180 sites live in major cities. The first mover 5G deployment among MNOs after the license strengthens Jazzs leadership position and enables new digital services revenue streams.


Research Methodology Framework and Report Scope
Market Definition and Coverage
For this methodology, the market covers telecom services provided by mobile network operators in Pakistan, measured as service revenue from consumer and enterprise connectivity. This includes voice, mobile data, messaging, and cellular IoT-type connectivity.
Scope exclusions: It excludes handset sales, independent tower leasing, and pure content streaming revenue that is not billed as a telecom service.
Segmentation Overview
- Overall Telecom Revenue and ARPU
- Service Type
- Voice Services
- Data and Internet Services
- Messaging Services
- IoT and M2M Services
- OTT and PayTV Services
- Other Services (VAS, Roaming and International Services, Enterprise and Wholesale Services, etc.)
- End-user
- Enterprises
- Consumer
Data Sources, Market Sizing, and Validation
Desk Research
To build the base structure, we start with public telecom statistics and regulatory disclosures that describe sector performance over time. Key inputs are taken from sources such as Pakistan Telecommunication Authority annual reports, Pakistan Bureau of Statistics releases, ITU indicators, and State Bank of Pakistan publications (especially for currency trends and investment context).
We then complement this with company filings, investor presentations, operator announcements, and reputed press coverage that document tariff changes, network rollouts, and subscriber movement. In a few cases, we also use paid subscriptions for company financials and intelligence, patent databases, and shipment-level import and export views, mainly to cross-check unusual swings and to fill missing year splits. The sources listed here are illustrative only, and additional public and paid references were used for data collection, validation, and clarification.
Primary Interviews and Surveys
Primary checks were carried out with operator-side professionals, telecom distributors and channel partners, enterprise connectivity buyers, and sector advisors, so that assumptions behind usage, pricing, and adoption reflect current market behavior. We also used these discussions to confirm how prepaid and postpaid mixes are shifting, what drives ARPU in practice, and where network expansion is still constrained by costs or policy.
Distribution of primary research fieldwork respondents
| Company type | Respondent position | Region |
|---|---|---|
| Top tier: 33% | CXOs: 15% | APAC: 46% |
| Mid tier: 49% | Functional/Unit leaders: 34% | EMEA: 34% |
| Smaller Players: 18% | Managers: 51% | Americas: 20% |
Market-Sizing & Forecasting
Market sizing is built using a top-down demand reconstruction. Subscriber base, SIM connections, and service penetration are translated into revenue pools using ARPU and usage-led price points. The core model is anchored on telecom revenue signals, and then refined using operator-level cues so the total stays tied to what the market can realistically spend.
In practice, inputs such as total subscribers, broadband connections (mobile and fixed as a context check), 3G and 4G population coverage, ARPU trends, and average data usage per subscription are treated as the main fingerprints that explain revenue change year to year. Where public data is reported in local currency, conversions are handled using consistent period-average exchange rates, followed by an inflation and pricing sanity check using the same time window.
Forecasting is done using scenario analysis supported by trend fitting on ARPU and subscriber growth. Adoption and pricing paths are reviewed with primary experts before finalizing the base case. Bottom-up approximations are used selectively, for example, sampled plan pricing multiplied by estimated active user volumes, supported by channel checks on recharge behavior, and then used to adjust totals when reported splits show gaps.
Data Validation & Update Cycle
Outputs are validated through triangulation across independent signals, including regulator-reported sector revenue, subscriber and broadband trajectories, and network footprint indicators such as 4G-supported sites and coverage. When a variance appears, we break down the driver first into price, usage, and subscriber mix before accepting it in the model.
A second analyst review is completed for assumption logic, year alignment, and currency handling, followed by a final pass before sign-off to catch late-breaking changes. Reports are refreshed annually, and interim updates are triggered when material events occur, including major tariff resets, policy decisions that affect spectrum and rollout, or sharp currency movements that change the USD view.
Mordor Intelligence's Pakistan Telecom Market Size Measured Against Other Published Estimates
It is common to see different market values for Pakistan telecom because studies do not always use the same revenue boundary, the same service set, or the same year timing. Differences also show up when assumptions for ARPU movement and subscriber activity are not checked against regulator totals.
By tracking sector revenue signals, subscriber and broadband trajectories, and then refreshing currency timing assumptions, Mordor Intelligence keeps the estimate aligned to telecom operator service revenue rather than adjacent digital content or infrastructure income, which can shift the headline value.
Benchmark comparison
| Source | Market Size | Gaps in Research Methodology |
|---|---|---|
| Mordor Intelligence | USD 2.40 B (2025) | |
| Industry Association A | USD 3.10 B (2025) | Often closer to the full telecom sector headline, which can fold in fixed-line and broader ecosystem revenue, and may apply a single conversion point that amplifies the USD value in volatile currency years. |
| Trade Journal B | USD 2.00 B (2024) | Typically relies on a one-year operator revenue snapshot and may exclude value uplift from data usage growth and tariff resets, which can understate the transition from voice-heavy to data-led spending. |
The comparison shows that the spread is mostly explained by what is counted as telecom service revenue and how currency timing is applied. Keeping the model tied to subscriber activity, ARPU direction, and regulator-reported totals makes the final number easier to trace and repeat when new data is released.


Key Questions Answered in the Report
How large is the Pakistan telecom MNO market in 2026?
The market stands at USD 2.5 billion in 2026 and is projected to reach USD 3.06 billion by 2031.
What is driving revenue growth for mobile operators?
Rapid data-usage growth, upcoming 5G services, and expanding fintech ecosystems are the primary growth engines.
Which service type holds the largest share?
Data and internet services represent 51.15% of 2025 revenue.
When will 5G services launch commercially?
The Ministry of IT and Telecom has set June 2025 for nationwide 5G rollout.
How will the PTCL-Telenor merger affect competition?
The merger will reduce national MNOs to three, raising market concentration to roughly 62%.
What challenges threaten operator profitability?
Dollar-denominated spectrum fees, energy-price inflation, and cyber-security compliance costs weigh on margins.
Page last updated on:


