
Market Overview
| Study Period | 2020 - 2031 |
|---|---|
| Market Size (2026) | USD 34.08 Billion |
| Market Size (2031) | USD 45.72 Billion |
| Growth Rate (2026 - 2031) | 6.05 % |
| Fastest Growing Market | Asia-Pacific |
| Largest Market | Asia-Pacific |
| Market Concentration | Low |
Major Players *Disclaimer: Major Players sorted in no particular order Image © Mordor Intelligence. Reuse requires attribution under CC BY 4.0. | |
Packaging Tapes Market Analysis by Mordor Intelligence
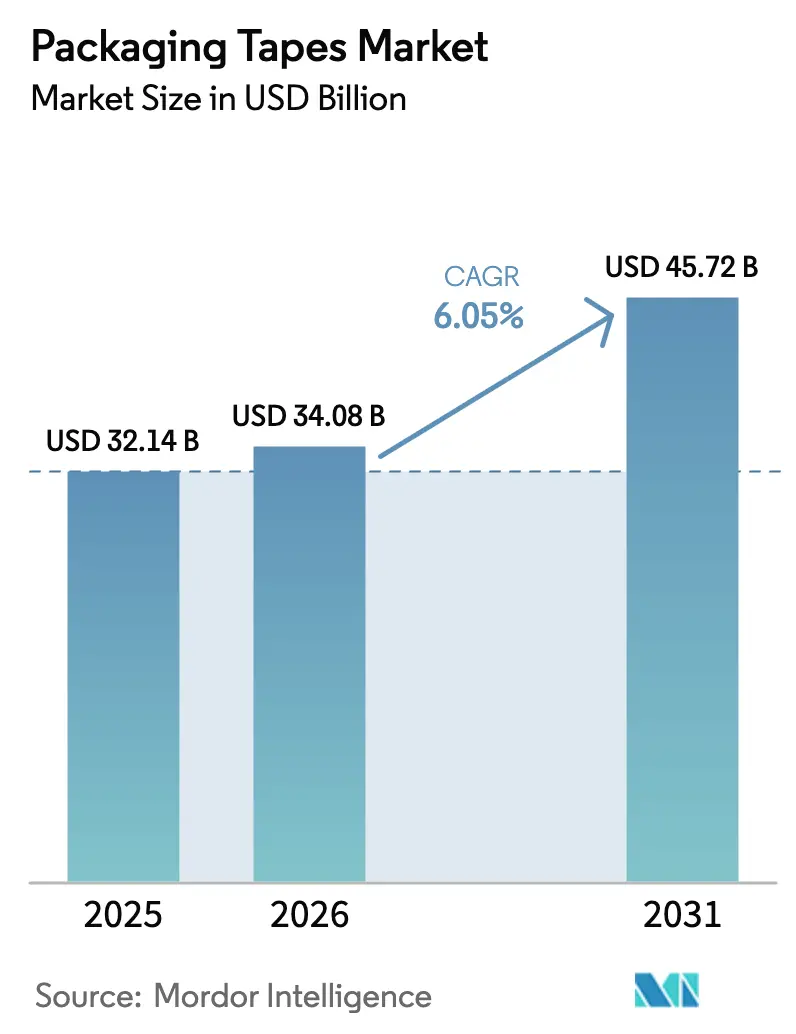
Packaging Tapes Market size in 2026 is estimated at USD 34.08 billion, growing from 2025 value of USD 32.14 billion with 2031 projections showing USD 45.72 billion, growing at 6.05% CAGR over 2026-2031. This trajectory mirrors rapid e-commerce parcel growth, steady cold-chain expansion, and automation investments that streamline case-sealing operations. Brand owners are installing right-sized carton lines that trim 10 to 50 cents of material per parcel while lifting throughput, which keeps the packaging tapes market on a predictable growth path. Plastic-based tapes still dominate daily fulfillment tasks, yet paper tapes are gaining traction as OECD plastic-tax regimes reshape cost models and corporations target recycled-content thresholds. Asia Pacific remains the epicenter for capacity additions, aided by India’s push to scale its USD 200 billion packaging sector and China’s electronics boom that relies on pressure-sensitive seals for static-sensitive parts.
Key Report Takeaways
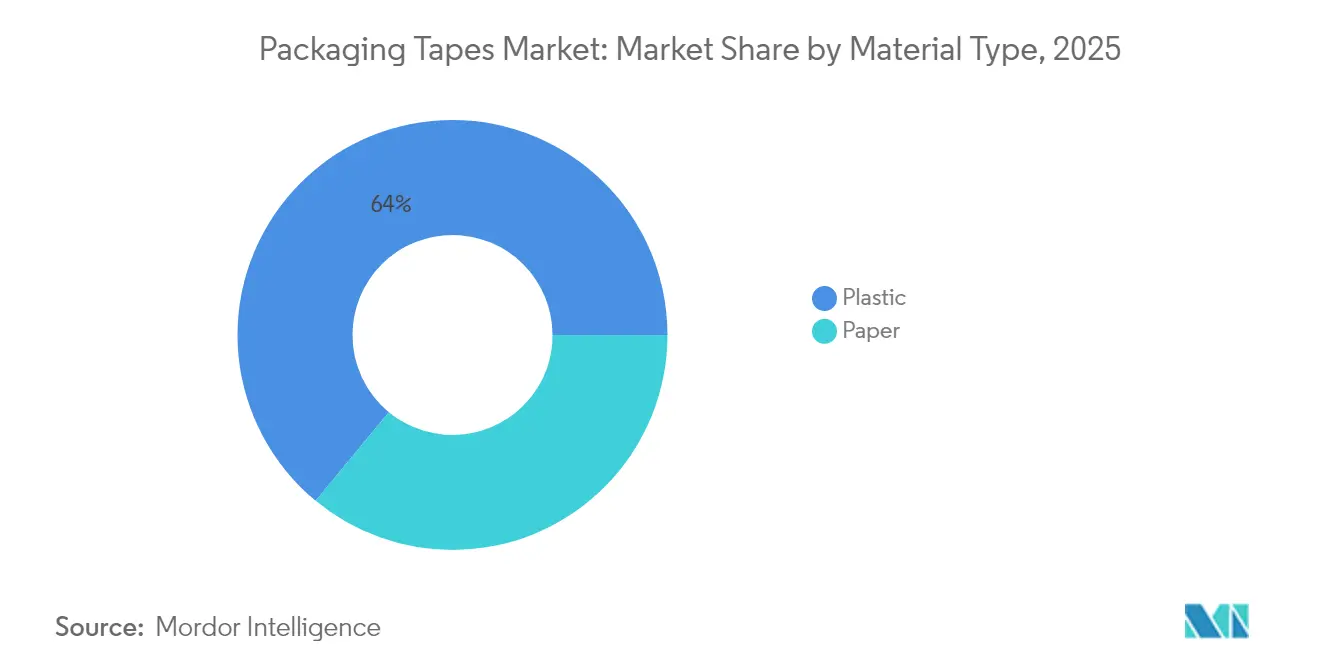
- By material type, plastic substrates led with 64.02% of the packaging tapes market share in 2025, while paper tapes are poised to grow at a 6.79% CAGR through 2031.
- By adhesive type, acrylic systems commanded 44.12% share of the packaging tapes market size in 2025; rubber-based chemistries record the fastest 6.58% CAGR.
- By product form, strapping and bundling lines captured 58.63% revenue share in 2025; carton-sealing tapes are projected to expand at 6.83% CAGR.
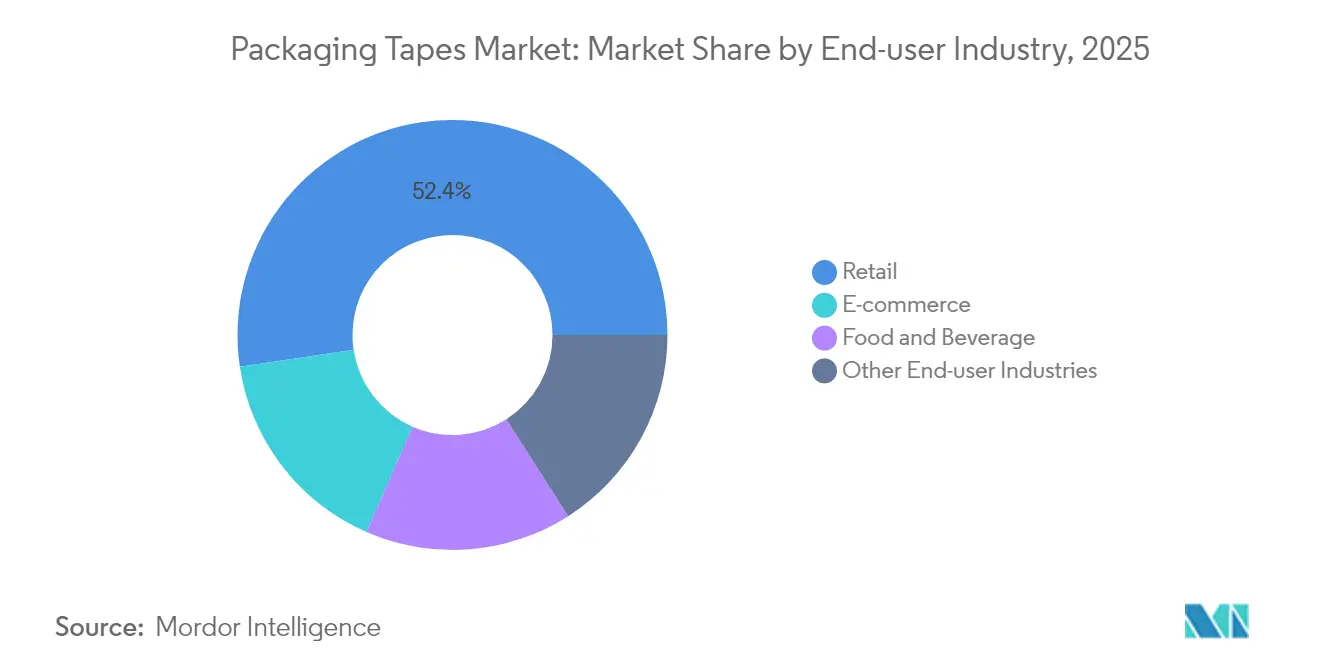
- By end-user industry, retail accounted for 52.35% of the packaging tapes market size in 2025, whereas e-commerce is advancing at a 6.88% CAGR.
- By geography, Asia Pacific held a 39.10% share in 2025 and is expected to grow at a 7.05% CAGR to 2031.
Note: Market size and forecast figures in this report are generated using Mordor Intelligence’s proprietary estimation framework, updated with the latest available data and insights as of 2026.
Market Trends and Insights
Drivers Impact Analysis of Packaging Tapes Market*
| Drivers | (~) % Impact on CAGR Forecast | Geographic Relevance | Impact Timeline |
|---|---|---|---|
| E-commerce carton-volume boom in Tier-2 and Tier-3 cities | +1.8% | Asia Pacific, Latin America | Medium term (2-4 years) |
| Demand spikes from temperature-controlled grocery fulfillment centers | +1.2% | Global; early gains in North America, Europe | Short term (≤ 2 years) |
| Shift from manual to automated case-sealing lines | +1.5% | Global, concentrated in manufacturing hubs | Medium term (2-4 years) |
| Retailers’ private-label expansion in emerging markets | +0.9% | Asia Pacific, Latin America, MEA | Long term (≥ 4 years) |
| OEM specification of quiet-release tapes for worker safety | +0.6% | North America, Europe | Short term (≤ 2 years) |
| Source: Mordor Intelligence | |||
E-commerce Carton-Volume Boom Drives Tier-2 and Tier-3 Penetration
Secondary-city logistics hubs in India, Brazil, and Indonesia are becoming critical nodes in e-commerce networks. India’s e-commerce packaging spending is projected to climb from USD 451.4 million in 2019 to USD 975.4 million in 2025, raising localized demand for pressure-sensitive seals[1]. Fulfillment centers are pairing machine-learning box-sizing algorithms with paper-reel dispensers that cut corrugate usage by 35% in North America and Europe. These installations reduce void fill, shorten pick times, and sustain double-digit parcel throughput, spurring procurement managers to lock in long-term tape contracts. Asian suppliers such as tesa have opened Mumbai and Bengaluru service hubs to stay within 24-hour reach of electronics OEMs now shifting to tier-2 industrial corridors.
Demand Spike from Temperature-Controlled Grocery Fulfillment Centers
Supermarket chains are rolling out micro-fulfillment assets that must keep perishables between -25 °C and +8 °C across last-mile routes. UPS added four Temperature True lines in 2024, tailoring Med 100 cartons for ambient medicines and Med 400 for frozen biologics. These box styles need acrylic or rubber adhesives that retain tack below -20 °C, prompting a shift away from hot-melt grades that crack at sub-zero loading docks. The trend penetrates Latin America and Southeast Asia where urban grocery startups sign subscription deals for tapes pre-qualified under ISTA 7D cold-chain protocols.
Shift From Manual to Automated Case-Sealing Lines
Western converters are replacing handheld dispensers with high-speed extruders that cut trim losses by 25% and allow continuous uptime. 3M’s VHB Extrudable Tape, launched in 2024, bonds instantly, dispenses on demand, and rewinds scrap for recycling. Case-sealer OEMs bundle predictive analytics that flag glue-line anomalies, which reduces downtime and adhesive waste. With the U.S. packaging machinery market tracking 8% annual growth through 2027, integrators forecast an 18-month payback on fully automated tape heads.
Retailers’ Private-Label Expansion in Emerging Markets
Regional grocers are adding private-label SKUs in packaged foods, beauty, and home care. These programs raise short-run volumes that require flexible carton sizes and branding tapes printed in smaller lots. Asian converters respond with digital printing and water-based inks certified to more than 5 wt% VOC, boosting regional sales for recyclable paper seals.
Restraints Impact Analysis of Packaging Tapes Market*
| Restraints | (~) % Impact on CAGR Forecast | Geographic Relevance | Impact Timeline |
|---|---|---|---|
| OECD-level plastic-packaging taxes | -1.4% | Europe, North America; spillover to APAC | Medium term (2-4 years) |
| VOC-emission caps on solvent-based acrylics | -0.8% | Global, stringent in developed markets | Short term (≤ 2 years) |
| Supply crunch of natural rubber due to disease outbreaks | -0.6% | Global, acute impact in Southeast Asia | Short term (≤ 2 years) |
| Carton-free shipping pilots by leading marketplaces | -1.1% | North America, Europe, expanding to APAC | Long term (≥ 4 years) |
| Source: Mordor Intelligence | |||
Carton-Free Shipping Initiatives Challenge Traditional Packaging Models
Amazon’s policy to eradicate 95% of plastic air pillows in North America and broaden Ships in Own Container protocols cuts tape consumption on certain SKUs. Its frustration-free program has eliminated 181,000 tons of excess material and avoided 307 million boxes since launch. Marketplace rivals now pilot on-demand paper-bagging machines that seal without adhesive, presenting a long-term volume drag for the packaging tapes market.
OECD-Level Plastic Packaging Taxes Reshape Material Selection
The UK’s Plastic Packaging Tax levies GBP 210.82 per tonne on containers with < 30% recycled content, generating GBP 276 million in its first fiscal year and pushing converters toward fiber-based tapes. Spain’s EUR 0.45/kg fee exerts parallel pressure specright.com. Germany plans a national tax framework by 2026, compounding EU plastic-levy obligations and accelerating trials of water-resistant kraft substrates. While paper tapes meet curbside recycling norms, suppliers still absorb higher pulp costs, compressing margins.
*Our forecasts treat driver/restraint impacts as directional, not additive. The impact forecasts reflect baseline growth, mix effects, and variable interactions.
Packaging Tapes Market Segment Analysis
By Material Type:
Plastic Dominance Challenged by Sustainable AlternativesPlastic substrates captured 64.02% of the packaging tapes market share in 2025 because BOPP films deliver high tensile strength, optical clarity, and low cost. BOPP seals overtake PVC in North American parcel centers, while rigid PVC persists in European pharma distribution due to chemical resistance. The packaging tapes market size for plastic grades is projected to reach USD 29.12 billion in 2031, though its share will erode as taxes bite.
Paper-based alternatives are growing 6.79% CAGR. Recyclability, curbside acceptance, and rising Kraft supply in Southeast Asia encourage adoption despite moisture concerns. Producers now add biodegradable barrier coatings that withstand 24-hour 90%-RH testing.

By Adhesive Type:
Acrylic Leadership Amid Rubber-Based InnovationAcrylic chemistries accounted for 44.12% of the packaging tapes market size in 2025, thanks to UV stability and compliance with more than 5 wt% solvent rules under EU BAT directives. Water-based acrylics also bond well to recycled corrugate, a rising substrate in Europe.
Rubber-based systems post the fastest 6.58% CAGR by leveraging styrenic block copolymers that maintain tack down to -25 °C. KRATON’s SIBS platform cuts organosolvent use 30%, meeting California’s Air Resources Board limits. Tex Year’s bio-based compostable rubber adhesive reaches 85% bio-content with 90% degradation in 180 days, suiting circular-economy packaging
By Product Form:
Industrial Applications Drive Strapping DominanceIndustrial shippers favor glass-filament or mono-oriented PET strapping tapes that seized 58.63% of the packaging tapes market share in 2025, protecting palletized white goods and steel coils in transit. Average pull strength surpasses 400 N, limiting load shift and damage claims.
Carton-sealing tapes will grow 6.83% CAGR as e-commerce SKUs proliferate. Automated inside-the-box labelers now apply narrow 38-mm rolls, 10 mm less than manual grades, saving as much as USD 200,000 annually in a 60-parcel-per-minute facility. 3M’s extrudable platform reinforces this trend by allowing precise bead placement and reclaiming trim waste
By End-User Industry:
Retail Leadership Amid E-Commerce AccelerationStore-level shelf prep, price-tagging, and back-room boxing kept retail ahead at 52.35% of the packaging tapes market size in 2025. Big-box chains added eco-logoed paper filler-seal tapes that double as tamper evidence, enhancing brand perception.
E-commerce now expands 6.88% CAGR, hitting 25.40% share by 2031 as same-day grocery orders soar. Amazon alone has removed over 2 million tons of packaging since 2015 by adopting machine-learning carton layouts, yet total parcel counts keep overall tape volumes rising. Pharmaceutical 3-pl logistics increase demand for cryogenic-certified tapes that survive dry-ice freight.
Geography Analysis
APAC Packaging Tapes Market
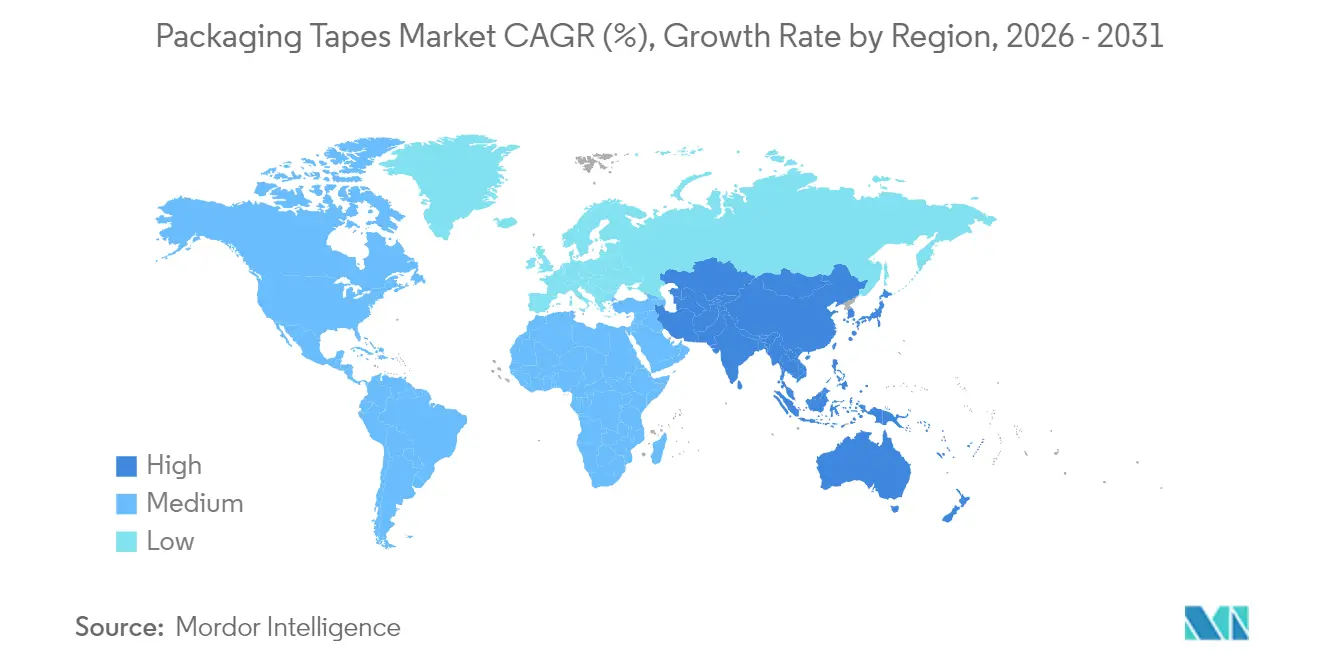
Asia Pacific held 39.10% of the packaging tapes market share in 2025, fueled by mobile-first retail and a sizable contract-manufacturing pipeline. Chinese converters supply antistatic BOPP tapes to smartphone plants in the Greater Bay Area, where 2024 output exceeded 250 million handsets.
North America Packaging Tapes Market
North America focuses on case-sealer automation to offset labor scarcity. The region introduces noise-reduced tapes that meet OSHA 75 dB limits, supporting ergonomic mandates. Amazon’s 95% plastic-air-pillow removal shifts uptake toward paper-based rolls sourced from U.S. kraft mills, stimulating domestic tape coating lines.
Europe Packaging Tapes Market
Europe’s stringent plastic taxes intensify trials of recycled-content films and solvent-free adhesives. Spain, France, and Italy replicate the UK levy, incentivizing fiber substrates and bumping up kraft-line utilization.
Value Chain Analysis
The packaging tapes value chain starts with upstream petrochemical and bio-based feedstocks that are processed into films and papers (notably BOPP, PVC, PET, and kraft) and into adhesive chemistries (acrylic, hot-melt, rubber-based). Raw-material pricing and availability, especially for polypropylene and acrylics, influence tape coaters' purchasing strategies and inventory policies, while natural-rubber tightness can affect rubber-based formulations. Tape manufacturers and coaters, including integrated players such as Nitto Denko, convert these inputs into jumbo rolls and specialty grades, then supply converters for slitting, printing, and private-label programs.
In the midstream, specialty converters and distributors tailor roll widths, print runs, and performance variants (quiet-release, cold-chain, antistatic) to end-user specifications. Downstream demand is supported by packaging-equipment OEMs and integrators that supply automated case-sealing heads, dispensers, and line analytics. Large end users such as e-commerce, retail, food and beverage, and industrial shippers typically buy through long-term supply agreements or preferred-vendor lists, with performance testing and compliance (including cold-chain protocols such as ISTA 7D referenced in the report context) shaping qualification cycles. Industry associations such as Afera and FIPAGO also influence specifications and best practices across film, adhesive, and gummed-paper tape ecosystems.
Competitive Landscape
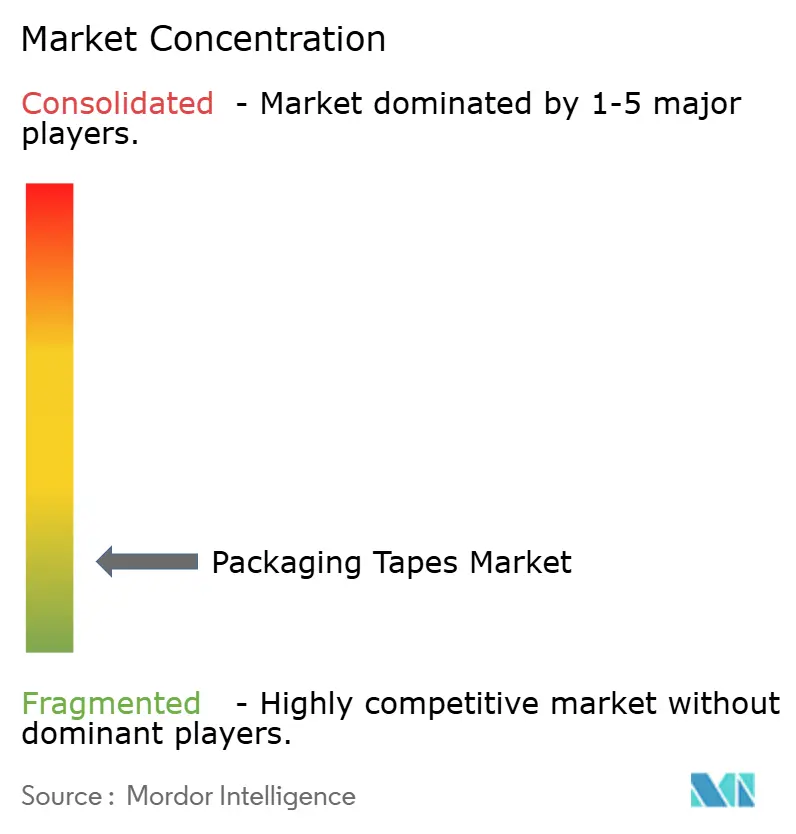
The packaging tapes market is highly fragmented and centers on a dozen global groups, yet regional specialists thrive on custom runs. 3M deepened its moat with the extrusion-ready VHB line that slashes waste by 25%, a decisive edge as brand owners target Scope 3 emissions. tesa teamed up with Snowflake to crunch production data across 14 plants, rolling out AI algorithms that cut unscheduled downtime by14%.
Packaging Tapes Industry Leaders
-
3M
-
tesa SE
-
Intertape Polymer Group Inc.
-
Nitto Denko Corporation
-
Berry Global Inc.
- *Disclaimer: Major Players sorted in no particular order
Packaging Tapes Market Companies Covered in this Report
- 3M
- Avery Dennison Corporation
- Berry Global Inc.
- CCT
- Essentra PLC
- Intertape Polymer Group Inc.
- Lohmann GmbH & Co. KG
- Nitto Denko Corporation
- Packman Packaging Pvt. Ltd.
- Pact Group Holdings
- PPM Industries SpA
- Saint-Gobain
- Scapa Group plc
- Shurtape Technologies LLC
- tesa SE
- Vibac Group
- Worthen Industries
Market Opportunities and Future Outlook
Sustainability-driven reformulation and substrate shifts create whitespace for recyclable, recycled-content, and fiber-forward solutions that still need to perform in high-speed automation and cold-chain applications. In Europe, the Packaging and Packaging Waste Regulation (EU) 2025/40 and related guidance from Afera have increased scrutiny on packaging design choices, supporting development of tapes that improve recyclability of corrugated systems and reduce contamination risk. The pressure is also visible in the report context through plastic-tax regimes (including the UK Plastic Packaging Tax) and corporate recycled-content targets, which together raise demand for water-based acrylics, solvent-reduction pathways, and paper tape systems that can run reliably on right-sized carton lines.
Capacity localization and electronics-linked supply chains remain another opportunity zone, particularly in Asia Pacific, where the report points to electronics production pull and ongoing capacity additions. In July 2026, Nitto Denko inaugurated a manufacturing and research facility in Kaohsiung, Taiwan, supported by an NT$4.48 billion investment, expanding PVC tape and electronic adhesive tape capabilities and signaling regional investment in high-performance tape production near semiconductor and automotive ecosystems. Separately, digital enablement is strengthening technical sales and specification work: 3M introduced its Ask 3M AI digital assistant in July 2026 to help customers navigate material comparisons and application guidance, supporting faster product selection and qualification workflows for converters and high-mix packaging operations.
Recent Industry Developments in Packaging Tapes Market
- July 2026: Intertape Polymer Group (IPG) launched a PCR Air Pillow Film made with 50 percent recycled content (35 percent PCR and 15 percent PIR) at a TRUE Zero Waste certified facility in the USA. The initiative expands IPG's sustainability offerings and supports waste-certification credentials across global supply chains.
- July 2026: Nitto Denko inaugurated a new manufacturing and research facility in Kaohsiung, Taiwan (PVC tape and electronic adhesive tape capacity expansion). The expansion adds capacity in Asia-Pacific and strengthens supply security for electronics and PV/semiconductor related tape applications near key manufacturing hubs.
- April 2026: Berry Global (Berry Global and Amcor merger) completed a transformational merger with Amcor. The deal creates a global packaging leader with an expanded portfolio, and supports cross-sell across nutrition, health, beauty, and wellness segments.
Packaging Tapes Market Report Scope and Research Methodology
Market Definition and Coverage
This market covers tapes used to seal, bundle, protect, and unitize packages across industrial and consumer shipping, with demand tracked across major materials, adhesive systems, and packaging use cases in day-to-day distribution.
Scope exclusions: We exclude non-packaging specialty tapes mainly sold for electrical insulation, medical use, or automotive interior harnessing, where packaging is not the primary end use.
Segments Covered in This Report
- By Material Type
- Plastic
- Paper
- By Adhesive Type
- Acrylic
- Hot-Melt
- Rubber-Based
- Other Adhesive Types
- By Product Form
- Carton-Sealing Tapes
- Masking and Painter's Tapes
- Strapping and Bundling Tapes
- By End-user Industry
- E-commerce
- Food and Beverage
- Retail
- Other End-user Industries
- By Geography
- Asia-Pacific
- China
- India
- Japan
- South Korea
- Rest of Asia-Pacific
- North America
- United States
- Canada
- Mexico
- Europe
- Germany
- United Kingdom
- France
- Italy
- Rest of Europe
- South America
- Brazil
- Argentina
- Rest of South America
- Middle-East and Africa
- Saudi Arabia
- South Africa
- Rest of Middle-East and Africa
- Asia-Pacific
Data Sources, Market Sizing, and Validation
Desk Research
Desk work starts by mapping how much packaging activity is happening, then linking it back to tape consumption. We reference public data series such as the UN Comtrade database for trade flows of tape related inputs and finished rolls, the US Census Bureau for e-commerce and shipment indicators, Eurostat for manufacturing and retail indicators, and the International Energy Agency for resin and energy context that affects conversion economics.
We also review packaging and logistics bodies and standard-setting sources such as ISO publications, plus peer reviewed papers on pressure sensitive adhesive performance and recyclability. To ground player and pricing context, we use company filings, investor decks, and reputable press coverage, then sanity check selected assumptions through paid subscriptions for company financials and intelligence, news and financials, patent databases, and where useful, shipment-level import and export records. The sources named above are illustrative, and many other public and paid references were also used for validation and clarification.
Primary Interviews and Surveys
Primary inputs were gathered through expert interviews and structured surveys with converters, packaging procurement teams, distributors, and logistics focused end users who see real buying patterns. We used these discussions to confirm how carton sealing lines are specified, how adhesive choices shift by climate and application, and which price and volume changes are actually holding across regions.
Distribution of primary research fieldwork respondents
| Company type | Respondent position | Region |
|---|---|---|
| Top tier: 28% | CXOs: 22% | APAC: 46% |
| Mid tier: 50% | Functional/Unit leaders: 21% | EMEA: 29% |
| Smaller Players: 22% | Managers: 57% | Americas: 25% |
Market-Sizing & Forecasting
Sizing is built using a top-down approach where packaging activity and trade linked supply signals are used to reconstruct the demand pool for packaging tapes by region, then filtered through usage intensity by end use. To keep it grounded, we corroborate totals with selective bottom-up approximations, such as sampled converter output checks, channel discussions, and volume-by-ASP calculations for common carton sealing formats, and we adjust when a gap shows up.
Key model inputs include parcel and e-commerce shipment growth, corrugated box and carton throughput indicators, the split of plastic versus paper tape in mainstream sealing, adhesive mix shifts between acrylic, hot-melt, and rubber based systems, and typical roll widths and consumption per carton in manual versus automated case sealing. Because price swings matter in this space, we also track resin linked input cost direction and conversion spreads, so ASP changes do not get overstated.
For forecasting, scenario analysis is used around logistics growth, automation adoption, and sustainability driven substitution into paper and water activated tapes, then a simple regression is run as a cross-check using shipment indicators and industrial production as the main explanatory variables. Where bottom-up inputs are thin in a country, we use proxy ratios from similar markets and re-check them with follow-up calls so the estimate remains reproducible.
Data Validation & Update Cycle
Validation is done through triangulation across independent signals, then through variance checks at region and segment level so outliers are not carried forward. Our team compares implied tape demand against packaging activity indicators, checks whether pricing steps match resin and energy direction, and reviews sharp shifts by adhesive or material to confirm they reflect real substitution rather than a modeling artifact.
Before sign-off, the model and write-up go through multi-step analyst reviews, and interviews are re-opened if a key assumption moves or a new data point creates a large gap. Reports are refreshed annually, and material events like major capacity changes or sudden raw material shocks can trigger interim updates. Right before delivery, a fresh pass is completed so clients receive the most current view available.
Mordor Intelligence's Packaging Tapes Market Sizing Compared With Other Published Estimates
Published market sizes for packaging tapes can look far apart even when the topic sounds similar, since scope choices and pricing logic are not consistent across studies. Differences usually come from what tape types get counted, whether the estimate is built from packaging activity signals or from broad adhesive tape totals, and how fast pricing is assumed to grow.
The main gap comes from folding in general-purpose duct and broader repair tapes, where Mordor Intelligence counts packaging tapes through carton-sealing, masking and painter's, and strapping and bundling demand linked to packaging end uses, with ASPs checked against conversion and raw material movements. Another common driver is refresh cadence and currency handling, since some figures keep a fixed base-year exchange rate while others roll forward current pricing without re-validating volume intensity in automated versus manual packing.
Benchmark comparison
| Source | Market Size | Gaps in Research Methodology |
|---|---|---|
| Mordor Intelligence | USD 34.08 B (2026) | |
| Trade Journal A | USD 78.50 B (2023) | This estimate appears to bundle a wider set of tape types, including duct and other multi-purpose formats, and it can therefore sit closer to a broad adhesive tape view rather than packaging-only demand tied to carton throughput. |
| Industry Brief B | USD 82.40 B (2024) | The number is materially higher, which can happen when the scope expands to more general sealing solutions and premium feature tapes, and when pricing progression is applied more aggressively without matching it to packaging activity and mix shifts. |
The spread mainly points back to scope discipline and the way price and volume are reconciled to real packaging signals. By keeping the demand pool anchored to packaging end uses and validating it with practical checks on format mix and ASP movement, the final value stays easier to trace and repeat when assumptions are updated.
Key Questions Answered in the Report
What is the current size of the packaging tapes market?
The packaging tapes market is valued at USD 34.08 billion in 2026 and is projected to reach USD 45.72 billion by 2031.
Which material segment leads the packaging tapes market?
Plastic substrates lead with 64.02% share in 2025, though paper tapes are the fastest-growing alternative at a 6.79% CAGR.
Why are acrylic adhesives dominant in packaging tapes?
Acrylic systems combine UV resistance, broad temperature tolerance, and compliance with global VOC caps, which secured 44.12% market share in 2025.
How will plastic packaging taxes affect tape selection?
OECD-level levies raise the cost of virgin-plastic tapes, accelerating adoption of recycled-content films and recyclable paper tapes that avoid the surcharge.
Which region offers the highest growth opportunity?
Asia Pacific commands 39.10% share and leads growth at a 7.05% CAGR, propelled by e-commerce expansion and manufacturing relocations into India and Southeast Asia.