
Packaging Resins Market Size and Share
Market Overview
| Study Period | 2020 - 2031 |
|---|---|
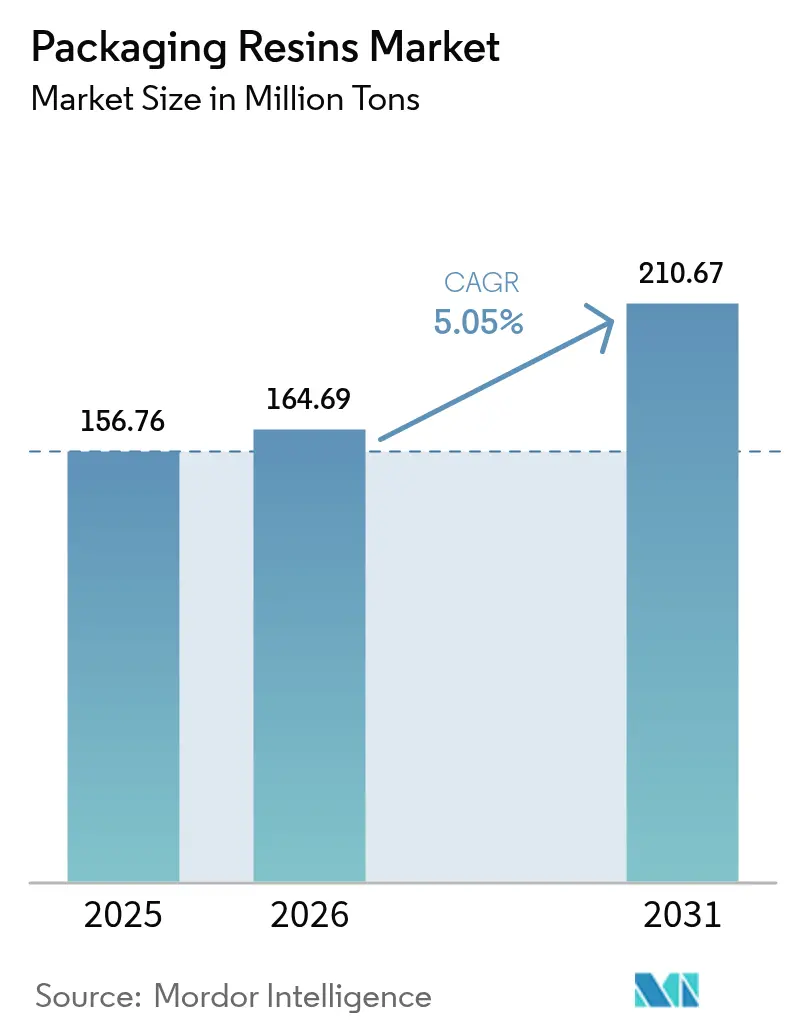
| Market Volume (2026) | 164.69 Million tons |
| Market Volume (2031) | 210.67 Million tons |
| Growth Rate (2026 - 2031) | 5.05 % |
| Fastest Growing Market | Asia Pacific |
| Largest Market | Asia Pacific |
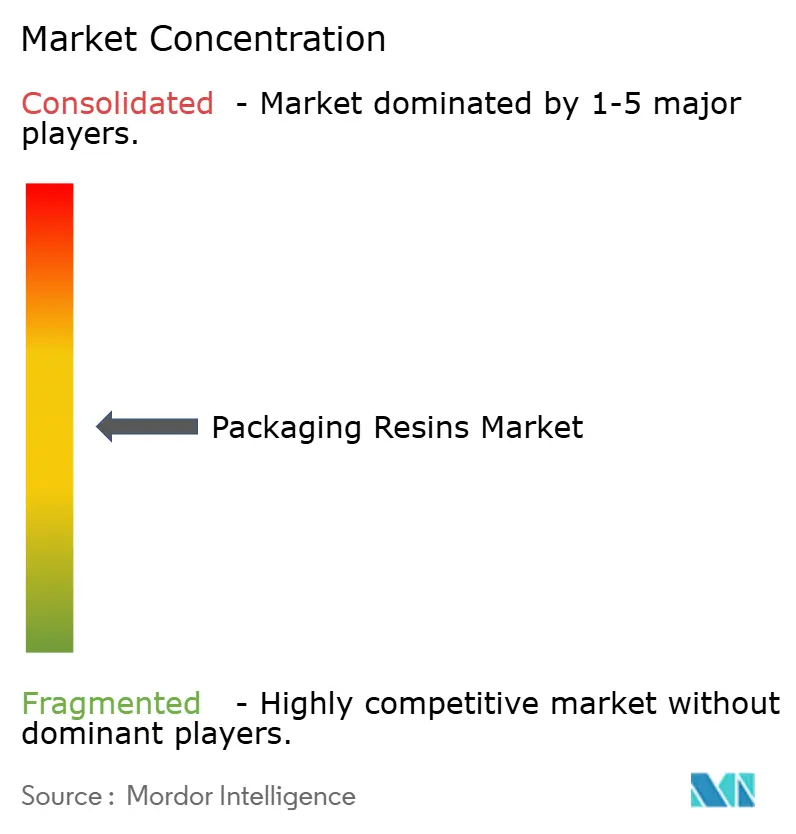
| Market Concentration | Medium |
Major Players *Disclaimer: Major Players sorted in no particular order Image © Mordor Intelligence. Reuse requires attribution under CC BY 4.0. | |
Packaging Resins Market Analysis by Mordor Intelligence
Packaging Resins market size in 2026 is estimated at 164.69 Million tons, growing from 2025 value of 156.76 Million tons with 2031 projections showing 210.67 Million tons, growing at 5.05% CAGR over 2026-2031. This steady expansion reflects resilient demand across food, beverage, healthcare, and e-commerce channels, ongoing material substitutions toward lighter structures, and accelerating investments in advanced recycling. Supply-side efficiencies—especially in Asia-Pacific—temper unit cost escalation even as feedstock volatility rises. Tighter global rules on recycled content stimulate resin modification work, while corporate decarbonization commitments push converters to secure low-carbon and bio-based feedstocks. M&A activity targeting synergy capture and circular-economy capabilities continues, indicating that scale and technology breadth now matter as much as geographic reach.
Key Report Takeaways
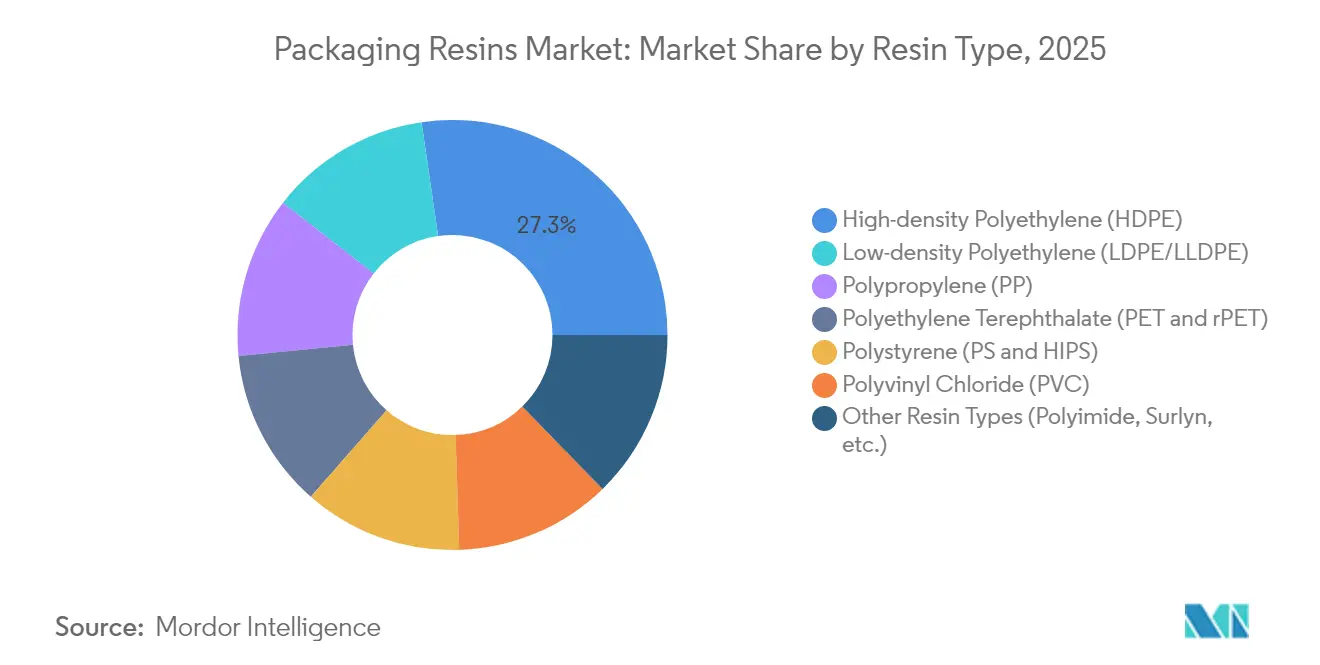
- By resin type, high-density polyethylene captured 27.30% of the packaging resins market share in 2025, while the “Other Types” category is forecast to expand at 6.32% CAGR through 2031.
- By application, food and beverage commanded 47.10% of the packaging resins market share in 2025; “Other Applications” are projected to grow fastest at 6.18% CAGR to 2031.
- By geography, Asia-Pacific held a 53.10% share of the packaging resins market size in 2025 and is advancing at a 5.95% CAGR through 2031.
Note: Market size and forecast figures in this report are generated using Mordor Intelligence’s proprietary estimation framework, updated with the latest available data and insights as of 2026.
Global Packaging Resins Market Trends and Insights
Drivers Impact Analysis*
| Driver | (~) % Impact on CAGR Forecast | Geographic Relevance | Impact Timeline |
|---|---|---|---|
| Cost-effectiveness & longer shelf-life | +1.20% | Global, with stronger impact in emerging markets | Medium term (2-4 years) |
| Booming e-commerce fulfilment volumes | +1.80% | North America & APAC core, spill-over to EU | Short term (≤ 2 years) |
| Increasing demand from food and beverage industry | +1.10% | Global, particularly APAC and Latin America | Long term (≥ 4 years) |
| Rise in phramaeuctical and healthcare packaging demand | +0.90% | North America & EU, expanding to APAC | Medium term (2-4 years) |
| Shift to mono-material packs for recyclability | +0.70% | EU core, expanding to North America and APAC | Long term (≥ 4 years) |
| Source: Mordor Intelligence | |||
Cost-effectiveness & Longer Shelf-life
Packaging resins extend product freshness, cut waste, and reduce logistics losses by combining oxygen barriers with moisture resistance. Recent smart-packaging prototypes embed polyaniline and carbon nanodot sensors that detect ethanol and methanol generated during spoilage, delivering real-time condition alerts for perishable goods[1]Ahmed Maruf, “IoT-Enabled Biosensors in Food Packaging,” MDPI, mdpi.com . Industrials are scaling these resins for temperature-sensitive pharmaceuticals and functional food channels. AI-guided extrusion planning now tunes layer thickness to millimeter tolerances, curbing raw-material overuse and trimming unit cost. As high-value active ingredients increase, converters recast resin choice as a risk-mitigation lever rather than a commodity input. The resulting cost-of-ownership advantage sustains premium acceptance even when feedstock swings pressure margins.
Booming E-commerce Fulfillment Volumes
Online retail volumes drive structural shifts toward lighter, more protective packaging. Dimensional-weight shipping fees incentivize thin-wall pouches, while automation demands predictably stretch-resistant films. Resin formulators answer with higher-strength LLDPE blends and impact-modified polyolefins able to survive conveyor drops. Growth of paper mailers creates substitution risk, yet barrier-coating grades of polyolefin and EVOH preserve plastic usage even inside fiber-based formats. Single-serve portion packs flourish as consumers seek convenience, intensifying demand for resealable closures and peelable seals. The net impact is a broader mix of micro-applications, each requiring specific melt index and toughness profiles, sustaining volume momentum across diverse resin families.
Increasing Demand from Food & Beverage Industry
Regulations such as the EU Packaging and Packaging Waste Regulation and extended producer responsibility schemes force brand owners to back designs that combine recyclability with uncompromised barrier performance[2]Food Packaging Forum, “European Council Adopts Final PPWR Provisions,” foodpackagingforum.org . Investments like Tetra Pak’s USD 270 million aseptic technology upgrade demonstrate the capital intensity of staying compliant while leveraging ultra-high-temperature systems for shelf-stable dairy. Biodegradable and compostable resin innovations gain traction, yet require precise moisture management to avoid premature degradation. Smart-label integration—linking freshness indicators with cloud dashboards—creates incremental resin demand for electronics-compatible structures. Together, these shifts anchor steady volume growth despite saturated mature markets.
Rise in Pharmaceutical & Healthcare Packaging Demand
Moisture-resistant HDPE bottles, cyclic olefin copolymer vials, and blister films with desiccant layers protect high-value biologics and personalized therapies. North America sets sterile-pack trends as FDA guidelines tighten water-vapor-transmission thresholds, spurring upgrades across Asian supply chains. Sustainability goals run parallel: firms test recycled HDPE for non-contact secondary packs and evaluate bio-PE where traceability permits. Serialization mandates drive machine-readable printing on laminates, influencing resin surface-energy specifications. These combined technical hurdles underpin a robust growth premium for medical-grade polymers through the decade.
Restraints Impact Analysis*
| Restraint | (~) % Impact on CAGR Forecast | Geographic Relevance | Impact Timeline |
|---|---|---|---|
| Tightening regulations on plastic waste | -1.40% | EU core, expanding to North America and APAC | Medium term (2-4 years) |
| Feed-stock (naphtha/ethylene) price volatility | -0.80% | Global, with higher impact in import-dependent regions | Short term (≤ 2 years) |
| PFAS scrutiny on fluorinated HDPE containers | -0.60% | EU core, expanding to North America, with early adoption in California and select US states | Medium term (2-4 years) |
| Source: Mordor Intelligence | |||
Tightening Regulations on Plastic Waste
The EU’s August 2026 cap of 25 ppb for individual PFAS in food packaging compels rapid material reformulation. Parallel state-level bans in California and New Mexico layer complexity on multinational supply chains, while India’s 30% recycled-PET mandate triggers 30% cost inflation for beverage fillers who struggle with limited r-PET supply. Extended producer responsibility statutes rolling out across the United States in 2025 will accelerate post-consumer take-back fees. Compliance spending diverts cash from expansion projects and narrows short-term margins, even as it catalyzes long-run innovation.
Feed-stock (Naphtha/Ethylene) Price Volatility
Naphtha and propylene swings distort resin cash-cost curves; unplanned cracker outages coupled with prospective 25% tariffs on Canadian and Mexican imports drove a March 2025 spike in PE and PP contract prices. U.S. polymer-grade propylene is projected to rise further as LyondellBasell’s refinery exit tightens supply. In Asia, sub-economic spreads forced several Southeast Asian crackers offline, demonstrating margin fragility when crude tracks upward. Hedging programs and flexible sourcing partially cushion volatility, yet converters still face quoting challenges on multi-year supply contracts.
*Our forecasts treat driver/restraint impacts as directional, not additive. The impact forecasts reflect baseline growth, mix effects, and variable interactions.
Segment Analysis
By Resin Type: HDPE Leadership Amid Specialty Growth
High-density polyethylene sustained the largest 27.30% packaging resins market share in 2025, with demand anchored in blow-molded food containers, jerrycans, and pharma bottles. Growth persists as recyclate availability improves, aligning with corporate recycled-content pledges. “Other Types” register the fastest 6.32% CAGR, reflecting scaling of polyimide, ionomer, and cyclic-olefin copolymer lines tailored to high-barrier, retortable, and easy-seal formats. Polypropylene extends penetration in caps and medical devices, while PET faces mixed fortunes—benefiting from recycling infrastructure yet constrained by bottle-to-bottle mandates that divert supply. Polyvinyl chloride remains niche in non-food blister packs due to chlorine-related disposal issues. Bio-PE capacity, expanded 30% by Braskem to 260,000 tons, affirms commercial-scale renewable feedstock pathways. Advanced recycling plants such as ExxonMobil’s Baytown unit, targeting 1 billion lb/year by 2027, promise new circular feedstreams.
The packaging resins market for HDPE-based rigid packs demonstrates steady growth potential, supported by increasing demand across high-value applications. Product developers couple multi-layer downgauging with compatibilizers that enable mono-material recovery, an approach boosting post-consumer recycling rates and ensuring compliance with 2030 recyclability pledges. Equipment retrofits unlock run-rate flexibility, and the migration to all-electric injection presses cuts energy use, strengthening HDPE cost leadership. Specialty grades command premium pricing that offsets lower volumes; niche opportunities in odor-barrier and radiation-resistant films lift gross margins for innovators.


By Application: Food & Beverage Dominance with E-commerce Surge
Food and beverage maintained a commanding 47.10% packaging resins market share in 2025, safeguarded by indispensable requirements for hygiene and regulatory adherence. Shelf-stable dairy, ready-to-eat meals and carbonated beverages rely on precise oxygen- and CO₂-barrier properties that favor multilayer PET and EVOH-lined PE.
“Other Applications” encompassing e-commerce fulfillment, protective industrial wraps and returnable transport packaging will grow at 6.18% CAGR, fueled by omnichannel retail logistics and automation trends. Dimensional-weight fee structures push designers toward tear-resistant thin films and bubble-cushion laminates based on tougher LLDPE. Smart labels equipped with NFC chips to authenticate cosmetics and personal-care packs stimulate demand for resins that accept stable conductive inks. Healthcare maintains steady up-trend as biologics pipelines expand, while industrial chemical drums adopt cross-linked HDPE to satisfy UN dangerous-goods norms. Growing adoption of hybrid paper-plus-barrier-resin designs underscores the shift from primary plastic pack to functional coating layer, further diversifying application pathways.

Geography Analysis
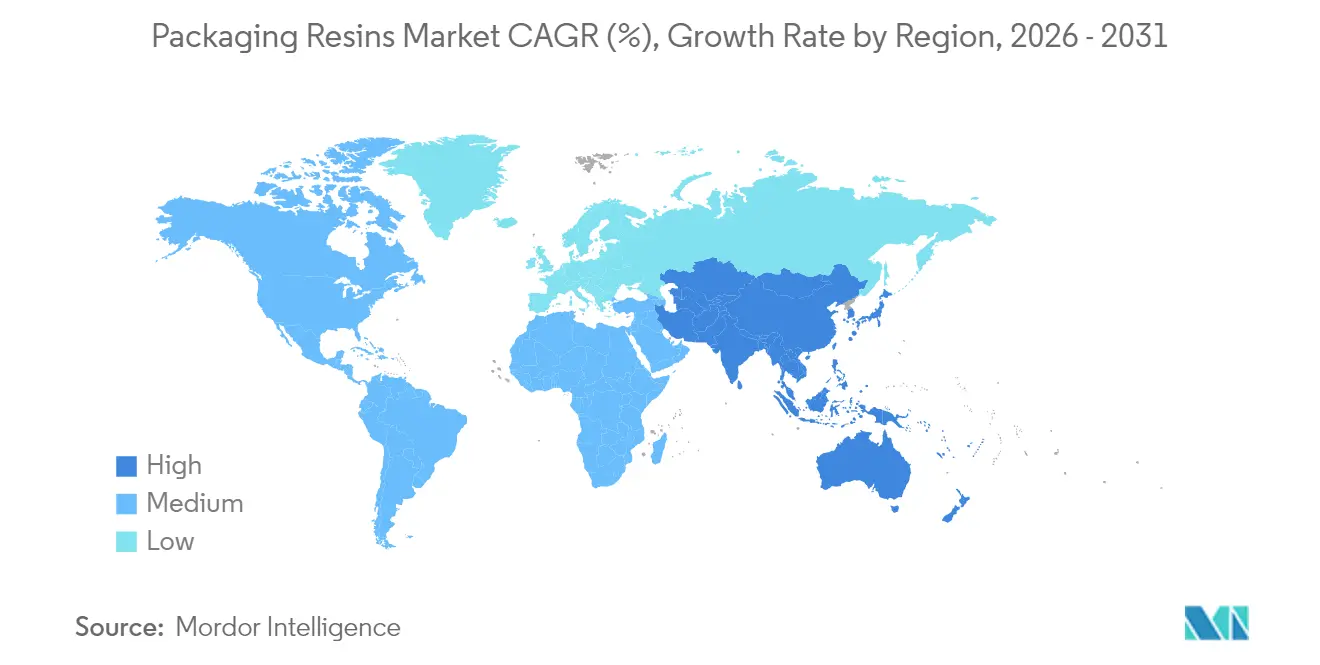
Asia-Pacific controlled 53.10% of global demand in 2025 and will accelerate at 5.95% CAGR through 2031, a dual dominance rooted in cost-effective manufacturing and swelling domestic consumption. China’s 362 million-ton virgin resin output in 2022 cemented its global supply influence, yet profitability has thinned, prompting several crackers to idle or defer expansion. India’s rigid-pack boom—serving food, beverage and personal care—is propelled by urbanization and rising income, though extended-producer-responsibility rules push brand owners toward recyclable laminates. Southeast Asian makers grapple with negative spreads, but long-term fundamentals remain intact due to proximity to growth markets.
North America shows moderate growth but high innovation density. Analysts forecast headwinds for polyethylene and polypropylene until 2026 because of capacity overhang and feedstock uncertainty. Investments such as ExxonMobil’s advanced-recycling expansion and LyondellBasell’s 400,000-t propylene unit reflect strategic bets on differentiation rather than volume plays. Canada and Mexico face potential tariff disruptions that would recalibrate continental trade flows.
Europe balances tight regulation with technology leadership. The Packaging and Packaging Waste Regulation drives mono-material adoption, while high recycling rates in Denmark and Austria reinforce downstream demand for washed flakes. SABIC’s 135 product launches in 2024 and pilot chemical-recycling ventures show incumbents aligning portfolios with circular-economy policy. The Netherlands targets fossil-free packaging by 2050, intensifying R&D in bio-polymers. South America and Middle East & Africa collectively record rising demand from urbanization and e-commerce penetration; Brazil leads regional uptake, and Saudi Arabia leverages feedstock advantage for export-oriented PE and PP.

Regulatory Landscape
A key regulatory anchor for packaging resins is the EU Packaging and Packaging Waste Regulation, Regulation (EU) 2025/40, which entered into force on 11 February 2025 and applies from 12 August 2026. The regulation raises requirements around packaging design for recyclability and recycled-content compliance, and it also sets a standardization pathway, including a mandate for the European Commission to adopt implementing acts for harmonized packaging labels by 12 August 2026. This tightens specification and documentation needs for resin producers and converters supplying EU packaging formats.
In the United States, food-contact oversight continues to shape allowable chemistries and recycled-plastic use in packaging through the U.S. Food and Drug Administration (FDA) Food Contact Substances (FCS) program and its inventory of submissions for post-consumer recycled plastics used in food-contact articles. In May 2026, the FDA finalized a systematic process for post-market assessment of chemicals in food, including food-contact substances and packaging materials. That update reinforces reassessment mechanisms that can lead to amended authorizations, limits, or other compliance actions that cascade into resin formulation, additive selection, and supplier qualification for regulated end uses.
Value Chain Analysis
The packaging resins value chain runs from upstream petrochemical feedstocks (naphtha, ethylene, propylene, and aromatics) and bio-based inputs, through polymerization and compounding into packaging grades (PE, PP, PET, PS, PVC, and specialty resins), then conversion into films, rigid containers, and closures. It ultimately links to brand owner filling, retail distribution, and end-of-life collection and recycling. Feedstock volatility and logistics risks remain central constraints. 2026 supply chain disruptions tied to energy and shipping stresses lifted resin and filler costs and extended delivery timelines, which underscores the value of diversified sourcing, inventory buffers, and regional production footprints for both resin makers and converters.
Midstream and downstream nodes are adding capacity and capability where supply resilience and circularity demands intersect. Examples include thyssenkrupp Uhde signing a contract in April 2026 with Koksan for a 324,000-ton-per-year PET resin plant in Yumurtalik, Turkey (Melt-To-Resin technology), and Oben Group signing in June 2026 for a new 12-meter BOPP line in Brazil with 94,000 tons per year. On the circular feedstock side, brand and converter pull for recycled content is reflected in initiatives such as PureCycle Technologies and Mitsui & Co. partnering with RM TOHCELLO (announced July 2026) to bring recycled polypropylene into flexible packaging in Japan, strengthening the connection between advanced recycling output and packaging-grade qualification requirements.
Competitive Landscape
The packaging resins market is moderately fragmented but moving toward consolidation. Q2 2024 logged 60 M&A deals, up 9.10% YoY, signaling renewed appetite for bolt-on acquisitions even as total invested capital fell 85% to USD 0.38 billion amid higher funding costs. Competitive intensity varies across sub-sectors. Pharmaceutical and healthcare grades enjoy margin insulation due to stringent qualification barriers; ExxonMobil’s Exact resin series and Borealis’ BorPure range command price premiums.
Commodity film markets remain price sensitive, with Asian overcapacity weighing on spot quotes. Strategic differentiation now centers on circular offerings: SABIC’s Trucircle PCR-based PP, Braskem’s I'm Green bio-PE, and Dow’s bio-ethylene supply pact with New Energy Blue are high-profile initiatives. Technology adoption is another lever—IoT-enabled smart packaging alliances create novel revenue streams beyond resin tonnage, and early movers in chemical recycling expect license fees as a future profit pool.
Packaging Resins Industry Leaders
China Petrochemical Corporation. (Sinopec)
Dow
Exxon Mobil Corporation
LyondellBasell Industries Holdings B.V.
SABIC
- *Disclaimer: Major Players sorted in no particular order

Market Opportunities and Future Outlook
Compliance-driven redesign and greater clarity on measurement are creating actionable whitespace for packaging-resin suppliers that can deliver recyclable, mono-material structures and verifiable recycled-content solutions at scale. Regulation (EU) 2025/40 becomes applicable on 12 August 2026 and includes provisions that push packaging toward recyclability and minimum recycled content. The European Commission also added specificity on recycled-content accounting with Commission Implementing Decision (EU) 2026/1425 adopted on 30 June 2026, which establishes rules for calculating and verifying recycled plastic content in single-use beverage bottles, covering both mechanical and chemical recycling pathways. Together, these requirements raise demand for packaging-grade resins and compatibilizer packages designed to align with EU design-for-recycling guidance, while increasing supplier value in testing, traceability, and customer documentation for EU-bound packaging.
Investment activity also points to opportunities in regional supply security, process efficiency, and circular-ready product platforms. Borealis announced a EUR 49 million investment in January 2026 at Burghausen, Germany to scale Borstar Nextension polypropylene technology for circular packaging applications. Braskem approved a USD 779 million expansion in October 2025 at its Rio de Janeiro complex to add 220,000 tons per year of ethylene and polyethylene capacity (completion scheduled for 2028). New and upgraded packaging-materials capacity also reinforces this opening, including Oben Group's June 2026 agreement for a 94,000-ton-per-year BOPP line in Brazil and thyssenkrupp Uhde's April 2026 PET plant contract with Koksan in Turkey, which together support localized supply of packaging films and resins that reduce logistics exposure and help converters manage tighter recycled-content and performance specifications.
Recent Industry Developments
- July 2026: LyondellBasell announced a collaboration with Mondelez to produce Marabou flexible packaging using recycled plastic. The effort links a major resin producer with a global brand owner to commercialize recycled-content flexible packaging, reinforcing demand for consistent PCR quality and packaging-grade qualification workflows.
- November 2025: Sinopec reported successful results from a pilot of PBST biodegradable mulch film in Xinjiang, following commissioning of a 60,000-ton-per-year production facility in Hainan in March 2025. The pilot-to-capacity linkage signals scaling activity in biodegradable polymer routes that can influence packaging-adjacent resin development and downstream converter interest in alternative materials.
- December 2024: Sinopec completed mechanical construction of the second-phase expansion at Zhenhai Refinery, adding 18 production units and capacity geared toward high-end polyolefins and advanced materials. The expansion supports broader availability of higher-specification resin slates that packaging converters use for downgauged films, performance closures, and other value-added packaging applications.


Research Methodology Framework and Report Scope
Market Definition and Coverage
For this study, the packaging resins market covers polymer resins used to manufacture packaging formats such as films, pouches, bottles, trays, caps, and closures, across major end-use packaging needs. Demand is captured in resin consumption volume, and totals are built across key geographies.
Scope exclusions: Excluded items include paper, glass, and metal packaging materials, along with packaging machinery and equipment.
Segmentation Overview
- By Resin Type
- High-density Polyethylene (HDPE)
- Low-density Polyethylene (LDPE/LLDPE)
- Polyethylene Terephthalate (PET and rPET)
- Polypropylene (PP)
- Polystyrene (PS and HIPS)
- Polyvinyl Chloride (PVC)
- Other Resin Types (Polyimide, Surlyn, etc.)
- By Application
- Food and Beverage
- Consumer Goods
- Cosmetics and Personal Care
- Healthcare
- Industrial
- Other Applications (E-commerce Mailers and Protective Wrap, etc.)
- By Geography
- Asia-Pacific
- China
- Japan
- India
- South Korea
- ASEAN Countries
- Rest of Asia-Pacific
- North America
- United States
- Canada
- Mexico
- Europe
- Germany
- United Kingdom
- France
- Italy
- Spain
- Russia
- NORDIC Countries
- Rest of Europe
- South America
- Brazil
- Argentina
- Rest of South America
- Middle East and Africa
- Saudi Arabia
- South Africa
- Rest of Middle East and Africa
- Asia-Pacific
Data Sources, Market Sizing, and Validation
Desk Research
Desk work started with aligning a clean definition, units, and time series so the same resin demand is not counted twice across applications. We used public and official references such as UN Comtrade trade statistics, national customs and statistical offices, International Energy Agency petrochemicals indicators, US EPA waste and recycling statistics, and peer-reviewed polymer and packaging journals to understand consumption direction and material substitution.
To make the model practical, we also reviewed company annual reports, investor presentations, press releases, and association websites to map resin usage into packaging and to check regional demand patterns. Where needed, paid subscriptions that track company financials and news, patent activity, and shipment-level import and export data were used to cross-check capacity additions and trade flows. This list is illustrative and not exhaustive, and many other sources were also referred to for data collection, validation, and clarification.
Primary Interviews and Surveys
Primary work was used to pressure-test resin consumption assumptions by application and to confirm how converters and brand owners are adjusting gauges, downgauging rates, and recycled-content blends. We spoke with a mix of resin producers, converters, distributors, and packaging buyers across APAC, EMEA, and the Americas. The inputs were then used to align secondary signals with what is happening in real procurement and production cycles.
Distribution of primary research fieldwork respondents
| Company type | Respondent position | Region |
|---|---|---|
| Top tier: 25% | CXOs: 18% | APAC: 48% |
| Mid tier: 55% | Functional/Unit leaders: 24% | EMEA: 29% |
| Smaller Players: 20% | Managers: 58% | Americas: 23% |
Market-Sizing & Forecasting
Sizing was built using a top-down demand reconstruction, where packaging output signals and polymer consumption patterns were translated into resin volume by geography and then rolled up to the global total. We then corroborated the totals with selective bottom-up approximations, such as supplier and converter roll-ups in a few high-consumption countries, and sampled volume-by-application checks. This helped adjust areas where public data is thin.
Key inputs used in the model included polymer capacity and operating rates, packaging demand trends in food and beverage and consumer goods, lightweighting and downgauging pace in flexible formats, recycled-content adoption rates for PET and polyolefins, and trade flows that shift resin availability across regions. Since pricing can move sharply with feedstock, we used volume as the primary unit so the market view stays traceable to consumption rather than short-term price swings.
Forecasting relied on scenario analysis supported by expert views, since regulation (single-use rules, recycled-content mandates) and macro demand can change quickly. For gaps in application-level splits, we used conservative proxy shares derived from the closest available packaging output and resin conversion indicators, and then rechecked them in follow-up calls.
Data Validation & Update Cycle
Each regional build was checked against independent signals, including capacity additions, resin trade balances, and packaging demand direction from public indicators, and then mismatches were reviewed before sign-off. If a variance was large, assumptions were revisited, and respondents were re-contacted to confirm whether the change was structural or temporary.
A second analyst review was completed to confirm that units, conversions, and roll-ups were consistent across resin types and applications. Reports are refreshed annually, with interim updates when material events occur, such as major capacity shutdowns, policy changes, or rapid shifts in recycled-content economics. Before delivery, a final pass is done to ensure the latest public releases and market signals are reflected.
Mordor Intelligence's Packaging Resins Market Estimate Compared With Other Published Estimates
Published market numbers for packaging resins can look far apart because firms do not always measure the same thing, even when the market name sounds identical. Differences usually come from whether the estimate is built in value or in volume, how recycled and virgin resin flows are treated, and how trade and conversion losses are handled.
Excluded from the benchmark number are resin dollar sales totals, which sit outside Mordor Intelligence's scope because this report tracks packaging resin demand in million tons. Using that unit choice avoids year-to-year swings driven mainly by feedstock price and currency timing. Some other estimates also apply different growth cases or factory-gate revenue definitions, and the refresh timing can shift results when crude-linked resin pricing moves quickly.
Benchmark comparison
| Source | Market Size | Gaps in Research Methodology |
|---|---|---|
| Mordor Intelligence | USD 164.69 M (2026) | |
| Trade Publisher A | USD 263.54 B (2024) | Uses revenue (factory-gate value) instead of resin consumption volume, so price cycles, currency conversion timing, and service add-ons can change the total even if tons are stable. |
| Industry Research Portal B | USD 200.25 B (2024) | Value-based market sizing with broader segment lenses (such as distribution and product form), which can pull in adjacent resin revenue pools not linked directly to packaging conversion volumes. |
Looking at the table, the spread is mainly explained by unit and scope alignment rather than a true disagreement on demand direction. When the same resin pool is measured in tons and tied back to packaging consumption drivers, the steps stay easier to repeat and validate across regions, and assumptions can be rechecked quickly when new trade or capacity signals appear.


Key Questions Answered in the Report
What is the current size of the packaging resins market?
The packaging resins market size reached 164.69 million tons in 2026 and is projected to grow to 210.67 million tons by 2031.
Which region leads the packaging resins market?
Asia-Pacific leads with 53.10% share in 2025 and is also the fastest-growing region at 5.95% CAGR through 2031.
Which resin type dominates global demand?
High-density polyethylene holds the largest packaging resins market share at 27.30% thanks to its versatility across rigid and flexible formats.
How are regulations influencing material choices?
Mandated recycled-content thresholds, PFAS restrictions and extended producer responsibility laws are steering converters toward mono-material, recyclable and bio-based resins, accelerating innovation.
What drives growth in pharmaceutical packaging resins?
Strict sterility standards, serialization requirements and the rise of personalized medicines are boosting demand for moisture-barrier and traceable resin grades in healthcare packaging.
How is e-commerce affecting resin demand?
Online retail increases volume needs for lightweight, impact-resistant packaging and spurs development of smart films compatible with high-speed automation, pushing specialty resin consumption upward.
Page last updated on:


 Your data is secure and never sold or shared.


