
Market Overview
| Study Period | 2020 - 2031 |
|---|---|
| Forecast Data Period | 2026 - 2031 |
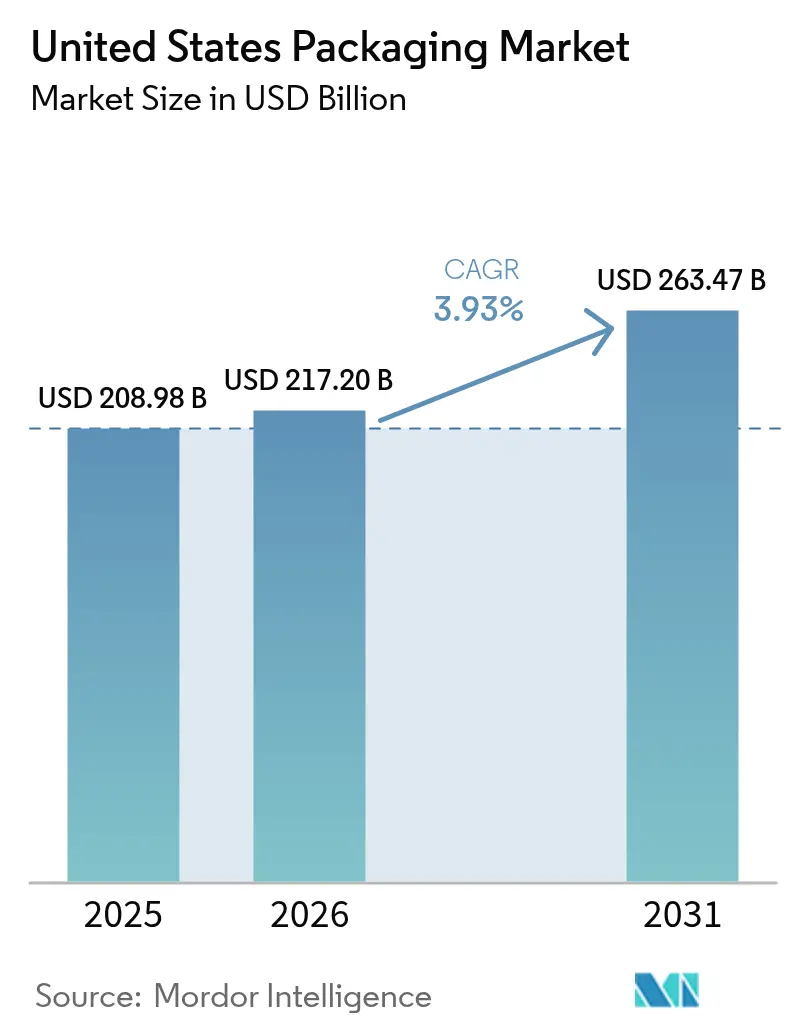
| Base Year Market Size (2025) | USD 208.98 Billion |
| Market Size (2026) | USD 217.20 Billion |
| Market Size (2031) | USD 263.47 Billion |
| Growth Rate (2026 - 2031) | 3.93 % |
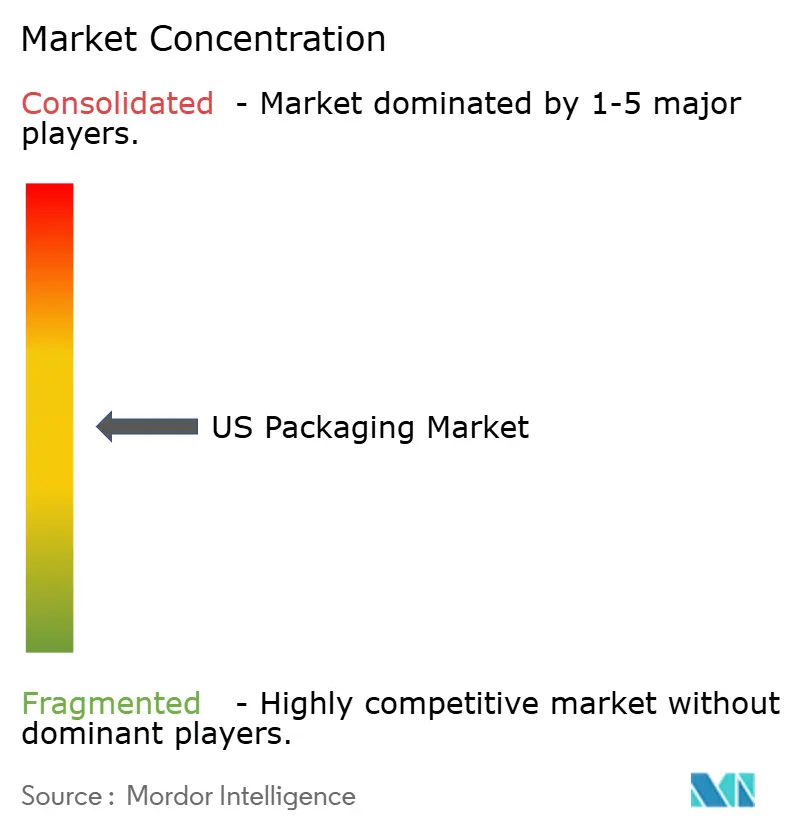
| Market Concentration | Medium |
Major Players *Disclaimer: Major Players sorted in no particular order Image © Mordor Intelligence. Reuse requires attribution under CC BY 4.0. | |
United States Packaging Market Analysis by Mordor Intelligence
The United States Packaging market size is expected to grow from USD 208.98 billion in 2025 to USD 217.2 billion in 2026 and is forecast to reach USD 263.47 billion by 2031 at 3.93% CAGR over 2026-2031.
Strong links to the country’s USD 940.8 billion trucking sector keep the US packaging market resilient, because packaging design and weight directly shape freight costs. E-commerce proliferation, regulatory shifts such as state-level Extended Producer Responsibility statutes, and accelerated on-shoring of pharmaceutical capacity are steering capital toward automation-ready lines and higher-barrier materials. The US market continues to benefit from premiumization in food and beverage segments, while cost pressures from PFAS-free mandates and polymer capacity additions squeeze margins for converters. Large, integrated suppliers leverage scale and R&D depth to absorb regulatory compliance costs and preserve pricing power as smaller firms seek niche differentiation.
Key Report Takeaways
- By material type, plastic captured 35.88% of the market share in 2025.
- By product type, the US packaging market size for the metal product type is projected to grow at a 6.64% CAGR between 2026-2031.
- By packaging format, flexible packaging captured 51.12% of the market share in 2025.
- By end-user, the US packaging market size for pharmaceutical and medical is projected to grow at a 5.24% CAGR between 2026-2031.
Note: Market size and forecast figures in this report are generated using Mordor Intelligence’s proprietary estimation framework, updated with the latest available data and insights as of 2026.
United States Packaging Market Trends and Insights
Drivers Impact Analysis*
| Driver | (~) Impact on CAGR Forecast | Geographic Relevance | Impact Timeline |
|---|---|---|---|
| E-commerce boom driving small-parcel packaging demand | +1.2% | National, urban fulfillment centers | Medium term (2-4 years) |
| Premiumization in food and beverage accelerating demand for high-barrier flexibles | +0.8% | National, coastal premium hubs | Long term (≥ 4 years) |
| On-shoring of pharmaceutical fill-finish capacity boosting sterile packaging | +0.6% | Regional pharma corridors | Long term (≥ 4 years) |
| Automation-ready secondary packaging lines at CPGs | +0.5% | National manufacturing hubs | Medium term (2-4 years) |
| Retail media networks favoring shelf-ready formats | +0.3% | National retail chains | Medium term (2-4 years) |
| USDA and DOE grants for biopolymer pilot plants | +0.2% | Agricultural and research centers | Long term (≥ 4 years) |
| Source: Mordor Intelligence | |||
E-commerce Boom Driving Small-Parcel Packaging Demand
Investments in automation-ready secondary lines allow consumer packaged goods firms to manage labor shortages and SKU proliferation efficiently, with Mary Kay trimming line labor by 85% after a USD 2 million upgrade while maintaining 50-60 units per minute. Dimensional-weight pricing by major carriers rewards smaller, lighter parcel formats, stimulating demand for right-sized corrugated inserts and cushioning. As the US packaging market aligns with omnichannel fulfillment, converters that offer integrated protective, branded, and data-rich solutions capture volume from retailers seeking to cut last-mile costs. Automation helps distributors minimize pick-pack errors and meet one-day delivery promises, making reliable secondary packaging a competitive necessity. Supply chain risk mitigation encourages multisourcing of substrates, benefiting converters with diversified material portfolios.
Premiumization in Food and Beverage Accelerating Demand for High-Barrier Flexibles
Premium brands are shifting to multilayer high-barrier films that extend shelf life and support clean-label formulas, a move that lifts average price per unit in the US packaging market. Advanced coatings block oxygen, light, and moisture, safeguarding natural flavors without additives and reducing food waste. Consumers favor pouches with resealable spouts and transparent windows, pushing converters to balance barrier performance with shelf appeal. FDA food contact clearances add compliance complexity, limiting the entry of low-capex competitors. Brand owners justify higher pack costs through margin-expansion strategies centered on consumer willingness to pay for perceived quality. As sales of organic snacks and ready-to-drink coffees climb, demand for premium flexible formats strengthens long-term order books for film extruders.
On-shoring of Pharmaceutical Fill-Finish Capacity Boosting Sterile Packaging
Big Pharma has committed USD 160 billion to domestic production, including Eli Lilly’s USD 5.3 billion Indiana site and Johnson & Johnson’s USD 55 billion four-year plan. Executive Order 14293 streamlines approvals for new plants and intensifies oversight of foreign imports. Fill-finish facilities require ISO-compliant clean-room packaging, spurring demand for pre-filled syringes, sterilizable closure systems, and validated secondary packs. Cold-chain distribution needs insulated shippers and data-logging labels. The US market benefits as domestic sourcing reduces tariff exposure and enhances supply certainty, positioning sterile-pack providers for multiyear volume lock-ins.
Automation-Ready Secondary Packaging Lines at CPGs
The packaging machinery segment rose 5.8% to USD 10.9 billion in 2023 and is projected to grow 8.0% annually to 2027. Case packers, palletizers, and robotics integrate with AI-enabled vision systems for predictive maintenance, cutting downtime and scrap.[1]PMMI, “Packaging Machinery Sales Projected to Grow to New Highs Through 2027,” Packworld, packworld.com Because the US packaging market increasingly specifies machine-compatible substrates, converters adopt tighter tolerances on board caliper and film slip coefficients. Standardized case footprints ease warehouse slotting and retailer shelf placement, while serialized barcodes improve traceability. Capital spending on machinery drives parallel commitments to higher-quality corrugate and films that run at elevated line speeds without jamming.
Restraints Impact Analysis*
| Restraint | (~) Impact on CAGR Forecast | Geographic Relevance | Impact Timeline |
|---|---|---|---|
| California’s SB-54 Extended Producer Responsibility cost pass-through | -0.7% | California; nationwide supply chains | Medium term (2-4 years) |
| PFAS-free mandates raising formulation costs | -0.5% | Multi-state expanding coverage | Short term (≤ 2 years) |
| 2028-2029 PE and PP cracker capacity overhang depressing converter margins | -0.4% | Gulf Coast production regions | Medium term (2-4 years) |
| Rising freight rates on corrugated due to chassis shortages | -0.3% | High-volume shipping corridors | Short term (≤ 2 years) |
| Source: Mordor Intelligence | |||
California’s SB-54 Extended Producer Responsibility Cost Pass-Through
Governor Newsom delayed initial regulations, citing business burden, yet the 25% plastic reduction mandate by 2032 and the USD 5 billion waste fund remain in force. Producers must finance recycling infrastructure and redesign packages or pay modulated fees. Larger players in the US packaging market spread costs across wider portfolios, whereas small converters face margin erosion and reduced capex capacity. Uncertainty stalls new-product launches and complicates interstate logistics as companies debate California-only SKUs versus national harmonization. Cost pass-through to brand owners pressures shelf pricing, potentially dampening volume growth in discretionary categories.
PFAS-Free Mandates Raising Formulation Costs
Thirteen states have enacted PFAS limits in food packaging, with California’s AB 347 penalties starting at USD 10,000 per violation. Converters reformulate grease-resistant papers with clay or plant-based coatings that cost 20-30% more than fluorinated chemistries. Certification testing extends lead times and raises inventory carrying costs. Fragmented rules hinder scale, forcing the US packaging market to navigate SKU-specific compliance matrices. Brands risk recalls if documentation lapses, prompting a shift toward supplier audits and shared liability clauses.
*Our forecasts treat driver/restraint impacts as directional, not additive. The impact forecasts reflect baseline growth, mix effects, and variable interactions.
Segment Analysis
By Material Type: Plastic Dominance Faces Sustainability Pressures
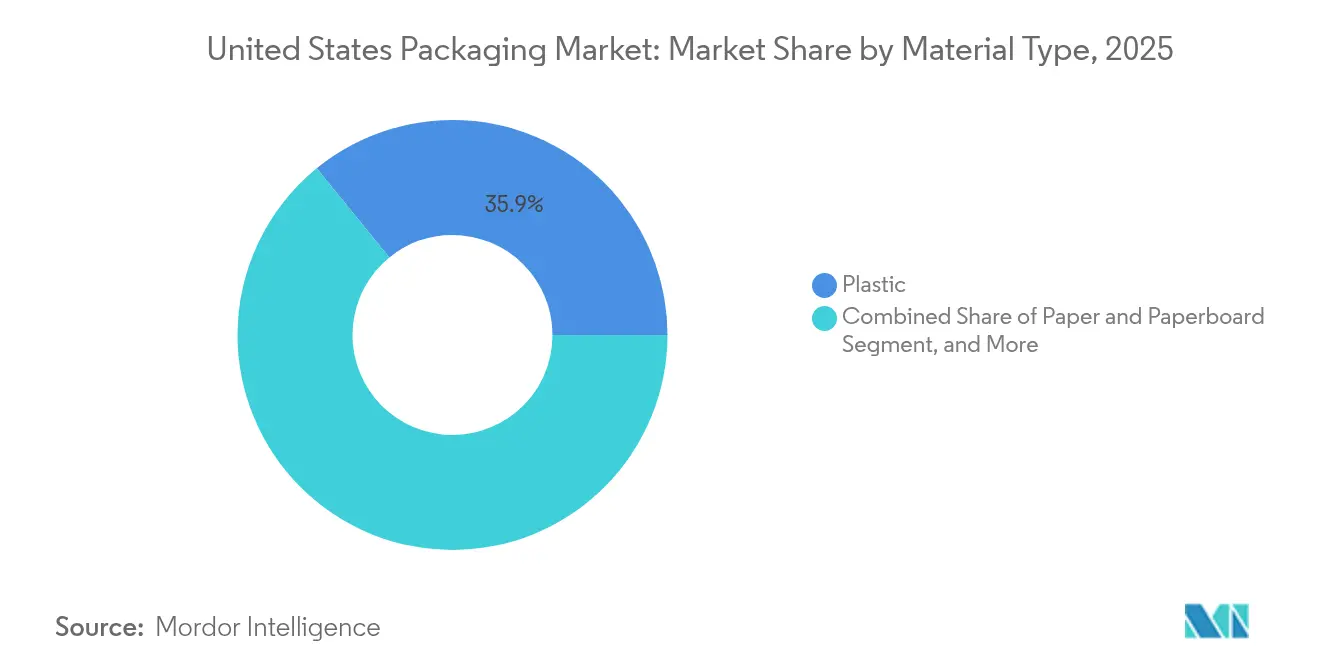
Plastic retained 35.88% of the US packaging market share in 2025, thanks to versatility and cost efficiency. Paper and paperboard, however, grew at a 5.33% CAGR and are expected to erode some plastic volume by 2031 as retailers pledge fiber-based alternatives. The Department of Energy’s USD 52 million fund toward cellulose-based films signals public-sector backing for next-gen substrates. Natural HDPE scarcity pushed recycled resin to 96 cents per pound in March 2025, challenging bottle-to-bottle projects.
Plastic converters in the US packaging market face dual pressure from carbon accounting demands and resin oversupply risks. Investments shift to mono-material PE films engineered for recyclability, while multi-layer nylon structures migrate to high-barrier paper. Metal packaging maintains demand as beverage makers lock in alloy cans to meet infinitely recyclable claims. Overall, material selection now balances cost, circularity metrics, and regulatory exposure more than basic performance.


By Product Type: Metal Products Accelerate Amid Beverage Demand
Paper and paperboard products commanded 28.70% of the US packaging market share in 2025 due to high corrugated volumes. Metal products are forecast to grow at a 6.64% CAGR as carbonated soft drinks and hard seltzers choose aluminum cans for lightweighting and recycling benefits. Crown Holdings’ beverage can income rose 17% in 2024, underscoring secular demand. Silgan’s 50% hold on metal food cans shows the resilience of shelf-stable products.
Digital print adoption empowers converters to serve seasonal SKU spikes, while rigid plastics such as HDPE jugs retain grocery loyalty for value packs. Yet metal’s infinite-recycle narrative resonates with climate-conscious shoppers, shifting promotional budgets toward can-centric formats. Price swings in LME aluminum could temper volume gains, but brand owners hedge through multiyear take-or-pay deals, stabilizing orders for can-makers.
By Packaging Format: Flexible Solutions Drive Innovation
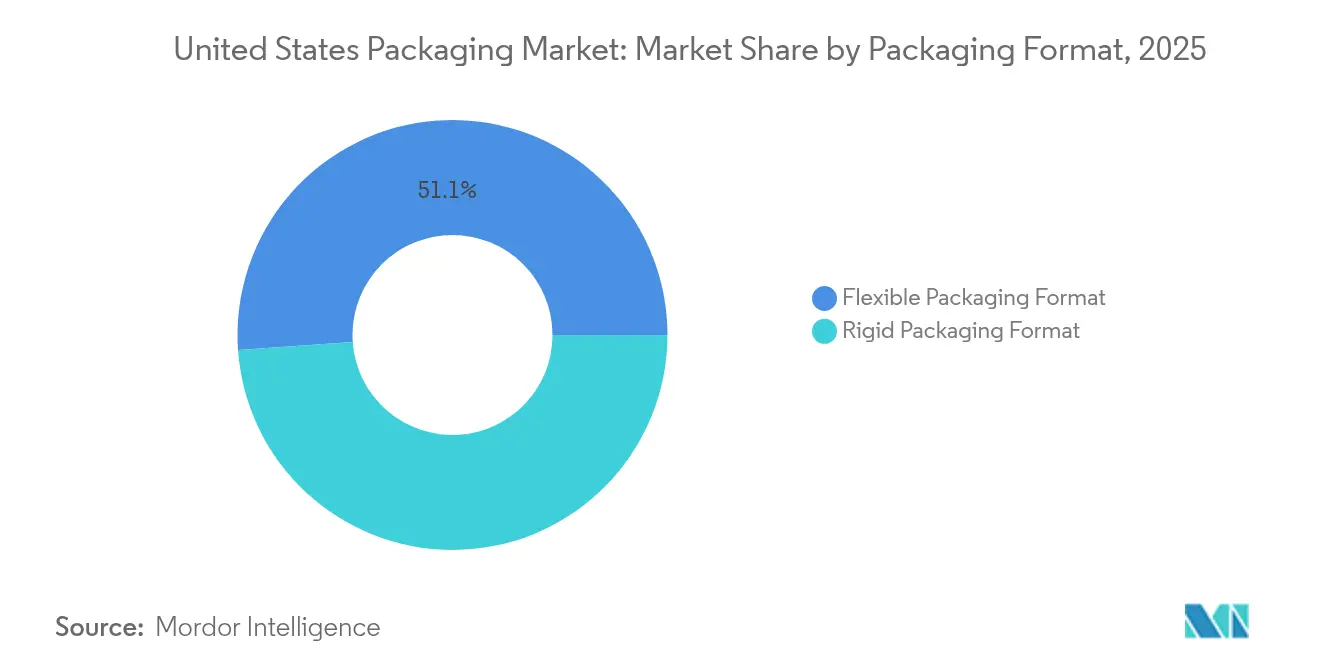
Flexible formats accounted for 51.12% of the US packaging market share in 2025, reflecting weight savings and convenience trends that are also reshaping the packaging market. Rigid formats grow at a 5.86% CAGR due to e-commerce breakage concerns that favor molded fiber inserts and reinforced bottles. Two-thirds of converters expect to shift SKUs from rigid to flexible by 2030, investing in wicketed baggers and form-fill-seal lines.
Material science breakthroughs produce recyclable PE/PE laminates with EVOH-equivalent barrier, aligning with SB-54 source-reduction goals. Meanwhile, rigid PET bottles adopt tethered caps to meet closure-litter rules. The US market size for flexible snack pouches is projected to outpace stand-up rigid cups as shipping weight differentials widen. However, shelf-ready corrugated trays integrated with rigid plastic tubs retain relevance for club-store formats demanding on-shelf impact.
By End-User: Food Applications Lead, Pharma Accelerates
Food retained 44.10% of the US packaging market size in 2025, spanning fresh, frozen, and ready-to-eat categories. Clean-label trends drive barrier upgrades in meat and dairy wraps, while quick-service restaurants trial molded fiber bowls to satisfy PFAS-free laws. Pharmaceutical and medical packs expand at a 5.24% CAGR, undergirded by USD 160 billion in domestic facility investments.
Personal care brands adopt airless pumps and refill pouches, blending a premium feel with reduced plastic intensity. Industrial chemicals require UN-certified drums and IBCs, and agriculture leans on breathable films for produce exports, supported by the USDA’s USD 10 million Innovation Lab grants. Together, these shifts reinforce segment diversification within the US packaging market.
Geography Analysis
California anchors regulatory experimentation, with SB-54 influencing nationwide design as brand owners avoid dual supply chains.The Pacific corridor also houses tech-driven CPG start-ups that pilot QR-enabled smart packs for traceability. Texas benefits from Mary Kay’s automation showcase and pharma megaprojects along the I-35 corridor, bolstering regional demand for sterile and cosmetic containers.
Midwest states such as Illinois and Ohio support corrugated and folding carton mills serving dense food processing clusters. Chicago’s intermodal hub concentrates resin and board flows, allowing converters to service national retailers within two-day transit. The Southeast offers low energy costs and port access, attracting film extruders and can-makers; Georgia’s Savannah port streamlines aluminum coil imports for beverage lines.
Northeast buyers prioritize premiumization and sustainability, adopting fiber-based wine shippers and compostable snack packs. State PFAS bans make the region an early adopter of fluorine-free grease barriers. Mountain states focus on agricultural exports, using high-vent pouches to preserve potatoes and onions bound for Asia. These geographic nuances shape sales strategies across the US packaging market.
Regulatory Landscape
The United States packaging regulatory environment is divided between federal product-safety and labeling authorities, and state-level waste and materials policies that move quickly. For food-contact applications, the US Food and Drug Administration (FDA) regulates food-contact substances, with Food Contact Notifications (FCNs) subject to a 120-day statutory review and manufacturer-specific clearances that shape material choices and qualification timelines for recycled and bio-based inputs.
State-level Extended Producer Responsibility (EPR) frameworks are a key compliance driver for brand owners and converters operating nationally. California, Oregon, and Colorado are among the lead states, with California finalizing SB 54 implementing regulations on May 1, 2026 and a producer registration milestone arriving in June 2026 through CalRecycle and the Circular Action Alliance. Colorado transitioned to active EPR program operation on January 1, 2026 with fee collection and producer obligations administered via the Circular Action Alliance. In parallel, the FTC continues to govern environmental marketing claims for packaging, while proposed federal legislation such as the Packaging and Claims Knowledge (PACK) Act of 2025 reflects ongoing efforts to harmonize sustainability claim rules across states.
Value Chain Analysis
The US packaging value chain starts with upstream feedstocks and substrates, including resins, aluminum, glass, pulp, paperboard, coatings, inks, and adhesives, supplied to converters and packaging manufacturers producing rigid and flexible formats. Midstream participants include integrated paper and containerboard producers, film and rigid plastic converters, metal can makers, and label/printing specialists, supported by packaging machinery providers (automation, case packing, palletizing, inspection) and quality and compliance services for food, pharmaceutical, and child-resistant applications. Downstream demand is concentrated among CPG and foodservice brand owners, beverage producers, pharmaceutical and medical manufacturers, and industrial shippers, supported by distribution through national retailers, e-commerce fulfillment networks, and third-party logistics connected to trucking and intermodal hubs.
End-of-life management and circularity systems (collection, MRF sorting, recycling, and composting where available) increasingly influence design and procurement decisions as EPR reporting and fee exposure rise. EPA analysis (December 2024) highlights an infrastructure gap, estimating USD 22-28 billion in investment needs to lift national recycling rates to 45-47%, with funding support including the Solid Waste Infrastructure for Recycling (SWIFR) grant program under the Infrastructure Investment and Jobs Act. Operationally, leading producers are tightening networks and prioritizing domestic service: International Paper announced multiple converting and preprint facility closures by end of Q3 2026 as part of network optimization, while Packaging Corporation of America has emphasized a multi-year USD 5.2 billion investment program across mills and box plants, and in mid-2026 deferred certain containerboard export sales to prioritize higher-demand domestic box plant inventory.
Competitive Landscape
Crown Holdings, Amcor, Berry Global, Sonoco, and Packaging Corporation of America collectively controlled around one-third of 2024 revenue, indicating moderate concentration. Amcor’s planned USD 650 million merger with Berry Global should unlock scale in films and healthcare packs, while Sonoco’s divestiture of Thermoformed and Flexibles targets debt reduction and portfolio focus.
Automation investments separate leaders from laggards; converters with MES-enabled plants win multi-year contracts that mandate OEE thresholds. Sustainability credentials also define competitive edges, with Crown launching 100% recycled aluminum can stock and Sealed Air restructuring into food and protective divisions to tailor ESG messaging.
Private-equity-backed niche players target high-margin segments such as cannabis, child-resistant pouches, and tamper-evident OTC bottles. Grant-backed start-ups experiment with PHA straps and cellulose foams. Despite consolidation, the US packaging market remains open for specialists who solve regulatory or performance pain points unmet by giants.
United States Packaging Industry Leaders
Amcor plc
International Paper Company
Mondi plc
Graphic Packaging Holding Company
Smurfit WestRock plc
- *Disclaimer: Major Players sorted in no particular order

Market Opportunities and Future Outlook
Regulatory-driven redesign and documentation create whitespace for converters that can deliver compliant, high-throughput formats with auditable material data. California SB 54 implementation milestones in 2026 and Colorado's active EPR fee-and-reporting program from January 1, 2026 are pushing brand owners toward packaging specifications that simplify end-of-life pathways, including mono-material structures aligned with Association of Plastic Recyclers guidance and fiber-based substitutes where feasible. Suppliers that combine packaging engineering with data workflows, such as SKU-level composition, recycled content, and claims substantiation, can embed earlier in customer design and procurement cycles, reducing exposure to fragmented state rules.
Capital spending and product moves in 2026 also point to specific pockets of demand in recycled-fiber boards, corrugated capacity near demand centers, and premium printed packaging that supports SKU proliferation. Graphic Packaging's July 2026 launch of an uncoated recycled paperboard line produced at its Waco, Texas facility, and International Paper's May 2026 groundbreaking of a USD 225 million corrugated packaging facility in Rankin County, Mississippi, reflect active buildout around recycled content and box demand. In parallel, converter adoption of faster-changeover digital and hybrid printing, along with expanded variable data, including GS1-aligned barcodes and ISO/IEC 18004 QR codes, supports brand programs in traceability and retail-ready customization without requiring large minimum order quantities, creating a margin pool in short runs, smart labels, and compliance-ready packaging assets.
Recent Industry Developments
- July 2026: Graphic Packaging Holding Company launched PaceSetter Ridgeline, an uncoated recycled paperboard product line produced at its Waco, Texas facility. The move expands its paperboard offering into URB grades that support recycled-content procurement and brand sustainability requirements.
- June 2026: International Paper completed its USD 360 million acquisition of North Pacific Paper Company (NORPAC). The deal adds manufacturing capability and strengthens supply optionality for packaging grades, supporting network control across upstream inputs and downstream converting.
- May 2026: International Paper acquired a converting facility from Delmarva Corrugated Packaging. Adding converting capacity improves regional service levels for corrugated packaging and can shorten lead times for customers balancing e-commerce and retail replenishment.


Research Methodology Framework and Report Scope
Market Definition and Coverage
For this study, the US packaging market is defined as the revenue generated from packaging materials and packaging forms used to contain, protect, and ship goods across industrial and consumer end uses within the United States.
Scope exclusions: Packaging machinery, packaging automation software, and packaging services (such as contract packing and logistics) are excluded from this market value.
Segmentation Overview
- By Material Type
- Paper and Paperboard
- Plastic
- Polyethylene Polypropylene (PP)
- High-density Polyethylene (HDPE) and Low-density Polyethylene (LDPE)
- Polyethylene Terephthalate (PET)
- Polyvinyl Chloride (PVC)
- Polystyrene (PS)
- Other Plastics
- Metal
- Container Glass
- By Product Type
- Paper and Paperboard Product Type
- Folding Carton and Rigid Boxes
- Corrugated Boxes and Containers
- Single-use Paper Products
- Other Paper and Paperboard Product Types
- Plastic Product Type
- Rigid Plastics
- Bottles and Jars
- Caps and Closures
- Bulk-Grade Products
- Other Rigid Plastics Product Types
- Flexible Plastics
- Pouches
- Bags
- Films and Wraps
- Other Flexible Plastics Product Types
- Rigid Plastics
- Metal Product Type
- Cans
- Caps and Closures
- Aerosol Containers
- Other Metal Product Types
- Container Glass Product Type
- Bottles
- Jars
- Paper and Paperboard Product Type
- By Packaging Format
- Rigid Packaging Format
- Flexible Packaging Format
- By End-user
- Food
- Beverage
- Pharmaceutical and Medical
- Personal Care and Cosmetics
- Industrial and Chemical
- Agriculture
- Automotive
- Other End-users
Data Sources, Market Sizing, and Validation
Desk Research
Desk research starts by grounding the model in publicly available statistics that explain packaging demand in the United States. We typically lean on sources such as the US Census Bureau (manufacturing, shipments, and retail indicators), Bureau of Labor Statistics (producer price and inflation series), the US International Trade Commission (trade flows for relevant packaging materials), and the US Environmental Protection Agency (packaging and recycling related indicators).
Industry context is then added using a mix of company annual reports, earnings decks, investor presentations, and trade association publications, which helps us understand material shifts, capacity additions, and end use mix changes. Where needed, paid subscriptions that aggregate company financials, track news and financial events, and provide patent lookups are used to fill gaps on corporate activity and technology direction. The desk source list described here is illustrative, and many additional public documents were reviewed for cross checks, clarification, and validation.
Primary Interviews and Surveys
Primary work is used to pressure test desk assumptions, especially where public data is slow to update or does not break out packaging clearly. We interview and survey a mix of packaging producers, material suppliers, converters, brand owners, and channel participants across the United States so volume drivers, pricing behavior, and substitution patterns can be confirmed with operating views from the field.
Distribution of primary research fieldwork respondents
| Company type | Respondent position |
|---|---|
| Top tier: 38% | CXOs: 21% |
| Mid tier: 40% | Functional/Unit leaders: 23% |
| Smaller Players: 22% | Managers: 56% |
Market-Sizing & Forecasting
Market sizing is first built using top-down logic that reconstructs packaging demand from US end use activity and material consumption signals, and then ties it back to pricing. In practice, we map packaging intensity to key demand pools such as food and beverage output, pharmaceutical production, household and personal care consumption, and e-commerce shipment growth, which are then aligned to material categories.
To keep totals realistic, the model uses a short list of inputs that can be traced and updated each year, such as producer price movements for packaging materials, shifts between rigid and flexible formats, recycled content and sustainability driven substitution, import and export trends for key packaging materials, and announced capacity or mill changes. After that, the totals are corroborated with selective bottom-up approximations, including sampled supplier revenue roll ups, channel checks on average selling price bands, and volume sanity checks by material, and any coverage gaps are handled by applying conservative penetration ratios that were validated in interviews.
For forecasting, scenario analysis is used because packaging demand is closely linked to consumer spending, industrial output, and regulation impacts that can move differently by year. Where the historical series is stable, exponential smoothing is applied on pricing and volume indicators, and the final outlook is adjusted only when primary respondents confirm that the assumed mix and price trajectory fits observed contracting and procurement behavior.
Data Validation & Update Cycle
Validation is done through multiple cross checks so the final number is not dependent on any single dataset. We compare outputs against independent signals such as macro demand indicators, price indexes, trade flows, and reported shipment or revenue direction from a spread of industry participants, then investigate any variance that looks out of pattern.
Before sign off, the model goes through step by step analyst review where assumptions are rechecked, formulas are audited, and edge cases are discussed with a second reviewer. If a material event occurs, such as a major capacity shutdown, a regulatory shift, or an unusual price spike, the team re contacts sources and refreshes the relevant inputs. Reports are refreshed annually, and a final pre delivery pass is completed so clients receive the latest updated view.
Mordor Intelligence's United States Packaging Market Size Versus Other Published Estimates
Published market sizes for US packaging often do not match, even when the topic sounds identical, because the scope and counting rules are not the same. Differences usually come from what is treated as packaging value, how prices are converted into revenue, and whether the estimate is anchored to a clear base year or a forward looking point.
Packaging services and packaging technology fees are common add ons in some publications, and those items sit outside Mordor Intelligence's scope for this market value, which keeps the sizing tied to packaging materials and forms sold into end uses. Gaps also show up when a source blends primary, secondary, and tertiary packaging without explaining how double counting is avoided, or when inflation assumptions are applied as a flat uplift rather than using packaging material price series and mix shifts.
Benchmark comparison
| Source | Market Size | Gaps in Research Methodology |
|---|---|---|
| Mordor Intelligence | USD 208.98 B (2025) | |
| Trade Journal A | USD 223.96 B (2026) | Often described as including packaging technologies and services along with primary, secondary, and tertiary packaging, and the value can rise if service fees or system level spending is counted alongside packaging material sales. |
| Industry Publisher B | USD 107.02 B (2025) | Typically uses a narrower revenue pool with selective segment coverage and different unit treatment (USD million base), and may exclude parts of rigid formats or certain end uses, which lowers the total versus a full material and end use build. |
The table shows that most of the spread can be explained by what is included in the revenue pool and how packaging levels are handled. By keeping the scope centered on packaging materials and forms, and then cross checking with price and demand indicators that can be updated each year, the estimate stays traceable and easier to reproduce when assumptions change.


Key Questions Answered in the Report
How large is the United States packaging market in 2026?
It stands at USD 217.2 billion and is projected to reach USD 263.47 billion by 2031.
Which material grows fastest through 2031?
Paper and paperboard rise at a 5.33% CAGR, outpacing plastics and metals.
Why are pharmaceutical packs gaining share?
USD 160 billion in domestic manufacturing drives demand for sterile vials, syringes, and secondary containment.
Which packaging format holds the largest share?
Flexible formats lead with a 51.12% share of 2025 volume thanks to lightweight and consumer-friendly designs.
How are converters coping with labor shortages?
They invest in automation-ready lines, boosting machinery demand and enabling high-speed, low-labor production.
What impact does SB-54 have on packaging costs?
It introduces compliance fees and a 25% plastic reduction target, raising converter costs by up to 0.7 percentage points of CAGR.
Page last updated on:


 Your data is secure and never sold or shared.


