
Market Overview
| Study Period | 2020 - 2031 |
|---|---|
| Forecast Data Period | 2026 - 2031 |
| Base Year Market Size (2025) | USD 218.37 Billion |
| Market Size (2026) | USD 229.11 Billion |
| Market Size (2031) | USD 290.73 Billion |
| Growth Rate (2026 - 2031) | 4.88 % |
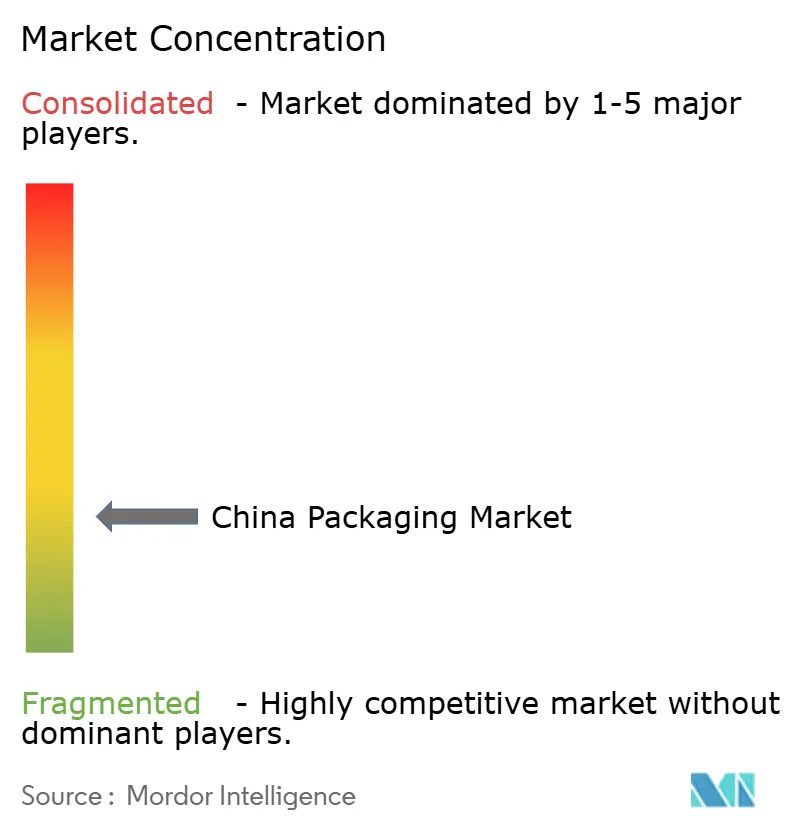
| Market Concentration | Low |
Major Players *Disclaimer: Major Players sorted in no particular order Image © Mordor Intelligence. Reuse requires attribution under CC BY 4.0. | |
China Packaging Market Analysis by Mordor Intelligence
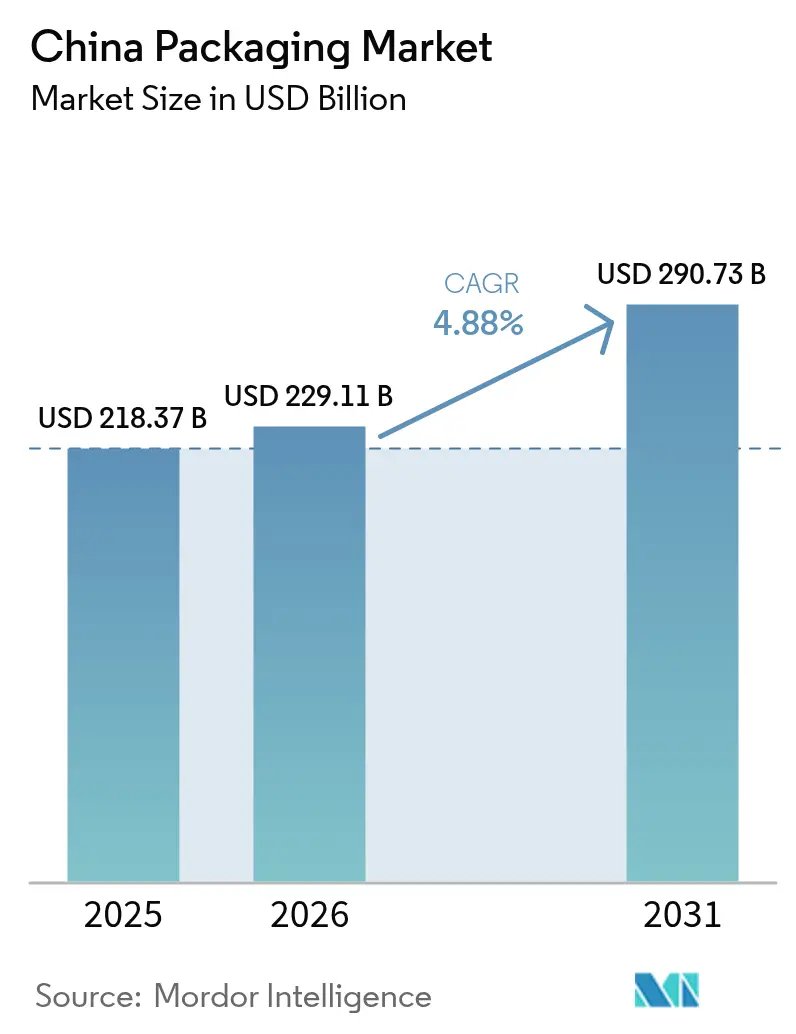
The China packaging market size is projected to be USD 218.37 billion in 2025, USD 229.11 billion in 2026, and reach USD 290.73 billion by 2031, growing at a CAGR of 4.88% from 2026 to 2031. Continued e-commerce expansion, mandatory green-packaging rules, and cold-chain infrastructure upgrades are lifting baseline demand for corrugated boxes, flexible mailers, and insulated shippers. Large platform operators are redesigning ship-from-supplier workflows, which reduces empty space per parcel yet raises the technical sophistication of every layer of the China packaging market. Domestic mills keep adding containerboard and pulp capacity to hedge raw-material swings, while global converters are consolidating to secure scale economies, raw-material leverage, and geographic reach inside the China packaging market.
Key Report Takeaways
- By packaging material, paper and paperboard held 45.83% of the China packaging market share in 2025, whereas plastics will deliver the quickest expansion with a 4.93% CAGR through 2031.
- By packaging type, primary formats accounted for 51.48% of value in 2025, while secondary formats are forecast to log a 5.03% CAGR to 2031.
- By packaging format, flexible solutions commanded 60.48% of the China packaging market size in 2025; the same segment is advancing at a 5.11% CAGR.
- By end-user industry, food and beverages led with a 33.91% revenue share in 2025; healthcare and pharmaceutical applications are growing fastest at a 5.08% CAGR.
Note: Market size and forecast figures in this report are generated using Mordor Intelligence’s proprietary estimation framework, updated with the latest available data and insights as of 2026.
China Packaging Market Trends and Insights
Drivers Impact Analysis*
| Driver | (~) % Impact on CAGR Forecast | Geographic Relevance | Impact Timeline |
|---|---|---|---|
| Explosive Growth of E-Commerce Parcel Volume | +1.2% | National, with concentration in Yangtze River Delta, Pearl River Delta, and Beijing-Tianjin-Hebei cluster | Short term (≤ 2 years) |
| Demand Spike for Sustainable Paper-Based Formats | +0.9% | National, driven by tier-1 and tier-2 cities; spillover to tier-3 cities by 2028 | Medium term (2-4 years) |
| Convenience Ready-to-Drink Food Packaging Adoption | +0.6% | Urban centers (Beijing, Shanghai, Guangzhou, Shenzhen, Chengdu); expanding to lower-tier cities | Medium term (2-4 years) |
| Pharmaceutical Cold-Chain Expansion | +0.7% | National, with early gains in Shanghai, Suzhou, Guangzhou biopharmaceutical clusters | Long term (≥ 4 years) |
| IoT-Enabled Track and Trace Packaging Rollout | +0.4% | Pilot deployments in Yangtze River Delta and Pearl River Delta; national rollout post-2028 | Long term (≥ 4 years) |
| Ultra-Low-Temperature Bio-Pharma Logistics Packaging | +0.3% | Shanghai, Beijing, Guangzhou biomanufacturing hubs; limited provincial reach before 2029 | Long term (≥ 4 years) |
| Source: Mordor Intelligence | |||
Explosive Growth Of E-Commerce Parcel Volume
Parcel throughput climbed from 199 billion pieces in 2025 to a targeted 214 billion in 2026, a scale that already eclipses combined U.S. and EU totals.[1]China Daily staff, “China's Parcel Delivery Volume Reaches 199 Billion Pieces in 2025,” China Daily, chinadaily.com.cn Logistics platforms are eliminating in-warehouse repacking by synchronizing supplier carton dimensions with sorting-center equipment, thereby raising demand for shelf-ready secondary boxes with a higher unit value. Rural e-commerce programs rolled out to 1,212 county-level cities in 2025, expanding the addressable base for the China packaging market far beyond coastal megacities. The State Post Bureau now requires 95% of parcels to use recyclable or degradable materials by 2026, which bumps corrugated-box costs by roughly 8% but accelerates the adoption of water-based adhesives and paper tapes.
Demand Spike For Sustainable Paper-Based Formats
Binding green-packaging targets mandate a 40% reduction in single-use plastics versus 2020 by 2030. Nine Dragons Paper is spending RMB 6 billion (USD 828 million) on a Chongqing complex that will deliver 1.7 million tonnes annually of recycled containerboard by 2027.[2]RISI editorial team, “Nine Dragons Paper Announces Major Expansion in Chongqing,” Fastmarkets RISI, risiinfo.com Century Sunshine Paper launched a RMB 20.2 billion (USD 2.79 billion) coated-paperboard project designed to displace polyethylene-laminated cartons. Closed-loop programs using reusable plastic totes can cut greenhouse-gas emissions 63% after 50 rotations, yet deployment remains limited to metropolitan pilot circles, trimming corrugated use by less than 2% of parcel volume.[3]China Dialogue contributors, “China Wrestles with Packaging Waste,” China Dialogue, chinadialogue.net
Convenience Ready-To-Drink Food Packaging Adoption
Urban consumers favor shelf-stable drinks that fit on-the-go lifestyles, fueling uptake of polyethylene terephthalate bottles, aseptic cartons, and retort pouches. Local and global beverage brands are commissioning high-speed aseptic lines that can switch between tea, dairy, and functional drinks without chemical clean-in-place, cutting changeover time from 45 minutes to 20 minutes. Store-brand and livestreaming promotions push smaller pack sizes, which increases the number of units shipped per sales dollar and multiplies demand for lightweight flexible formats within the China packaging market.
Pharmaceutical Cold-Chain Expansion
Cold-chain volume reached 192 million metric tonnes in the first half of 2025, up 15.2% year on year. National Medical Products Administration rules require temperature validation for every shipment, prompting the rise of phase-change materials and vacuum-insulated panels that keep biologics at 2 °C to 8 °C for 120 hours. The emergence of cell and gene therapies requiring storage at minus 80 degrees Celsius is pushing converters to develop vacuum-insulated panels and phase-change materials that extend payload duration from 48 hours to 120 hours, a capability demonstrated by only 12 domestic suppliers as of December 2025.
Restraints Impact Analysis*
| Restraint | (~) % Impact on CAGR Forecast | Geographic Relevance | Impact Timeline |
|---|---|---|---|
| Plastic Ban and Extended Producer Responsibility Rules | -0.5% | National, with stricter enforcement in Shanghai, Beijing, Shenzhen; uneven provincial compliance | Short term (≤ 2 years) |
| Volatile Pulp and Polymer Feedstock Costs | -0.8% | National, affecting all material segments; coastal mills more exposed to import-price swings | Short term (≤ 2 years) |
| Patchy Provincial Recycling Infrastructure | -0.3% | Inland provinces (Henan, Anhui, Jiangxi) lag coastal regions by 3-5 years in collection rates | Medium term (2-4 years) |
| Reusable Tote Pilots Eroding Urban Corrugated Demand | -0.2% | Beijing, Shanghai, Hangzhou, Shenzhen pilot zones; limited rural penetration before 2029 | Long term (≥ 4 years) |
| Source: Mordor Intelligence | |||
Plastic-Ban and Extended-Producer-Responsibility Rules
Shanghai’s deposit-return program for polyethylene terephthalate bottles achieved a 68% recovery rate within six months, but inland Jiangsu has yet to finalize its framework, complicating nationwide compliance. The State Post Bureau's June 2025 regulation banning non-degradable plastic mailers for e-commerce parcels by 2026 is accelerating the shift to paper-based alternatives, but degradable plastics certified under GB/T 20197 standards cost 40-60% more than conventional polyethylene, a premium that small online merchants are reluctant to absorb, restraining profit transfer into the China packaging market.
Volatile Pulp and Polymer Feedstock Costs
Bleached hardwood kraft pulp fell from USD 600 per tonne in January 2024 to USD 495 in July 2025, then bounced to USD 540 by December 2025, pressuring converters locked into fixed pricing.[4]RISI price desk, “BHKP Prices Fall to Record Low in China,” Fastmarkets RISI, risiinfo.com Polyethylene followed a 12.5% swing across the same window, tied to crude-oil volatility and refinery shutdowns. Large mills countered by hiking containerboard prices RMB 100-150 per tonne, but mid-tier players saw operating margins slide to 5.7%. This volatility stems from overcapacity in Brazilian and Indonesian pulp mills, which flooded the Chinese market in mid-2025, and subsequent production curtailments that tightened supply by year-end.
*Our forecasts treat driver/restraint impacts as directional, not additive. The impact forecasts reflect baseline growth, mix effects, and variable interactions.
Segment Analysis
By Packaging Material: Paper Leadership Faces Plastic Momentum
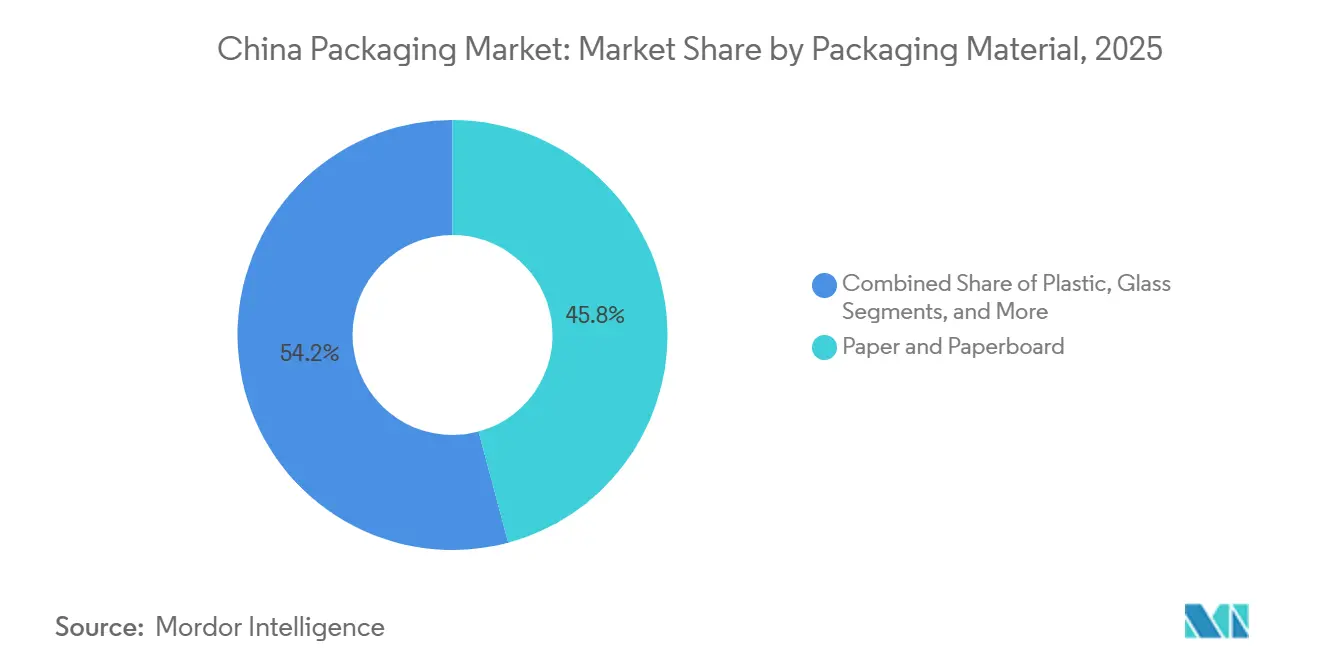
Paper and paperboard held 45.83% of the China packaging market size in 2025, led by over 50 million tonnes per year of domestic containerboard capacity. Nine Dragons Paper alone operated 28.9 million tonnes by mid-2025, ensuring scale supply to Alibaba and JD.com distribution networks. Corrugated demand continues to concentrate around coastal shipping hubs, yet expansion projects in Chongqing and Hubei show inland appetite for capacity
Plastic is the fastest-growing material at a 4.93% CAGR, reflecting pouch adoption for ready-to-drink beverages and blister packs for pharmaceuticals. Flexible resins offer down-gauging potential and transparency but remain exposed to crude-linked cost swings. Glass retains a niche in baijiu and premium beverages, while metal cans stabilize shelf life in energy drinks, keeping a loyal base in urban convenience channels. Together, alternative materials sit below 5% by value, yet bio-based polymers derived from sugarcane are edging into cosmetics as brand owners pursue renewable content credence.


By Packaging Type: Secondary Formats Capture Efficiency Upside
Primary layers represented 51.48% of the China packaging market in 2025, but secondary formats are pacing ahead at a 5.03% CAGR. Walmart China and Carrefour mandated shelf-ready secondary packaging for 78% of dry-grocery SKUs in 2025, a shift that transfers box-opening and shelf-stacking tasks from store employees to upstream suppliers, cutting labor hours per store by an estimated 12%. This trend is reshaping converter strategies; Lee and Man Paper reported that shelf-ready corrugated boxes commanded a 15% price premium versus standard shipping containers in fiscal 2025, contributing to a 38-47% increase in net profit guidance
Converters receive a 15% price premium on shelf-ready corrugated, protecting margins against pulp volatility. Tertiary stretch-film and strapping track baseline logistics growth but face dilution in closed-loop networks using 2.3 million reusable totes installed by JD Logistics. Reverse-logistics costs and size standardization barriers slow tote penetration beyond megacities, ensuring a runway for conventional shrink film inside the China packaging industry.
By Packaging Format: Flexible Solutions Dominate And Accelerate
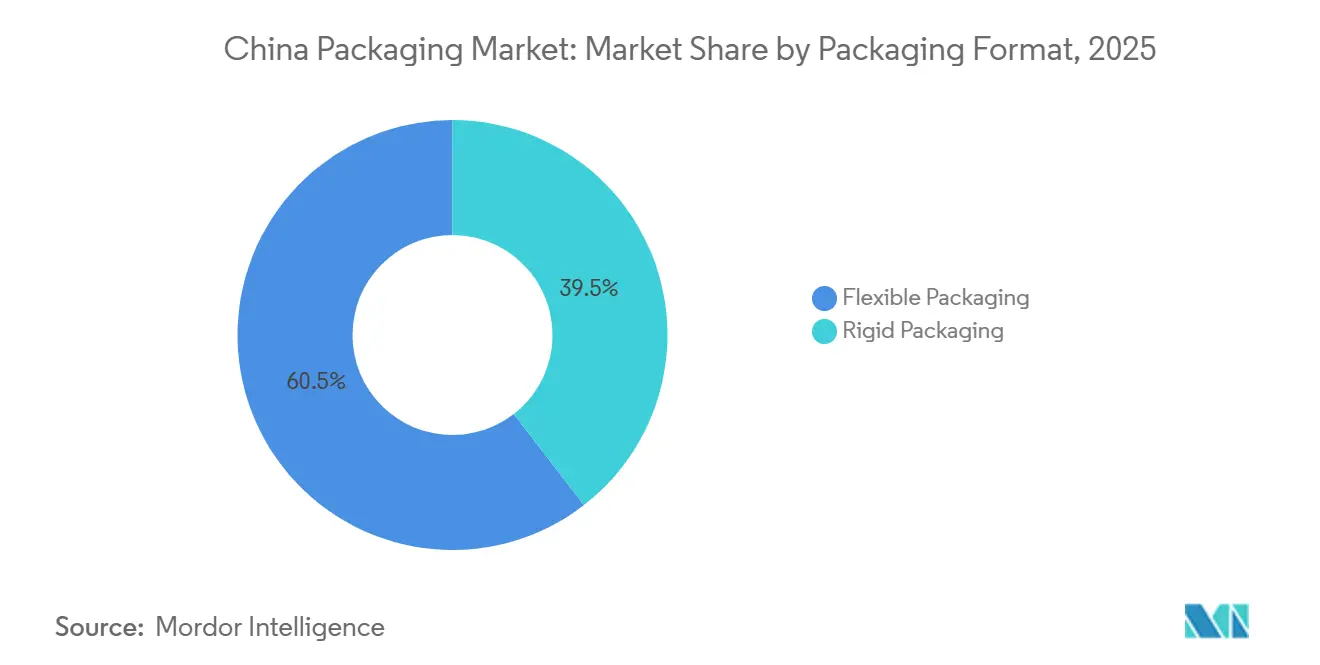
Flexible formats delivered 60.48% of the China packaging market share in 2025 and are expanding at a 5.11% CAGR through 2031. Stand-up pouches for dairy products, sauces, and pet food offer 30-40% weight savings compared to rigid bottles, reducing logistics costs and greenhouse gas emissions per unit delivered.
The April 2025 merger of Amcor and Berry Global created a flexible-packaging leader with USD 23 billion in annual sales and 400 facilities globally and a sharpened focus on emerging Asia. Rigid glass and polyethylene terephthalate hold ground in carbonated drinks and alcohol, where gas barrier and pressure requirements persist. Aseptic-carton pioneer Tetra Pak is estimated to hold a considerable share of ambient dairy packaging but faces price competition from local challenger Greatview Aseptic Packaging, which blends domestic service with lower equipment costs.
By End-User Industry: Healthcare Surges Past Food On Biologics Build-Out
Food and beverages supplied 33.91% of revenue in 2025, aligned with digital grocery growth and impulse snack consumption. Ready-to-drink teas and functional beverages leverage ambient distribution packs that align with just-in-time urban supply chains. Energy drinks, led by brands such as Red Bull China and Eastroc Beverage, experienced significant growth in retail sales in 2024, favoring aluminum cans that convey premium positioning and offer recycling infrastructure in urban centers.
Healthcare and pharmaceutical demand is climbing at 5.08% CAGR as China aims to capture 20% of global biologics output by 2030. Shanghai’s cluster now hosts 47 contract development and manufacturing organizations needing minus-80 °C shippers and serialized labels compliant with draft national track-and-trace rules. Beauty and personal-care brands pursue premium glass and airless pumps, and industrial users gravitate to standardized corrugated or returnable crates to shave cycle time.
Geography Analysis
The Yangtze River Delta and Pearl River Delta together generated a considerable share of the China packaging market in 2025, benefiting from dense manufacturing bases, high e-commerce penetration, and superior port access. Shanghai alone piloted Extended Producer Responsibility and achieved a 68% bottle-return rate within half a year, demonstrating regulatory pull on converter investment. Clustering of pharmaceutical and electronics plants in Suzhou and Ningbo boosts orders for anti-static films and cold-chain shippers.
Inland provinces such as Henan, Anhui, and Sichuan saw double-digit parcel growth, with 1,212 county service centers coming online in 2025. Recycling rates, however, vary widely- Zhejiang recovers 82% of packaging waste versus 34% in Gansu- forcing brand owners to budget 15-20% more for nationwide EPR compliance. Nine Dragons Paper’s Chongqing mill, due in 2027, positions the firm to supply fast-growing western catchments.
Remote western regions such as Xinjiang and Tibet remain underpenetrated, with per-capita packaging spend below 30% of that of their coastal peers. Belt and Road freight corridors are opening small but strategic export channels for converters, enabling them to ride outbound volumes into Central Asia while backhauling recycled fiber. Such flows diversify revenue streams and soften dependence on core eastern seaboards.
Regulatory Landscape
China is tightening packaging compliance around green design, anti-overpackaging, and recyclability, with oversight spanning bodies such as the State Administration for Market Regulation (SAMR) and the Ministry of Industry and Information Technology (MIIT). A key 2026 anchor is SB/T 11266-2026 (Technical and Management Requirements for Green Packaging in E-commerce), issued by the Ministry of Commerce on January 12, 2026 and implemented on July 1, 2026. This raises operational requirements for e-commerce, logistics, and packaging manufacturers as parcel networks shift toward recyclable and degradable materials.
Standards and labeling requirements are also being updated on a defined timeline. SAMR finalized the Food Labeling and Marking Supervision and Management Measures in March 2025, with entry into force on March 16, 2027, and China issued GB 7718-2025 (General Standard for the Labeling of Prepackaged Foods) on March 16, 2025, also implemented from March 16, 2027. Environmental standards continue to expand, including GB/T 16716.6-2024 (Packaging and Environment Part 6: Organic Recycling), implemented on August 23, 2024, while multi-department guidance such as the Industrial Product Green Design Guidelines (2026 Edition), issued April 17, 2026 by departments including MIIT and SAMR, lifts sustainability requirements for packaging design and manufacturing practices.
Value Chain Analysis
China packaging value chains span upstream feedstocks (recovered fiber, pulp, polymers, aluminum and steel), midstream material production and converting (containerboard and packaging board mills, film and resin processors, printers, corrugators, and flexible converters), and downstream demand from e-commerce, food and beverages, healthcare and pharmaceutical, and industrial supply chains. Scale and integration shape upstream bargaining power. Domestic containerboard capacity exceeds 50 million tonnes per year, and leading players such as Nine Dragons Paper and Lee and Man Paper run integrated systems that help manage pulp and recovered paper volatility, while converters differentiate through shelf-ready corrugated, high-speed printing, and barrier flexible structures.
Downstream distribution is increasingly influenced by platform and cold-chain requirements, pushing packaging toward standardized dimensions compatible with automated sorting and toward validated thermal performance for pharma logistics. Compliance is becoming a supply-chain capability rather than a back-end cost. Green-packaging rules for e-commerce (SB/T 11266-2026 effective July 2026) and green-design guidance (2026 Edition led by MIIT and SAMR) are driving lower-VOC production routes such as solvent-free lamination, higher recycled content, and improved recyclability at the design stage. Bottlenecks persist around consistent recycled feedstock quality and uneven provincial recycling infrastructure, but automation investments at converting sites in hubs such as Dongguan, along with emerging inland bases, support faster turnaround and more consistent quality for large brand and platform buyers.
Competitive Landscape
The China packaging market remains fragmented; the five largest suppliers made up a considerable share in 2025. Containerboard is anchored by Nine Dragons Paper, Lee and Man Paper, and Shanying International, which together account for around 18% of linerboard and medium capacity. Scale enables them to negotiate pulp contracts and curb margin erosion via synchronized downtime, such as the 270,000-tonne production halt during Lunar New Year 2026.
State capital is reshaping metal packaging. China Baowu Steel bought China Packaging and Materials Company for HKD 7.65 billion (USD 978 million) in 2024, uniting upstream steel supply with can manufacturing and securing roughly 17% domestic share. Overseas expansion is also gaining momentum, Jihong Group opened a USD 45 million UAE plant in February 2026 to offset softening cigarette volumes at home.
Global consolidation is redrawing flexible-packaging supply maps. The Amcor and Berry Global union promises USD 650 million in synergies and deeper penetration of the China packaging market, while International Paper’s tie-up with DS Smith concentrates corrugated heft in trans-regional trade lanes. Technology plays on the horizon include IoT labels and minus-80 °C shippers, niches served by fewer than 15 qualified domestic providers, offering high-margin refuge from commodity cycles.
China Packaging Industry Leaders
Amcor Plc
Nine Dragons Paper (Holdings) Ltd.
Lee and Man Paper Manufacturing Ltd.
YUTO Packaging Technology Co., Ltd.
Hexing Packaging Co., Ltd.
- *Disclaimer: Major Players sorted in no particular order

Market Opportunities and Future Outlook
Compliance-driven redesign of e-commerce packaging is creating whitespace for suppliers that can document recyclability, deliver stable quality at high volumes, and provide right-sized secondary formats compatible with automated sortation. The July 1, 2026 implementation of SB/T 11266-2026 raises the value of converters and material suppliers offering green-packaging management systems, certified degradable or recyclable alternatives, and lower-VOC production routes such as solvent-free lamination, particularly in high-throughput parcel corridors. Labeling and marking changes on a defined runway, including GB 7718-2025 and SAMR food labeling measures both taking effect on March 16, 2027, also act as a trigger for packaging graphics, compliance workflows, and supplier qualification updates among food, beverage, and cosmetics pack owners.
Export- and high-spec segments add additional upgrade opportunities tied to standardization and manufacturing modernization. In 2026, corporate moves show capacity and capability being added around electronics and high-performance packaging as well as flexible conversion. For example, Amcor starting a 7,000-square-meter expansion at its Dongguan flexible packaging facility (with automated warehousing and solvent-free equipment) and other domestic players advancing intelligent manufacturing bases. These investments support demand for higher-barrier structures, more consistent print quality, and shorter lead times, while aligning with government-led green design guidance and the broader shift toward recyclable-ready and fiber-based solutions across end users including e-commerce, ready-to-drink foods, and cold-chain pharmaceuticals.
Recent Industry Developments
- July 2026: Amcor commenced a 7,000-square-meter expansion at its flexible packaging solutions facility in Dongguan, China, including new manufacturing space and an automated warehouse, with completion slated for July 2027. The project adds capacity and automation for higher-spec flexible structures as brand owners and platforms tighten requirements around material efficiency and sustainable conversion processes.
- May 2026: Amcor announced that its Asia Pacific Innovation Center laboratory in China received accreditation from the China National Accreditation Service for Conformity Assessment (CNAS). The accreditation strengthens in-country testing and validation for packaging performance and compliance, supporting faster qualification cycles for food, healthcare, and other regulated end uses.
- December 2025: UPM and Sappi formed a joint venture in graphic paper, a move that can free up fiber and operational focus that may be redirected toward packaging grades across global supply chains. For China buyers and converters exposed to pulp and paper market swings, upstream portfolio moves like this can affect the availability and pricing of paper-based inputs used in packaging.


Research Methodology Framework and Report Scope
Market Definition and Coverage
We define the China packaging market as the value of packaging products sold for protecting, transporting, storing, and presenting goods across consumer and industrial uses, measured at the point of sale by packaging producers and converters.
Scope exclusions: The sizing excludes the value of packed goods and excludes packaging machinery and equipment revenues.
Segmentation Overview
- By Packaging Material
- Plastic
- Paper and Paperboard
- Glass
- Metal
- Other Materials
- By Packaging Type
- Primary Packaging
- Secondary Packaging
- Tertiary Packaging
- By Packaging Format
- Rigid Packaging
- Flexible Packaging
- By End-User Industry
- Food and Beverages
- Healthcare and Pharmaceutical
- Beauty and Personal Care
- Industrial
- Other End-User Industries
Data Sources, Market Sizing, and Validation
Desk Research
Desk research was used to set the base structure of demand and pricing in a way that stays consistent across packaging materials and end-use categories in China. We relied on public statistics and industry references, including the National Bureau of Statistics of China for industrial output signals, China Customs for import and export trends of key substrates, and the China Packaging Federation for sector context and adoption shifts.
To keep assumptions realistic, price and input movement was checked using public commodity references and government releases, along with peer reviewed papers on packaging materials and recycling outcomes. Company filings, investor presentations, and reputable press were also used to track capacity additions, shutdowns, and product mix changes. For large listed packaging groups, a paid subscription for company financials and intelligence helped confirm revenue direction. These desk sources are not exhaustive, and other public documents and references were also used for collection, cross-checks, and clarification.
Primary Interviews and Surveys
Primary work focused on validating what drives packaging volumes and realized pricing in China, and where category boundaries are commonly mixed up. We spoke with packaging converters, material suppliers, brand procurement teams, logistics and e-commerce pack spec stakeholders, and recycling or compliance specialists, and coverage was balanced across major manufacturing and consumption corridors.
Insights from these conversations were used to confirm material shares, typical price spreads between rigid and flexible formats, and the timing of demand changes by end-user industries, so the final model stays practical and repeatable.
Distribution of primary research fieldwork respondents
| Company type | Respondent position |
|---|---|
| Top tier: 32% | CXOs: 15% |
| Mid tier: 49% | Functional/Unit leaders: 28% |
| Smaller Players: 19% | Managers: 57% |
Market-Sizing & Forecasting
Sizing started with a top-down build where production and trade indicators for key packaging materials and formats are reconstructed into an addressable packaging value pool for China, and then mapped to end-use demand. The totals were checked with selective bottom-up approximations, including sampled ASP multiplied by estimated shipment volumes for common pack formats. We then compared supplier and converter roll-ups for a few high-visibility categories to see if the order of magnitude holds.
Key inputs included output trends in food and beverage, personal care, and pharmaceutical manufacturing, changes in e-commerce parcel activity that shift secondary and tertiary packaging needs, the mix between rigid and flexible packaging, and the relative share movement across plastic, paper and paperboard, glass, and metal. Pricing logic was built using observable resin and paper input movement and typical conversion spreads shared by industry respondents. Where gaps remained, we used proxy ratios from similar end-use categories and then adjusted them after interview validation.
For the forecast, scenario analysis was used so we could separate a base case from faster or slower adoption paths for lightweighting, recycling content requirements, and packaging standardization. Assumptions were finalized only after the forward view on demand drivers and ASP progression was aligned with what respondents describe as feasible over the next few years.
Data Validation & Update Cycle
Validation was done through multiple cross-checks so that one data series does not over-influence the result. We compared model outputs against independent signals like material conversion volumes, trade patterns for key substrates, and the implied per-unit packaging intensity for major end-use categories, and then reviewed outliers before sign-off.
When a variance looked large, analysts revisited the assumption, rechecked the desk sources, and in some cases re-contacted respondents to confirm whether the change was real or timing related. Reports are refreshed annually, and interim updates are made when material events happen, including large capacity shifts, regulation changes, or sharp input cost moves. Before delivery, a fresh final pass is completed so clients receive the latest updated view.
Mordor Intelligence's China Packaging Market Size Measured Against Other Published Estimates
Published market sizes for China packaging do not always line up because each publisher draws the market box differently and then applies its own price and timing choices. Differences usually come from what gets counted as packaging value, which end-use coverage is emphasized, and which base year and currency conversion timing is used.
The main gap comes from whether industrial packaging and tertiary use cases are counted alongside consumer packs, and how pricing is treated during resin and paper cost swings, where Mordor Intelligence counts packaging value across materials and formats using a consistent converter-level pricing view for the base year, rather than mixing retail pack value with producer sales.
Benchmark comparison
| Source | Market Size | Gaps in Research Methodology |
|---|---|---|
| Mordor Intelligence | USD 218.37 B (2025) | |
| Global Research Publisher A | USD 203.49 B (2024) | Uses an earlier base year and appears to allow scope tailoring, which can shift included packaging technologies and end-use coverage, thereby lowering or raising totals depending on what is counted. |
| Industry Research Publisher B | USD 111.50 B (2025) | Tracks consumer packaging only, which excludes a meaningful share of industrial and transport-related packaging value, and it can also apply different growth assumptions by pack level and material. |
The spread across published figures mostly reflects scope and pricing choices rather than a single arithmetic issue. By keeping the market tied to observable material and end-use signals, then checking implied prices with interviews, our estimate stays easier to trace and to replicate when assumptions are updated.


Key Questions Answered in the Report
What is the current size of the China packaging market?
The market is valued at USD 229.11 billion in 2026, on its way to USD 290.73 billion by 2031.
How fast is flexible packaging growing in China?
Flexible formats are advancing at a 5.11% CAGR through 2031, reflecting their 60.48% share in 2025.
Which material leads market share in China’s packaging sector?
Paper and paperboard hold the top position with a 45.83% share as of 2025.
Why is secondary packaging gaining traction among retailers?
Shelf-ready secondary boxes cut in-store labor by roughly 12%, prompting a forecast 5.03% CAGR to 2031.
What drives the surge in pharmaceutical packaging demand?
Expansion of biologics manufacturing and cold-chain logistics is pushing healthcare packaging at a 5.08% CAGR to 2031.
Page last updated on:


 Your data is secure and never sold or shared.


