
Packaged Vegan Food Market Size and Share
Market Overview
| Study Period | 2021 - 2031 |
|---|---|
| Market Size (2026) | USD 27.61 Billion |
| Market Size (2031) | USD 43.9 Billion |
| Growth Rate (2026 - 2031) | 9.72 % |
| Fastest Growing Market | Asia Pacific |
| Largest Market | North America |
| Market Concentration | Low |
Major Players *Disclaimer: Major Players sorted in no particular order Image © Mordor Intelligence. Reuse requires attribution under CC BY 4.0. | |
Packaged Vegan Food Market Analysis by Mordor Intelligence
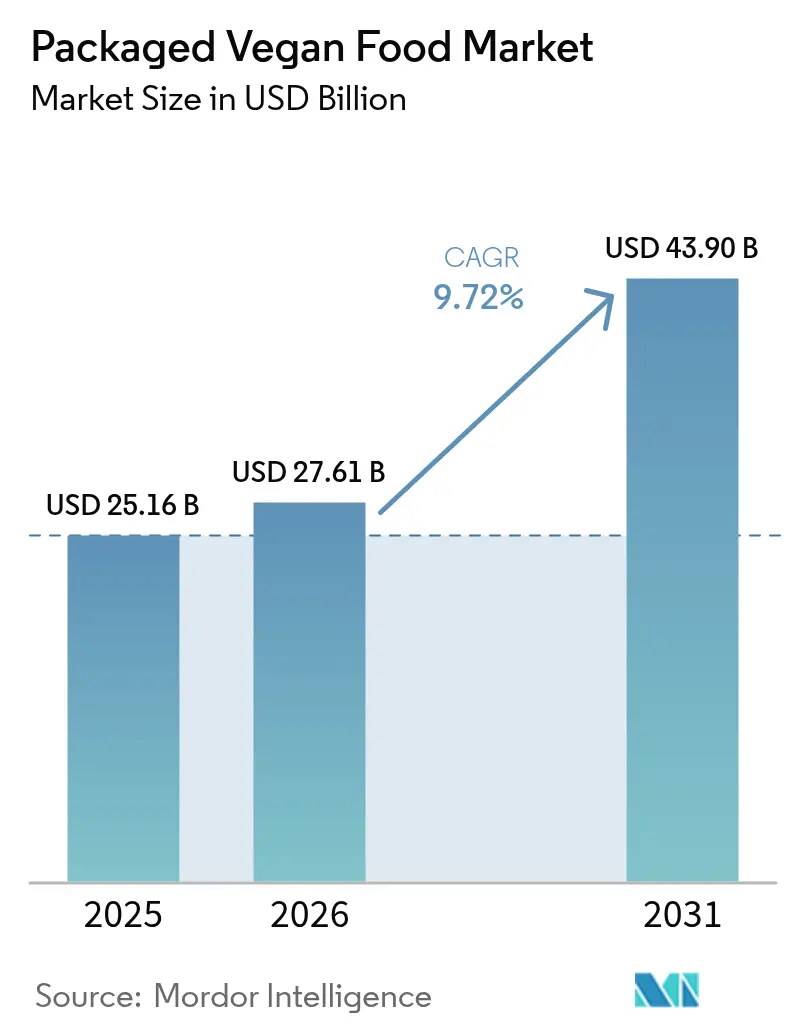
The packaged vegan food market size was valued at USD 25.16 billion in 2025 and estimated to grow from USD 27.61 billion in 2026 to reach USD 43.9 billion by 2031, at a CAGR of 9.72% during the forecast period (2026-2031). Surging consumer interest in plant-centric eating patterns, federal guidance that elevates soy and other fortified plant proteins, and precision-fermentation breakthroughs are turning vegan fare from a niche into a mainstream grocery aisle presence. In 2024, dairy alternatives led value sales, but the newest meat analogs and ready-to-heat vegan meals now match animal proteins on mouthfeel and umami depth, unlocking broad household appeal. Lactose malabsorption affects almost seven in ten people worldwide, giving the category a structural demand floor. Moreover, North American shoppers remain the highest spenders, yet Asia-Pacific is scaling fastest as urbanization, e-commerce penetration, and nutritional awareness converge to lift convenient plant-forward options. Conventional SKUs still dominate volumes; however, products carrying organic certification, clean-label cues, and functional nutrient fortification are winning incremental spend and retailer shelf visibility.
Key Report Takeaways
- By product type, dairy alternatives captured 41.88% revenue share in 2025; meat alternatives and packaged vegan meals are forecast to expand at a 10.33% CAGR to 2031.
- By nature, conventional items held 82.54% of sales in 2025, while organic variants are projected to grow at an 11.08% CAGR through 2031.
- By category, mass-market offerings accounted for 69.62% of 2025 revenues, whereas premium SKUs are poised to rise at an 10.88% CAGR between 2026 and 2031.
- By distribution channel, supermarkets and hypermarkets led with a 39.85% share in 2025; online retail stores are expected to post the fastest 10.05% CAGR over the same period.
- By geography, North America contributed 35.21% of 2025 turnover, yet Asia-Pacific is set to register the strongest 9.76% CAGR to 2031.
Note: Market size and forecast figures in this report are generated using Mordor Intelligence’s proprietary estimation framework, updated with the latest available data and insights as of 2026.
Market Trends and Insights
Drivers Impact Analysis of Packaged Vegan Food Market*
| Driver | (~) % Impact on CAGR Forecast | Geographic Relevance | Impact Timeline |
|---|---|---|---|
| Rising health awareness promotes vegan foods | +2.1% | Global, with concentration in North America and Europe | Medium term (2-4 years) |
| Growing incidence of lactose intolerance and food allergies | +1.8% | Global, highest in Asia-Pacific and North America | Long term (≥4 years) |
| Expanding vegan and flexitarian populations seek convenient packaged options | +1.6% | Europe and North America core, spill-over to Asia-Pacific | Medium term (2-4 years) |
| Product innovations enhance taste, texture, and nutrition to mimic traditional foods | +1.9% | Global, led by North America and Europe research and development hubs | Short term (≤2 years) |
| Marketing campaigns highlight health, ethical, and eco-friendly benefits | +0.9% | Global, with premium segment focus in developed markets | Medium term (2-4 years) |
| Ethical concerns over animal welfare drive demand for cruelty-free alternatives | +1.3% | Europe and North America, emerging in Asia-Pacific urban centers | Long term (≥4 years) |
| Source: Mordor Intelligence | |||
Rising health awareness promotes vegan foods
The increasing focus on health and wellness is driving demand for vegan foods, attributed to benefits such as reduced cholesterol levels and improved digestion. This trend aligns with the growing vegan and flexitarian populations seeking convenient packaged options. Innovations in product development are improving the taste, texture, and nutritional profile of vegan foods to closely replicate traditional products while meeting health objectives. A report by the Good Food Institute Europe (GFI Europe) highlights that by 2025, 51% of adults in the United Kingdom and Germany plan to adjust their diets by either increasing plant-based food consumption or reducing animal meat and dairy intake, with approximately 20% intending to do both [1]. This shift is fueling demand for alternatives like Oatly's oat milk, known for its cholesterol-lowering properties. Marketing campaigns emphasizing health benefits, ethical concerns over animal welfare, and environmental sustainability are further influencing consumer choices. Plant-based products, which contribute to a reduced carbon footprint, are gaining traction, particularly through online retail platforms offering access to innovative options such as Daiya's cheese alternatives, which support dairy-free digestion. Regulatory support for sustainable agriculture and initiatives like ethical sourcing are also bolstering the production and appeal of these health-focused products, catering to conscious consumers prioritizing wellness through packaged vegan snacks.
Growing incidence of lactose intolerance and food allergies
The rising prevalence of lactose intolerance and food allergies is driving demand for dairy alternatives, contributing to the growth of the packaged vegan food market. Lactose malabsorption affects a significant portion of the global population, particularly in East Asia and the United States, where many consumers face digestive challenges that limit traditional dairy consumption. This has increased the demand for plant-based dairy substitutes, such as Alt Co's oat milk, which offers a lactose-free option with comparable nutritional benefits. Additionally, the growing incidence of food allergies, including milk and soy allergies, has heightened the need for allergen-conscious products. Regulatory changes, such as the FDA's 2023 rule mandating sesame labeling, have led to reformulation efforts in packaged food like vegan bakery and confectionery products, reducing allergenic ingredients and improving accessibility for sensitive consumers [2]. These health-driven trends are particularly evident in Asia-Pacific markets, such as China and India, where traditional high dairy consumption contrasts with genetic predispositions, thereby accelerating the adoption of plant-based alternatives. Brands such as Kate Farms are capitalizing on this opportunity by leveraging allergen-free certifications to attract a broader consumer base. Combined with advancements in product innovation and sustainability initiatives, these factors are collectively driving the packaged vegan food market by addressing diverse dietary and health needs globally.
Expanding vegan and flexitarian populations seek convenient packaged options
The increasing adoption of vegan and flexitarian diets is driving demand for convenient packaged options, supported by growing health awareness that emphasizes the benefits of vegan foods, such as reduced cholesterol and improved digestion. Consumers are focusing on product innovations that enhance taste, texture, and nutrition to replicate traditional foods for daily consumption. Data from Good Food Institute Europe (GFI Europe) indicates that 37% of German households purchased plant-based milk, and 32% purchased plant-based meat at least once in 2024, highlighting the shift toward accessible products like Beyond Meat's ready-to-cook patties, which cater to busy lifestyles while meeting health objectives [3]. Ethical concerns regarding animal welfare and environmental sustainability are also influencing purchasing decisions, as plant-based options are associated with lower carbon footprints. The expansion of online retail has further improved access to these products, complemented by marketing campaigns that emphasize their diverse benefits. Regulatory support for sustainable agriculture is fostering production tailored to flexitarian preferences, while sustainability initiatives, such as ethical sourcing, appeal to this demographic. These developments align with the creation of palatable vegan alternatives, making the transition to packaged vegan meals seamless for health-conscious households seeking convenient and sustainable food options.
Product innovations enhance taste, texture, and nutrition to mimic traditional foods
Innovations in product development, particularly those enhancing taste, texture, and nutrition, are driving demand in the packaged vegan food market. Companies are focusing on reducing the sensory gap between plant-based alternatives and traditional animal-based products. Advances in ingredient engineering, including precision-blended plant proteins, improved emulsification, and natural flavor modulators, enable vegan products to replicate the creaminess of dairy, the texture of meat, and the richness of confectionery, appealing to consumers who value familiarity. These advancements also address nutritional equivalence, with fortified formulations that match or exceed the protein, calcium, and micronutrient content of conventional foods, supporting health-conscious adoption. Brands such as Miyoko’s Creamery utilize fermentation-based techniques to recreate artisanal cheese textures, combining craftsmanship with scientific innovation to enhance sensory appeal. Similarly, Impossible Foods employs heme-based flavor chemistry to replicate meat-like juiciness, effectively attracting flexitarian consumers. These developments create a reinforcing cycle: improved sensory quality drives consumer trials, broader acceptance expands the category, and market growth incentivizes further technological advancements. As a result, the market is transitioning from catering to niche vegan consumers to appealing to a wider audience seeking indulgent, nutritious, and familiar plant-based alternatives without compromising on taste or texture.
Restraints Impact Analysis of Packaged Vegan Food Market*
| Restraint | (~) % Impact on CAGR Forecast | Geographic Relevance | Impact Timeline |
|---|---|---|---|
| Fluctuating raw material prices raise production expenses | -1.4% | Global, with acute pressure in Asia-Pacific and South America | Short term (≤2 years) |
| Taste and texture challenges persist, deterring some consumers from switching | -0.9% | Global, most pronounced in North America and Europe | Medium term (2-4 years) |
| Higher price points compared to conventional foods limit broader appeal | -0.7% | Global, with affordability gaps widest in emerging markets | Long term (≥4 years) |
| Stringent food safety and labeling regulations increase compliance costs | -0.5% | Europe and North America, emerging in Asia-Pacific | Medium term (2-4 years) |
| Source: Mordor Intelligence | |||
Fluctuating raw material prices raise production expenses
Fluctuating raw material prices present a significant challenge for the packaged vegan food industry. Key plant-based inputs, such as pea protein isolate, soy protein concentrate, and oat bases, are heavily influenced by agricultural commodity cycles, which are prone to sharp variations caused by factors like drought-induced shortages and surplus-driven corrections. These unpredictable cost changes disrupt production planning and compromise pricing stability, particularly for smaller or emerging brands that lack vertical integration, diversified sourcing strategies, or long-term procurement contracts to manage volatility. Rising raw material costs compress gross margins, limiting manufacturers' ability to invest in branding, innovation, and new product development, critical for maintaining competitiveness in this dynamic market. Larger companies with diversified portfolios may absorb these fluctuations more effectively, but niche players often respond by reformulating products or reducing volumes, which can impact sensory quality and customer retention. For example, brands like Nutpods, which rely heavily on almond and coconut bases, face difficulties in maintaining consistency and must carefully manage inventory to avoid passing sudden cost increases onto consumers. This volatility also pressures suppliers, processors, and retailers to balance profitability with consumer expectations for affordable plant-based products. Persistent instability in crop-derived ingredient costs undermines operational predictability, economies of scale, and innovation, collectively restraining the market's growth potential.
Higher price points compared to conventional foods limit broader appeal
Premium pricing continues to hinder the adoption of packaged vegan foods, as consumers often perceive plant-based alternatives as high-end products rather than everyday staples. Elevated costs arise from expensive inputs, specialized processing, and smaller production scales, making it difficult for these products to compete with traditional dairy, meat, or bakery items on price. This affordability gap particularly affects price-sensitive households, which may be open to trying vegan options but are less likely to make consistent purchases. Brands face the challenge of balancing premium formulations with accessibility, but frequent cost–quality trade-offs risk undermining product performance and consumer trust. Retail competition exacerbates the issue, as shoppers often compare vegan products directly with lower-priced conventional alternatives on the same shelf. For instance, Califia Farms, known for its almond and oat-based beverages, demonstrates how premium pricing can enhance brand perception but limit penetration in value-driven markets where consumers hesitate to switch. This pricing barrier also reduces repeat purchase rates, preventing the economies of scale needed to lower costs. Over time, this creates a cycle where high prices restrict sales volume, limited volume reduces efficiency, and inefficiency sustains elevated prices—ultimately narrowing the consumer base despite growing interest in plant-based diets.
*Our forecasts treat driver/restraint impacts as directional, not additive. The impact forecasts reflect baseline growth, mix effects, and variable interactions.
Packaged Vegan Food Market Segment Analysis
By Product Type:
Meat Alternatives Outpace Dairy GrowthMeat alternatives and packaged vegan meals are anticipated to experience the highest growth among product types, with a CAGR of 10.33% from 2026 to 2031. Technological advancements, including precision fermentation and high-moisture extrusion, have significantly improved the fibrous textures of these products, enabling them to replicate whole-muscle cuts rather than just ground meat analogs. The FDA’s 2024 approval of GRAS status for soy leghemoglobin and mycoprotein-derived proteins has further reduced regulatory barriers, enhancing the ability of next-generation meat analogs to replicate the heme iron content and umami flavor profile of animal meat. Companies such as Beyond Meat are leveraging these innovations to attract flexitarian consumers by offering products that closely mimic traditional meat. However, challenges related to sensory experience and repeat purchases remain, presenting opportunities for growth in fostering habitual consumption.
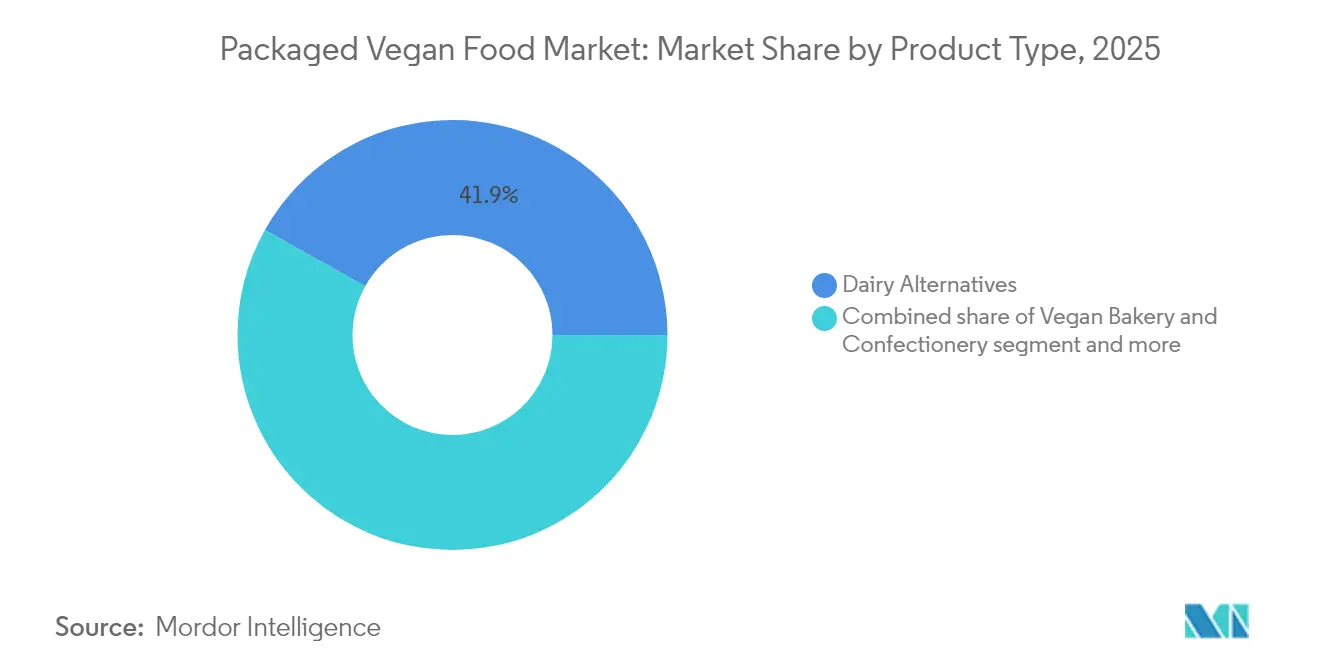
Dairy alternatives held a significant 41.88% market share in 2025, supported by products like oat milk, almond milk, and coconut yogurt, which have achieved near parity with dairy counterparts in applications such as coffee and breakfast cereals. Established distribution networks and strong consumer familiarity, as seen with products like Oatly's oat milk, provide a competitive edge. Meanwhile, vegan bakery and confectionery products face reformulation challenges due to the FDA’s 2024 sesame allergen labeling rule, necessitating ingredient substitutions. The "others" category, including snacks, non-dairy whipping cream, and plant-based condiments, is gaining momentum as brands expand into adjacent segments, highlighting opportunities for growth across niche categories.

By Nature:
Organic Certification Commands Premium GrowthOrganic-certified vegan packaged foods are anticipated to grow at a CAGR of 11.08% from 2026 to 2031, surpassing conventional products, which accounted for 82.54% of the market share in 2025. Certifications such as the USDA National Organic Program and EU Organic Regulation (EC) 2018/848 support premium pricing by ensuring non-GMO inputs, the absence of synthetic pesticides, and compliance with stringent third-party verification standards. Although these requirements increase production costs, they enable brands to charge 20-30% higher retail prices, appealing to health-conscious consumers willing to invest in quality and sustainability. This growth is driven by rising health awareness and environmental concerns, as organic products attract consumers focused on wellness and eco-friendly values. For instance, The Hain Celestial Group utilizes organic certifications to enhance brand credibility and justify premium pricing for its vegan product lines in competitive markets.
Conventional packaged vegan foods continue to dominate the market due to their affordability and extensive retail distribution networks, ensuring broad availability and encouraging consumer trials. However, growth in this segment is slower compared to organic offerings, as premium and organic products capture a larger share of incremental consumer spending, particularly in affluent and niche markets. This trend is supported by the growing vegan and flexitarian populations seeking quality and convenience, driving innovation in products that combine organic ingredients with improved taste and texture. Sustainability initiatives further influence consumer preferences, with ethical sourcing and organic certifications gaining prominence. Brands like Follow Your Heart address diverse consumer needs by offering both conventional and organic vegan products.
By Category:
Premium Positioning Captures Affluent CohortsPremium vegan food products are gaining traction among affluent consumer groups, with an anticipated CAGR of 10.88% from 2026 to 2031. This growth is driven by advancements such as omega-3, vitamin B12, and fermentation-derived heme protein fortifications, addressing nutritional gaps often associated with plant-based diets. These enhancements deliver specific health benefits, meeting the rising demand for functional and clean-label products. For example, Quorn’s plant-based range employs fermentation techniques to improve micronutrient content while avoiding saturated fat and cholesterol, appealing to health-conscious consumers willing to pay a 20-30% premium. Premium offerings differentiate themselves through features like organic certification and non-GMO verification, targeting affluent urban markets.
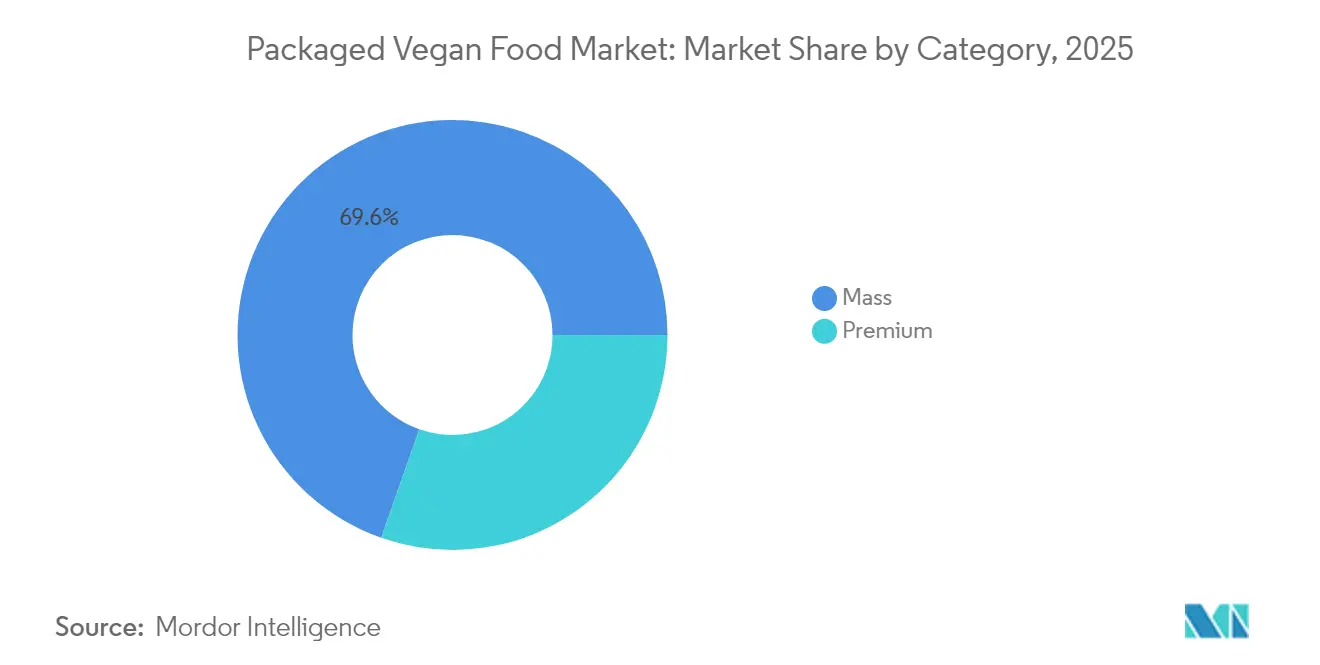
Mass-market vegan products continue to dominate with a 69.62% market share in 2025, supported by established distribution networks such as supermarkets and hypermarkets, and competitive pricing with conventional foods. These products cater to budget-conscious households, particularly in emerging markets where urbanization and increasing disposable incomes drive demand for affordable vegan options. The Asia-Pacific region exemplifies this trend, with a 9.76% CAGR in mass-market products fueled by growing consumption in cities like Shanghai, Mumbai, and Singapore. Meanwhile, premium product growth remains concentrated in affluent urban areas of North America and Europe, where consumers prioritize fortified functional benefits and clean-label ingredients, creating a clear segmentation between mass-market and premium categories within the packaged vegan food market.
By Distribution Channel:
E-Commerce Disrupts Traditional RetailE-commerce retail channels are transforming the distribution landscape in the packaged vegan food market, recording a 10.05% CAGR from 2026 to 2031, the highest among all channels. Online platforms employ direct-to-consumer models, enabling personalized nutrition messaging and subscription-based replenishment services, which traditional retailers find difficult to replicate. This approach strengthens customer loyalty and supports brands that utilize e-commerce to deliver tailored product recommendations and convenient home delivery. In comparison, supermarkets and hypermarkets held a 39.85% market share in 2025, benefiting from established shelf space and high foot traffic. However, their slower growth stems from prioritizing high-velocity dairy and meat products, limiting opportunities for emerging plant-based brands to scale effectively through traditional retail.
Convenience and specialty stores cater to niche demands, facilitating impulse purchases and offering curated assortments for health-conscious consumers. However, their limited scale constrains their overall market impact. Smaller brands increasingly leverage e-commerce to bypass slotting fees and promotional allowances required in traditional retail, accelerating product innovation cycles critical to this dynamic industry. While supermarkets and hypermarkets benefit from cross-category shopping trips, their growth is slowing as consumers shift toward online platforms offering broader assortments, competitive pricing, and home delivery. Brands like Beyond Meat are expanding their presence across e-commerce channels, appealing to digital-savvy consumers seeking convenient plant-based alternatives. This shift highlights the strategic advantages of e-commerce, reshaping consumer access and competitive dynamics in the packaged vegan food market.
Geography Analysis
North America Packaged Vegan Food Market
North America accounted for 35.21% of global revenue in 2025, supported by a well-established retail infrastructure, high per-capita consumption of plant-based proteins, and consumer readiness to pay premiums for ethically sourced and organic-certified products. This strong foundation for dairy alternatives is further reinforced by lactose malabsorption, which affects 36% of the United States population, according to the National Library of Medicine. Structural demand, independent of ethical considerations, drives adoption in urban centers such as Toronto and Mexico City. Canada and Mexico contribute to this growth through the availability of convenient packaged vegan meals and snacks. Brands like Amy's Kitchen capitalize on consumer willingness to pay premiums by offering certified organic frozen vegan meals tailored to high-consumption households. These factors, combined with established distribution networks, facilitate market penetration despite higher price points.
Europe Packaged Vegan Food Market
Europe holds a significant market share, driven by Germany's 39% penetration of plant-based alternatives in 2024 and the Netherlands' 25% penetration of vegetarian and vegan meals, as reported by the Federal Ministry of Food and Agriculture and Statistics Netherlands. The European Food Safety Authority updated its Novel Foods Regulation in 2024, reducing approval timelines for fermentation-derived ingredients from eighteen to twelve months. This regulatory clarity lowers compliance costs for smaller innovators across the United Kingdom, France, Spain, and Italy, where urban centers lead adoption while rural areas lag. Emerging contributors include Poland, Belgium, and Sweden. Growth in the region aligns with global averages, balancing cultural acceptance with economic challenges and price sensitivity. Daiya Foods benefits from the reduced time-to-market for its cheese alternatives, enhancing its competitiveness in these diverse markets.
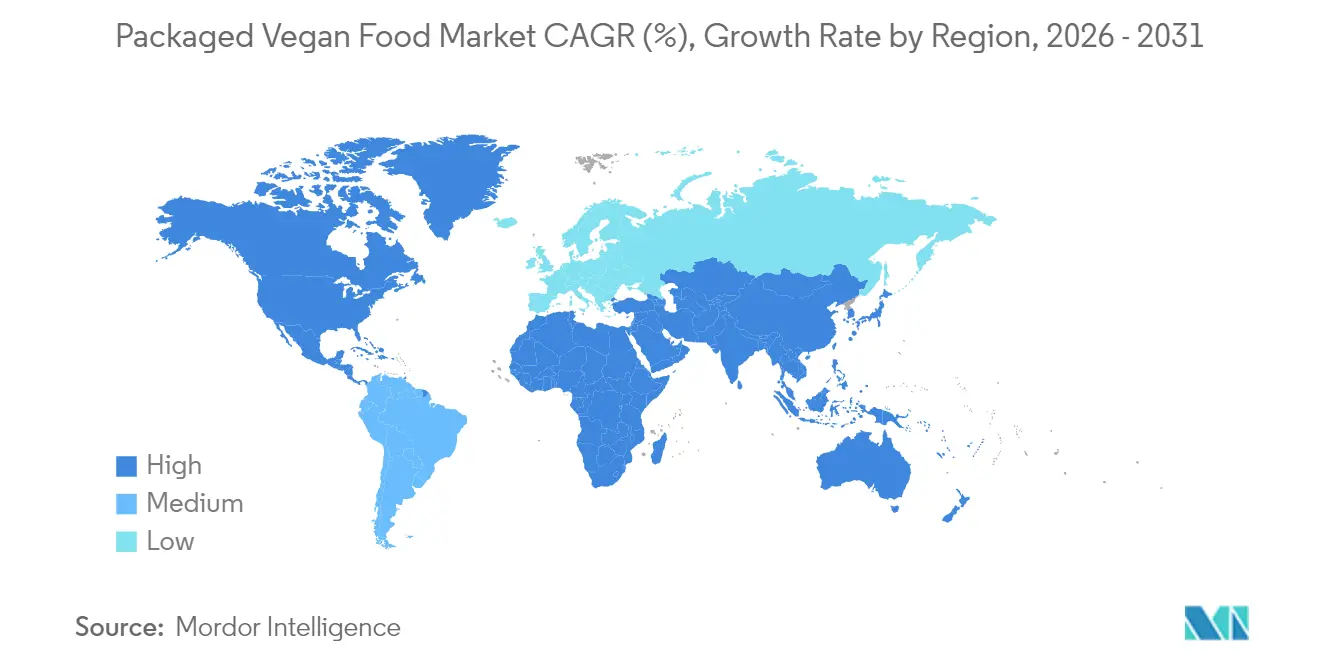
APAC, South America and MEA Packaged Vegan Food Market
Asia-Pacific is projected to grow at a compound annual growth rate of 9.76% from 2026 to 2031, driven by urbanization, rising disposable incomes, and high lactose intolerance rates in East Asian populations, as reported by the National Library of Medicine. India's Food Safety and Standards Authority has introduced clearer labeling standards, reducing consumer confusion compared to traditional dairy products. Urban centers such as Shanghai, Mumbai, Tokyo, and Singapore lead adoption, while Australia, Indonesia, South Korea, and Thailand represent high-growth markets for mass-market vegan products. MorningStar Farms capitalizes on these trends by expanding its plant-based meat offerings in highly urbanized areas. South America and the Middle East, and Africa lag due to affordability challenges and limited distribution networks. However, regulatory developments in Brazil and Argentina, along with emerging markets in South Africa and the United Arab Emirates, indicate early potential despite enforcement inconsistencies hindering the entry of international brands.
Regulatory Landscape
Regulation for packaged vegan foods is tightening around labeling clarity, allergen disclosure, and the permitted use of animal-associated terms, raising compliance needs for brands operating across multiple jurisdictions. In the United States, the FDA issued draft guidance in January 2025 for labeling plant-based alternatives to animal-derived foods, recommending that the statement of identity include the specific plant source to reduce consumer confusion (covering alternatives to eggs, seafood, poultry, meat, and dairy products, excluding milk alternatives). In parallel, legislative activity has accelerated, including the FAIR Labels Act introduced in April 2026 in the US Congress, reflecting continued scrutiny of marketing claims and nomenclature for plant-based proteins.
Europe is also tightening policy momentum on product naming. In 2026, EU-level action restricts the use of certain meat-associated terms for plant-based products while allowing others such as burger and sausage. At the international level, ISO 8700:2025 (published in 2026) provides definitions and technical criteria for labeling and claims for foods containing no animal-derived ingredients, creating a reference point for multinational companies looking to harmonize packaging language and substantiate claims across export markets.
Value Chain Analysis
The packaged vegan food value chain starts with crop and input supply (peas, soy, oats, pulses, and oilseeds), followed by primary processing (milling and fractionation). Ingredient manufacture then covers protein concentrates and isolates, textured proteins, fats, flavors, and fortification premixes, before downstream CPG manufacturers convert these inputs into dairy alternatives, meat analogs, bakery items, and ready meals. Products move through cold-chain and ambient logistics into supermarkets and hypermarkets, specialty retail, foodservice, and rapidly scaling online retail stores. Marketing, certification, and quality systems, such as audit-ready standards like BRCGS or FSSC 22000, function as gating requirements for broader distribution.
Constraints tend to cluster upstream and midstream. Limited availability of identity-preserved and non-GMO feedstocks, gaps in high-protein processing capacity, and insufficient specialized extrusion or fermentation infrastructure can limit the next generation of textures and functionality. Certification and supply-chain audit requirements can also add weeks to ingredient lead times, which encourages longer-term procurement contracts, multi-sourcing strategies, and more regionalized processing hubs near crop origins. Industry coalitions, including the European Alliance for Plant-based Foods and the Plant Based Foods Association, are active in setting policy and value-chain priorities, tying regulatory developments (FDA labeling guidance and EU terminology restrictions) to investments in sourcing resilience and processing capacity.
Competitive Landscape
The packaged vegan food industry is characterized by high fragmentation, as reflected in a low market concentration score of 3 out of 10. This competitive landscape includes established food corporations such as Danone and Nestlé, which prioritize cost efficiency through economies of scale to retain market share. In contrast, venture-backed companies like Beyond Meat and Impossible Foods focus on precision fermentation to develop innovative proteins with enhanced taste and nutritional benefits. Smaller regional players, including GoodDot in India, Vezlay Foods, and v2food in Australia, capitalize on local ingredient sourcing and cultural familiarity to establish distinct market positions. By addressing regional preferences, these companies effectively compete with larger multinational firms.
Emerging markets offer substantial growth opportunities due to affordability challenges and underdeveloped retail distribution systems. Companies that provide products with comparable taste at affordable price points for middle-income consumers are well-positioned to capture market share. Urbanization in these regions is driving demand for convenient packaged vegan options, while evolving consumer preferences toward healthier and sustainable diets further support market expansion. However, these regions remain underserved compared to more developed markets. The rise of private-label alternatives in supermarkets and hypermarkets adds to competitive pressures, as these products often offer lower prices. This pricing dynamic compels branded companies to differentiate their offerings through added functional benefits, such as omega-3 fortification and probiotic cultures targeting specific health needs.
Market dynamics indicate an acceleration in consolidation, mergers, and acquisitions as financially constrained disruptors seek liquidity and established corporations pursue inorganic growth to access emerging consumer segments. For example, in 2023, Nourish You's acquisition of vegan dairy brand One Good highlights a strategic effort to expand its plant-based product portfolio and penetrate premium segments. At the same time, private-label brands continue to exert downward pricing pressure across key retail channels. The fragmented market structure and intensifying competition drive ongoing innovation and strategic realignments, ensuring the packaged vegan food industry remains dynamic and rapidly evolving on a global scale.
Packaged Vegan Food Industry Leaders
-
Danone S.A.
-
Beyond Meat, Inc.
-
Impossible Foods Inc.
-
Oatly Group AB
-
Kellanova
- *Disclaimer: Major Players sorted in no particular order

Packaged Vegan Food Market Companies Covered in this Report
- Amy's Kitchen, Inc.
- Beyond Meat, Inc.
- Danone S.A.
- Tofutti Brands, Inc.
- General Mills, Inc.
- Post Holdings, Inc.
- Dr. McDougall's Right Foods
- Impossible Foods Inc.
- Otsuka Holdings Co Ltd
- Eden Foods, Inc.
- Oatly Group AB
- SunOpta Inc.
- Kellanova
- Conagra Brands, Inc.
- Maple Leaf Foods Inc.
- The Hain Celestial Group, Inc.
- Nestlé S.A.
- v2food
- GoodDot Enterprises Private Limited
- Vezlay Foods Pvt. Ltd.
Market Opportunities and Future Outlook
A key opportunity lies in scaling cost-competitive protein inputs and improving supply assurance through regional processing investments, particularly where brands face volatility in pea, soy, and oat-based ingredients. In Europe, new capacity additions and process shifts toward more resource-efficient production are visible as whitespace: Happy Plant Protein deployed dry extrusion at an industrial-scale facility in Latvia (announced April 2026), and Bankom completed a soybean processing expansion in Belgrade, Serbia, including a textured soy protein plant with 20,000 tonnes of annual capacity (reported July 2026). These steps support more localized sourcing and shorter supply chains for meat alternatives, vegan meals, and other packaged formats that depend on consistent textured protein supply.
Beyond core plant-based meat and dairy, product expansion also creates room for packaged vegan propositions positioned on nutrition and functionality, including fermentation-enabled proteins and fortified everyday staples. The Every Company partnered with ADM in July 2026 to begin commercial-scale production of its animal-free egg white ingredient (OvoPro) at an ADM facility in Clinton, Iowa, which creates a clearer pathway for vegan bakery, confectionery, and prepared-food manufacturers that need egg-white-like functionality. At the ingredient level, system innovation such as dsm-firmenich taste-modulation embedded into textured vegetable proteins supports reformulation and line extensions aimed at improved sensory performance while responding to stricter labeling expectations across the US and Europe.
Recent Industry Developments in Packaged Vegan Food Market
- July 2026: Beyond Meat announced the expansion of its Beyond Steak Filet into Meijer stores. The broader retail placement supports greater household trial for whole-cut-style plant-based meat formats and strengthens the brand's conventional grocery penetration beyond early-adopter channels.
- June 2026: Danone entered definitive agreements to acquire Melbourne-based MADE Group, including the plant-based coconut brand Cocobella, and to acquire the remaining 49% stake in its fresh dairy joint venture with Saputo Dairy Australia. The move adds regional manufacturing and brand assets that can be leveraged to broaden Danone's plant-based and adjacent better-for-you offerings in Oceania.
- October 2025: Blue Tribe launched Korean Soya Chaap and Spicy Kebab in India. The launch underscores intensifying flavor-led localization in packaged vegan meats and reflects a strategy of using familiar regional formats and bold seasonings to drive repeat purchase in price-sensitive, high-growth urban markets.
Packaged Vegan Food Market Report Scope and Research Methodology
Market Definition and Coverage
This market covers packaged food and beverage products that are labeled and sold as vegan, where ingredients and processing aids avoid animal-derived inputs. We size the value of finished, packaged items sold through retail and retail-like channels, counted at the point of sale to the end buyer.
Scope exclusions: foodservice-only sales (restaurants and cafes), unpackaged deli items, and non-food vegan products such as supplements, cosmetics, or apparel are excluded.
Segments Covered in This Report
- By Product Type
- Dairy Alternatives
- Meat Alternatives and Packaged Vegan Meals
- Vegan Bakery and Confectionery
- Others (Snacks, Non-dairy Whipping Cream, etc.)
- By Nature
- Conventional
- Organic
- By Category
- Mass
- Premium
- By Distribution Channel
- Supermarkets/Hypermarkets
- Convenience Stores
- Specialty Stores
- Online Retail Stores
- Other Distribution Channels
- By Geography
- North America
- United States
- Canada
- Mexico
- Rest of North America
- Europe
- Germany
- United Kingdom
- Italy
- France
- Spain
- Netherlands
- Poland
- Belgium
- Sweden
- Rest of Europe
- Asia-Pacific
- China
- India
- Japan
- Australia
- Indonesia
- South Korea
- Thailand
- Singapore
- Rest of Asia-Pacific
- South America
- Brazil
- Argentina
- Colombia
- Chile
- Peru
- Rest of South America
- Middle East and Africa
- South Africa
- Saudi Arabia
- United Arab Emirates
- Nigeria
- Egypt
- Morocco
- Turkey
- Rest of Middle East and Africa
- North America
Data Sources, Market Sizing, and Validation
Desk Research
Desk research is used to set the market boundaries and to anchor the model with consistent, public reference series. We mainly rely on sources such as USDA and ERS food availability and price series, the US Census Bureau's trade and retail benchmarks, UN Comtrade for cross-border flows, FAO food balance sheets, and Eurostat consumption and price indicators where applicable.
On the industry side, we also review company annual reports and investor presentations for category revenue splits, along with trade association releases and reputable press for launches, labeling changes, and distribution expansion. In parallel, we use paid subscriptions for company financials and news screening, plus patent database checks to understand where innovation is concentrating across vegan formulations and packaging. These examples are not exhaustive, and many other public and paid sources were consulted for data collection, validation, and clarification.
Primary Interviews and Surveys
Primary work is used to pressure-test the desk assumptions and to fill gaps that public data does not explain well, especially on pricing ladders, channel mix, and how fast new vegan lines scale. We speak with a mix of brand owners, ingredient and co-manufacturing participants, distributors, and retail-category contacts across APAC, EMEA, and the Americas. When interview inputs flag mismatches, we re-check outliers before incorporating them into the market view.
Distribution of primary research fieldwork respondents
| Company type | Respondent position | Region |
|---|---|---|
| Top tier: 33% | CXOs: 16% | APAC: 44% |
| Mid tier: 47% | Functional/Unit leaders: 24% | EMEA: 35% |
| Smaller Players: 20% | Managers: 60% | Americas: 21% |
Market-Sizing & Forecasting
Sizing starts with a top-down build where retail demand pools are reconstructed using country-level packaged food spending, vegan and plant-forward adoption indicators, and observed category penetration in modern trade and online. Those totals are then corroborated using selective bottom-up approximations, such as sampled brand revenue mapping, channel checks with retailers and distributors, and volume-by-price sanity checks for key packaged formats.
Key inputs that shape the model include the share of vegan labeled SKUs within packaged food shelves, price premiums versus conventional equivalents, the mix shift between mass and premium offerings, online share within packaged grocery, and regional growth signals such as new product launches and distribution widening. When a bottom-up datapoint is missing, we interpolate using proxied pricing ladders and comparable category growth, then confirm the direction with interview feedback. For forecasting, scenario analysis is used with a base case supported by expert views on pricing normalization, promotional intensity, and how quickly new consumers repeat-buy, which tends to matter more than one-time trial spikes.
Data Validation & Update Cycle
Validation is handled through multi-step cross-checks so the final values do not rely on a single indicator. We compare outputs against independent signals like retail inflation trends, trade flow directionality for relevant packaged categories, and company-reported category momentum, then investigate large variances before sign-off.
A second analyst review is completed for assumptions that materially change the totals, and interview follow-ups are triggered when pricing, channel mix, or adoption rates look inconsistent by region. The report is refreshed annually, and interim updates are made when major labeling rules, demand shocks, or distribution shifts can alter the market trajectory. Before delivery, a final pass is done so clients receive the most current view that can be traced back to clear inputs.
Mordor Intelligence's Packaged Vegan Foods Market Sizing Compared With Other Published Estimates
Published market sizes for packaged vegan foods can vary a lot, even when the topic sounds identical, because the scope lines and counting points are not always the same. Differences usually show up in what sales channels are counted, how broad the product set is, and which year and currency timing are used for conversions.
Foodservice-only vegan meals sit outside Mordor Intelligence's scope, and that single exclusion can compress the headline number when another estimate blends restaurant and cafe sales into the same total. The spread can also come from whether adjacent categories like vegan supplements are added, how price premiums are projected over time, and whether the model is refreshed to reflect recent promotional intensity and private label expansion.
Benchmark comparison
| Source | Market Size | Gaps in Research Methodology |
|---|---|---|
| Mordor Intelligence | USD 27.61 B (2026) | |
| Trade Publisher A | USD 6.11 B (2025) | Uses a narrower packaged vegan foods definition and a different base year, which can undercount packaged meal and dairy-alternative value in higher-penetration regions. |
| Global Consultancy B | USD 24.50 B (2026) | Tracks a broader vegan food lens that can mix packaged and non-packaged consumption, and the category mapping to retail-only sales is not always separated clearly. |
The table shows that most gaps are explained by what is included, where the sale is counted, and how pricing is carried forward between years. By keeping the scope tied to packaged, retail-tracked demand and then checking assumptions with channel and pricing feedback, we keep the estimate explainable and repeatable for planning.
Key Questions Answered in the Report
How big is the packaged vegan food market in 2026?
The Packaged vegan food market size stands at USD 27.61 billion in 2026 and is set to reach USD 43.9 billion by 2031.
Which product segment is growing fastest within packaged vegan foods?
Meat alternatives and packaged vegan meals lead growth with a projected 10.33% CAGR through 2031.
What is driving the rapid expansion of vegan foods in Asia-Pacific?
High lactose intolerance rates, rising disposable incomes, and new labeling rules in China and India underpin the region’s 9.76% CAGR.
Why are organic vegan SKUs gaining share?
USDA and EU organic certifications assure consumers about non-GMO inputs and pesticide-free farming, justifying 20-30% price premiums and an 11.08% CAGR.