
Oxygen Therapy Equipment Market Size and Share
Market Overview
| Study Period | 2020 - 2031 |
|---|---|
| Market Size (2026) | USD 4.11 Billion |
| Market Size (2031) | USD 5.7 Billion |
| Growth Rate (2026 - 2031) | 6.77 % |
| Fastest Growing Market | Asia Pacific |
| Largest Market | North America |
| Market Concentration | Medium |
Major Players *Disclaimer: Major Players sorted in no particular order Image © Mordor Intelligence. Reuse requires attribution under CC BY 4.0. | |
Oxygen Therapy Equipment Market Analysis by Mordor Intelligence
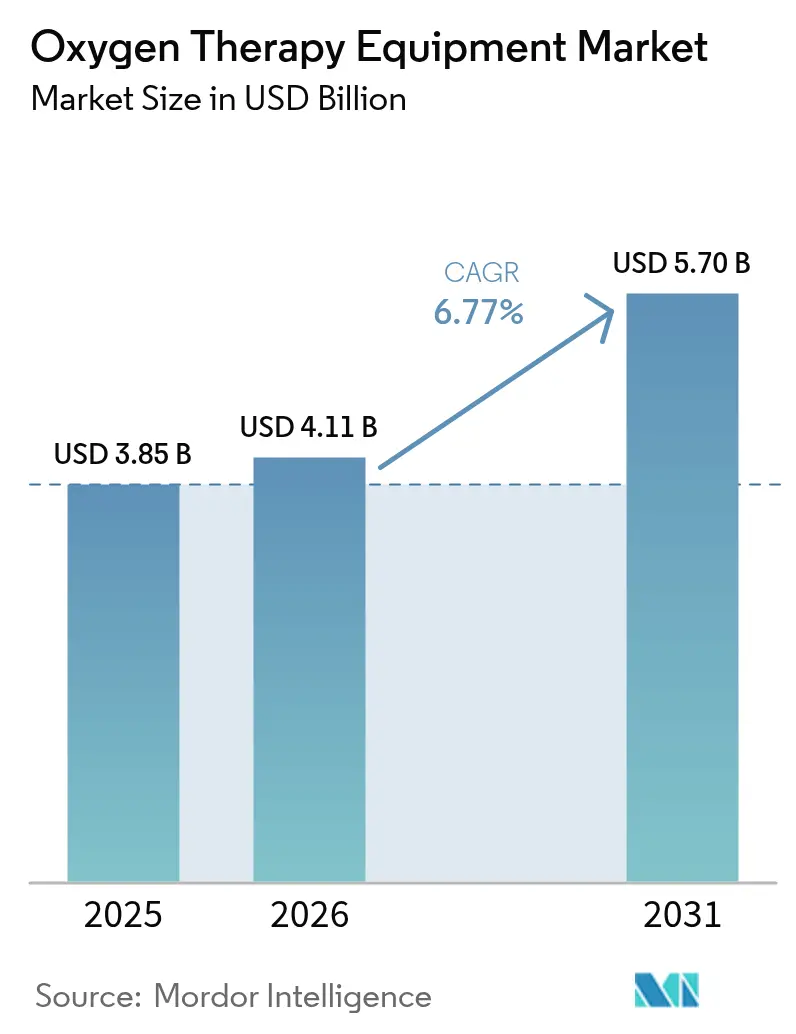
The oxygen therapy equipment market size is expected to grow from USD 3.85 billion in 2025 to USD 4.11 billion in 2026 and is forecast to reach USD 5.7 billion by 2031 at 6.77% CAGR over 2026-2031. Growth is propelled by the rising global burden of chronic respiratory diseases, rapid device miniaturization, sustained investment in home healthcare, and supportive reimbursement frameworks. Intensifying product recalls and exits by prominent manufacturers are widening supply gaps that agile competitors are filling, while IoT-enabled monitoring is redefining care pathways across acute and chronic settings. At the same time, evolving regulatory regimes and component-level supply chain vulnerabilities are shaping competitive strategies and capital allocation priorities. Heightened clinical demand for portable concentrators, telehealth integration, and advanced battery chemistries underscores the market’s pivot toward patient-centric, data-driven respiratory care solutions.
Key Report Takeaways
- By product category, Oxygen Source Equipment led with 64.78% of the oxygen therapy equipment market share in 2025; Oxygen Delivery Devices are projected to expand at a 7.02% CAGR to 2031.
- By portability, Stationary Devices held 53.10% of the oxygen therapy equipment market size in 2025, while Portable Devices record the fastest forecast CAGR at 8.42% through 2031.
- By application, COPD accounted for 37.95% of the oxygen therapy equipment market size in 2025; Obstructive Sleep Apnea is growing at an 7.81% CAGR through 2031.
- By end user, Home Healthcare is advancing at an 8.02% CAGR, outpacing Hospitals that commanded 40.92% of 2025 revenue.
- North America captured 43.05% revenue share in 2025; Asia-Pacific is the fastest-growing region at 8.66% CAGR through 2031.
Note: Market size and forecast figures in this report are generated using Mordor Intelligence’s proprietary estimation framework, updated with the latest available data and insights as of 2026.
Market Trends and Insights
Drivers Impact Analysis of Oxygen Therapy Equipment Market*
| Driver | (~) % Impact on CAGR Forecast | Geographic Relevance | Impact Timeline |
|---|---|---|---|
| Rising COPD & other respiratory disease prevalence | +1.8% | Global, with highest impact in APAC and MEA | Long term (≥ 4 years) |
| Shift toward home-based oxygen therapy & portable devices | +1.5% | North America & EU core, expanding to APAC | Medium term (2-4 years) |
| Rapid device miniaturisation & IoT-enabled monitoring | +1.2% | Global, led by North America and Europe | Medium term (2-4 years) |
| Stricter hospital accreditation standards that mandate 24/7 pulse-oximetry and reliable oxygen supply | +1.0% | North America & EU primarily, expanding to APAC | Medium term (2-4 years) |
| Next-gen lithium-sulfur batteries enabling ultra-light POCs | +0.8% | Global, with early adoption in developed markets | Long term (≥ 4 years) |
| Telehealth-integrated remote oxygen management demand | +0.7% | North America & EU, expanding globally | Short term (≤ 2 years) |
| Source: Mordor Intelligence | |||
Rising COPD & Other Respiratory Disease Prevalence
The escalating incidence of COPD, asthma, and interstitial lung diseases is a critical demand driver for the oxygen therapy equipment market. Nearly 90% of COPD-related deaths occur in low- and middle-income countries, underscoring unmet therapeutic needs [1]. Environmental pollution accounts for 41.79% of COPD risk factors among younger cohorts, while smoking contributes 19.81%, indicating structural demand independent of tobacco trends. As global populations age, prevalence rises in tandem, particularly across Asia-Pacific economies experiencing rapid demographic shifts.
Shift Toward Home-Based Oxygen Therapy & Portable Devices
Cost-containment imperatives and patient preference for independence are accelerating the transition from facility-based to home-based therapy. US home healthcare expenditures for 3 million Medicare beneficiaries totaled USD 125.2 billion in 2024. The Home Health Value-Based Purchasing Model now links payments to quality outcomes, stimulating adoption of connected portable concentrators that support real-time monitoring. Inogen’s Rove 4—which delivers 840 ml/min oxygen at under 1.36 kg—exemplifies how design advances eliminate mobility barriers.
Rapid Device Miniaturization & IoT-Enabled Monitoring
Technology convergence is reshaping respiratory care into an intelligent, data-rich ecosystem. Platforms such as Pneulytics integrate clinical data with real-time parameters to enable personalized COPD management. IoT frameworks employing edge computing, like Monit4Healthy, minimize latency and protect data security while transmitting oxygen saturation metrics. Advances in nanosized zeolite sieves have pushed portable concentrator oxygen purity to 90% through optimized pressure-swing adsorption cycles.
Next-Gen Lithium-Sulfur Batteries Enabling Ultra-Light POCs
Lithium-sulfur pouch cells delivering gravimetric energy densities above 750 Wh kg–1 are dismantling historical weight constraints that limited portable oxygen concentrator adoption. Sulfurized polyacrylonitrile cathodes slash mass while improving safety over conventional lithium-ion chemistries. As electric-vehicle scale economies drive down cost curves, medical device suppliers are integrating these batteries to extend run-time without compromising form factor.
Restraints Impact Analysis of Oxygen Therapy Equipment Market*
| Restraint | (~) % Impact on CAGR Forecast | Geographic Relevance | Impact Timeline |
|---|---|---|---|
| Stringent global regulatory approvals & compliance costs | -1.1% | Global, most severe in EU and North America | Medium term (2-4 years) |
| High capital/reimbursement burden for long-term therapy | -0.9% | Global, acute in emerging markets | Long term (≥ 4 years) |
| Supply-chain fragility of zeolite molecular-sieves | -0.7% | Global manufacturing hubs | Short term (≤ 2 years) |
| Rising fire-safety & insurance restrictions in home use | -0.5% | North America and EU primarily | Medium term (2-4 years) |
| Source: Mordor Intelligence | |||
Stringent Global Regulatory Approvals & Compliance Costs
The European Union Medical Device Regulation (EU 2017/745) mandates broader clinical evidence, post-market surveillance, and Unique Device Identification by 2027-2028, materially escalating compliance spending [2]. Smaller manufacturers face disproportionate burdens, potentially hastening consolidation. In the United States, the FDA’s updated medical gas regulations effective December 2025 revise CGMP standards and safety reporting obligations, adding documentation layers for oxygen suppliers [3].
High Capital/Reimbursement Burden for Long-Term Therapy
Medicare’s 36-month capped rental policy obliges suppliers to provide equipment beyond the payment window, squeezing margins. A 2024 industry survey found 93.5% of home medical equipment suppliers implemented operational cuts after blended payment expirations; 65.4% reduced product lines and 53.3% trimmed staff. Low-income countries lacking systematic reimbursement must rely on donor programs, with the Lancet Global Health Commission estimating USD 6.8 billion annual outlays to close oxygen access gaps.
*Our forecasts treat driver/restraint impacts as directional, not additive. The impact forecasts reflect baseline growth, mix effects, and variable interactions.
Oxygen Therapy Equipment Market Segment Analysis
By Product:
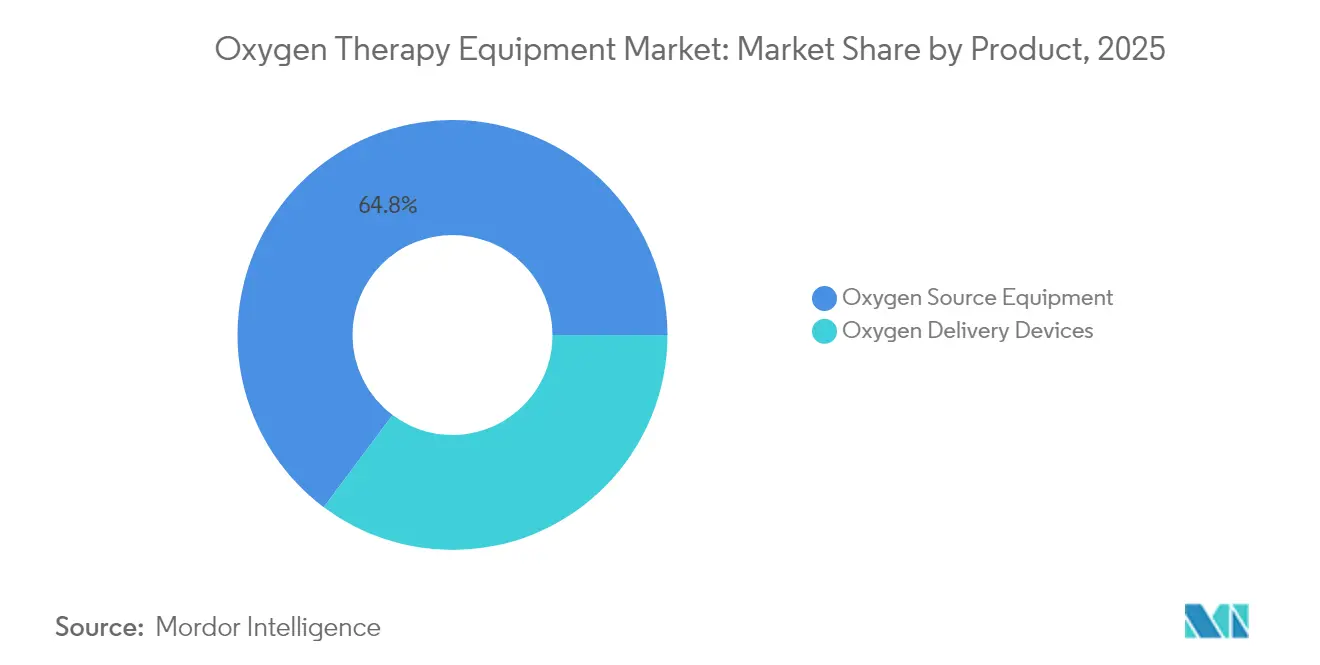
Source Equipment Dominance Faces Delivery InnovationOxygen Source Equipment held 64.78% of the oxygen therapy equipment market share in 2025. Concentrators drive this segment through pressure-swing adsorption efficiency gains, while liquid systems cater to high-purity therapeutic niches. Compressed cylinders remain vital for emergency back-up, particularly in EMS fleets. The oxygen therapy equipment market size for delivery devices is refining at a 7.02% CAGR, fueled by patient comfort innovations such as Fisher & Paykel’s F&P Nova Nasal mask with integrated humidity control. Smart cannulas fitted with saturation sensors relay adherence data, improving regulatory compliance with emerging quality-of-life metrics.Supporting this shift, concentric supply disruptions—most notably Philips Respironics’ 2024 discontinuation of 19 respiratory SKUs—have encouraged hospitals and distributors to dual-source delivery interfaces.
Rapid regulatory approvals for alternative interfaces accelerated portfolio diversification. Digital fit-testing, 3-D-printed adapter options, and antimicrobial tubing coatings have entered mainstream procurement discussions across US hospital groups.

By Portability:
Stationary Growth Defies Mobility TrendsStationary concentrators still captured 53.10% of the oxygen therapy equipment market size in 2025 even as consumer discourse focuses on portability. Reliability and continuous high-flow capabilities suit severe hypoxemic COPD patients, and payers often reimburse these devices preferentially under capped rental models. Recent releases like Caire’s IntenOxy 5 deliver 95.5% purity at 5 LPM while drawing under 330 W, reducing electricity costs for seniors on fixed incomes. Manufacturers also add smart-grid interfaces to balance residential power loads and claim sustainability credits.
Portable devices account for the remaining share but post the market’s fastest absolute revenue gains. The oxygen therapy equipment market demonstrates 8.42% CAGR for ultra-portable devices as battery energy densities climb, extending run-time beyond 6 hours at pulse setting 3. Companies are bundling service subscription models that cover consumables, firmware upgrades, and telemonitoring analytics. Integrators experiment with modular ecosystems pairing a bedside station with a backpack-size concentrator using interchangeable sieve cartridges, ensuring continuity during travel or outages.
By Application:
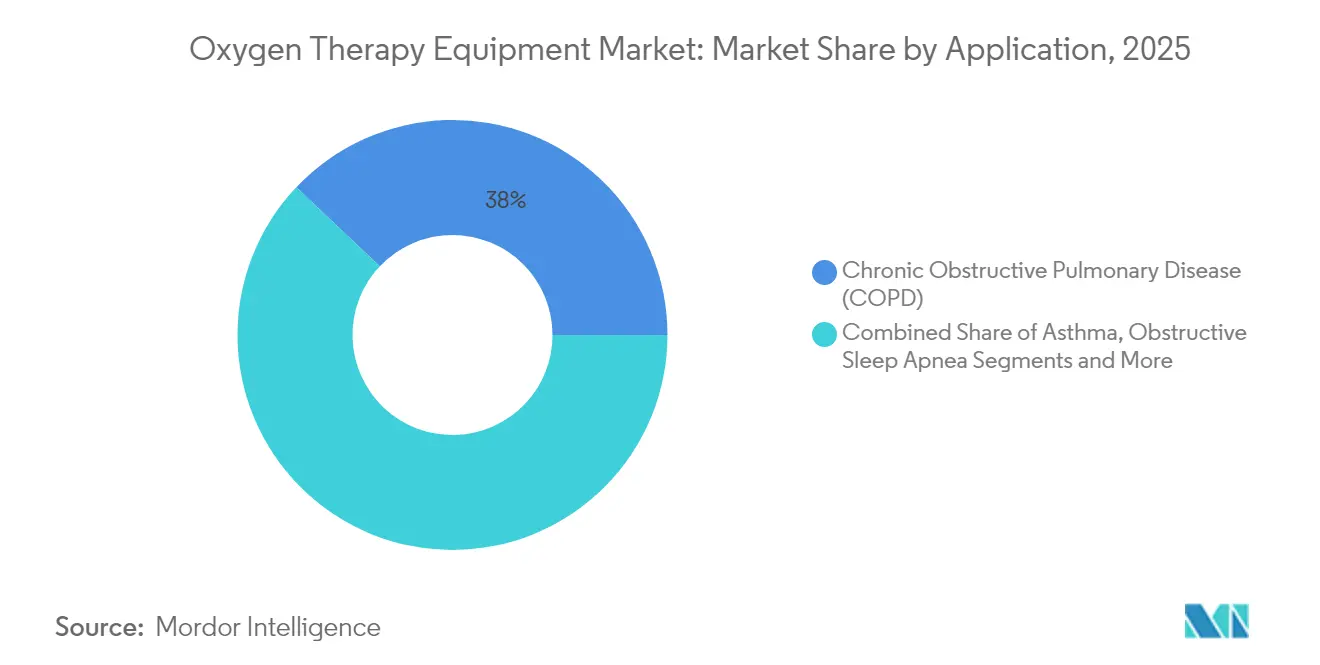
Sleep Apnea Emerges as High-Growth OpportunityCOPD occupied 37.95% of 2025 revenue and remains the cornerstone application for the oxygen therapy equipment market. Clinical guidelines endorse long-term oxygen therapy in severe hypoxemia, anchoring predictable demand. Yet, Obstructive Sleep Apnea (OSA) now shows the fastest expansion at 7.81% CAGR. While CPAP remains first-line, oxygen supplementation is gaining traction among CPAP-intolerant and residual hypoxemia cohorts. Asthma, Respiratory Distress Syndrome, pneumonia recovery, and heart failure collectively form a diversified tail, each requiring tailored flow-rate algorithms. IoT-enabled devices that auto-adjust FiO₂ in response to nocturnal desaturation or exertional hypoxia extend therapy versatility.
Clinical trials exploring closed-loop oxygen titration for heart failure patients indicate hospital-readmission reductions, bolstering insurer interest in multiparameter telemonitoring bundles.
By End User:
Home Healthcare Acceleration Reshapes Care DeliveryHospitals represented 40.92% of 2025 sales yet face volume migration as payers incentivize lower-cost care sites. The oxygen therapy equipment market size in home healthcare channels is rising fastest at 8.02% CAGR, reflecting demographic pressures and post-pandemic telehealth normalization. Providers bundle concentrators with RPM dashboards, creating subscription revenue streams that offset device commoditization.
Ambulatory surgical centers are equipping recovery bays with lightweight cylinders and compact concentrators to meet same-day discharge criteria. Long-term care and skilled nursing facilities adopt pooled-fleet models that rotate assets between residents, optimizing utilization. Emergency medical services are piloting hybrid lithium-sulfur battery packs to extend cylinder life during regional disaster responses.
Geography Analysis
North America, EMEA, APAC and LATAM Oxygen Therapy Equipment Market
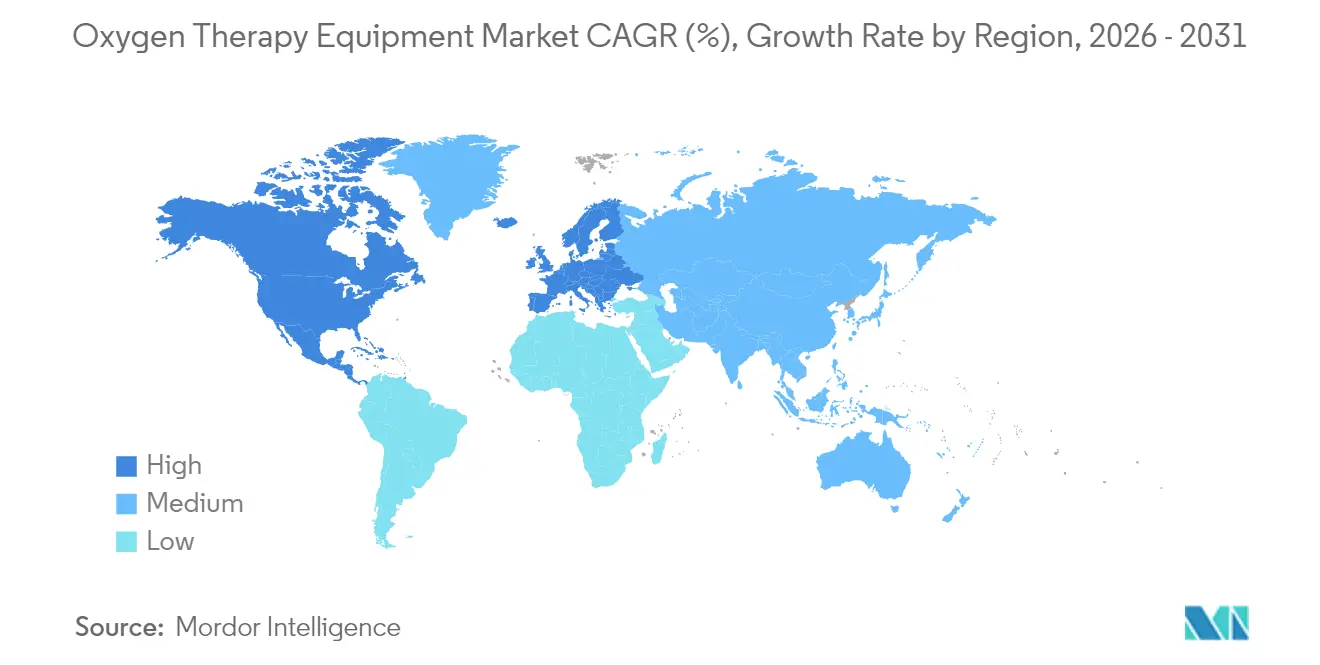
North America generated 43.05% of 2025 revenue, supported by robust reimbursement systems, high COPD prevalence, and mature distribution networks. The FDA’s December 2025 medical gas mandate intensifies audit preparation among US manufacturers, while Canada’s federal-provincial drug plans continue to integrate portable concentrator benefits. Mexico’s Seguro Popular expansion drives localized assembly partnerships to reduce import duties.Asia-Pacific is the fastest-growing territory, posting 8.66% CAGR thanks to healthcare spending growth, universal insurance rollouts, and aging demographics. China’s medical device market is projected to reach USD 138 billion by 2027. Though COPD prevalence is stabilizing, absolute patient volumes remain huge. India witnesses double-digit demand growth as public-private partnerships upgrade district hospitals with oxygen plants. Japanese and South Korean suppliers leverage domestic R&D to export connected concentrators across ASEAN markets, while Australian telehealth frameworks accelerate cross-border RPM adoption.Europe maintains steady growth underpinned by MDR-compliant product refresh cycles and aging populations. Germany’s sickness funds reimburse portable concentrators when paired with adherence-monitoring apps, boosting smart device uptake. The United Kingdom’s NHS Community Oxygen Service deploys remote titration pilots aimed at reducing clinic visits. Southern European economies align procurement criteria with EU medical gas standards, expanding opportunities for value-focused vendors. The Middle East & Africa region records double-digit growth from a low base as governments establish pressure swing adsorption plants following COVID-19 shortages. MedAccess and development banks finance manufacturing hubs to localize sieve production, enhancing regional self-sufficiency. Latin America’s trajectory is mixed: Brazil’s Unified Health System rolls out oxygen concentrators to secondary hospitals, yet currency volatility challenges importer margins in Argentina and Colombia.
Regulatory Landscape
Oxygen therapy equipment is regulated primarily as medical devices, with additional rules applying where medical oxygen is treated as a drug or where products fall under drug-device combination oversight. In the European Union, Regulation (EU) 2017/745 (MDR) is the core framework shaping technical documentation, clinical evidence, and post-market surveillance expectations for oxygen concentrators and delivery interfaces. It continues to be updated through consolidated texts and proposed amendments, including European Commission proposals to amend MDR annexes announced in December 2025.
In the United States, FDA oversight covers device requirements, including 510(k) pathways for many oxygen therapy devices, and controls for medical gases. The FDA Office of Combination Products governs cross-cutting jurisdiction and quality requirements for combination products through 21 CFR Part 3 (classification) and 21 CFR Part 4 (CGMP alignment). Trade policy is also becoming a variable for manufacturers and providers, with the Office of the USTR opening proposed tariff actions for public comment in June 2026, and the American Hospital Association submitting comments in July 2026 opposing broad device tariffs due to access and care-delivery impacts.
Value Chain Analysis
The value chain begins with specialized component suppliers and materials providers, including zeolite molecular sieve media for pressure-swing adsorption beds, compressors, valves and regulators, sensors, and advanced battery chemistries for portable systems. These inputs flow to OEMs that design and assemble oxygen source equipment (stationary and portable concentrators, cylinders, and liquid oxygen systems where applicable) and oxygen delivery devices (masks, cannulas, and related interfaces). Regulatory and quality requirements affect design transfer, supplier qualification, and post-market support, especially where medical oxygen is handled as a drug in some jurisdictions and as a device-adjacent therapy input in others.
Downstream, distribution typically moves through national medical distributors, home healthcare and HME providers, hospital purchasing groups, and service networks that manage installation, maintenance, and consumables. Bottlenecks cluster around constrained components, notably zeolite sieve supply, and around compliance-driven documentation, while the disposable and accessory ecosystem ties high-flow and humidification-based therapies to recurring demand. Recent examples show how regulatory clearance and channel access shape these flows, including Vapotherm receiving FDA 510(k) clearance in April 2026 for a single-circuit approach spanning neonatal to adult use. New portable offerings such as Dynarex's Resp-O2 in June 2026 also illustrate how product launches route through established homecare distribution footprints.
Competitive Landscape
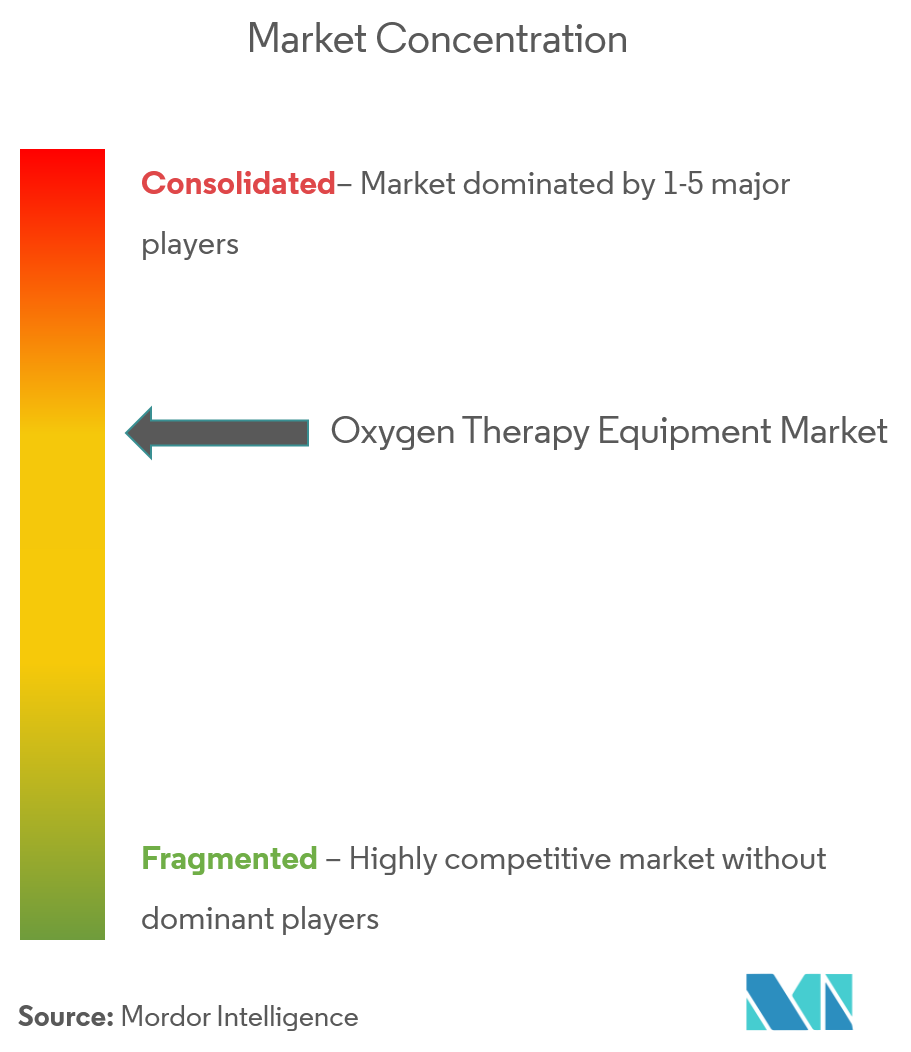
The oxygen therapy equipment market landscape is moderately fragmented, though exits such as Philips Respironics’ 2024 retreat have altered share dynamics. Inogen’s acquisition of Physio-Assist for USD 32 million signaled vertical diversification beyond oxygen into airway clearance, aligning with its strategy to own overlapping respiratory pathways.
Technology differentiation underpins competitive advantage. Leading firms deploy AI algorithms that predict exacerbations and auto-adjust flow rates, while mid-tier entrants emphasize low-cost, robust designs for emerging markets. Component scarcity—particularly zeolite molecular sieves—prompted several suppliers to secure long-term offtake agreements with chemical producers to avoid pandemic-like disruptions.
Consolidation attempts face regulatory hurdles: Owens & Minor’s proposed USD 1.36 billion acquisition of Rotech Healthcare collapsed due to FTC concerns over supplier concentration. Consequently, strategists favor bolt-on acquisitions under USD 100 million or joint ventures that sidestep antitrust thresholds. Intellectual-property portfolios around battery chemistries and digital platforms are now key valuation determinants during deal due diligence.
Oxygen Therapy Equipment Industry Leaders
-
DeVilbiss Healthcare
-
Hersill
-
Invacare Corporation
-
Koninklijke Philips N.V.,
-
TECNO-GAZ SpA
- *Disclaimer: Major Players sorted in no particular order
Oxygen Therapy Equipment Market Companies Covered in this Report
- Koninklijke Philips
- Caire
- Invacare
- Drive DeVilbiss Healthcare
- Resmed
- Fisher & Paykel Healthcare
- Teleflex
- Smiths Group
- Linde Healthcare
- Dragerwerk
- Chart Industries (AirSep)
- Inogen Inc.
- Nidek Medical Products
- Air Liquide
- Allied Healthcare Products
- GCE Group
- Hersill S.L.
- TECNO-GAZ
- OxyGo LLC
- BPL
- Precision Medical
- Besco Medical
Market Opportunities and Future Outlook
Home healthcare and long-term care workflows are creating whitespace for oxygen systems that reduce provider operating burden while improving adherence and enabling remote management. The market is absorbing more connected and adaptive designs, including intelligent home concentrators with SpO2-driven flow adjustment, such as Oxymed's Inteli 5 LPM launch in India in April 2026. Device portfolio gaps created by product discontinuations and recalls, including Philips Respironics discontinuing multiple respiratory SKUs in 2024, are also shifting purchasing toward dual-sourcing and accelerating evaluations of alternative OEMs for both concentrators and delivery interfaces.
Innovation is further expanding use-cases and geographies by lowering infrastructure requirements for respiratory support hardware and improving delivery interfaces. Peer-reviewed 2026 publications describe new oxygen delivery concepts, including bench-simulated pediatric masks with higher delivered oxygen concentrations and electricity-free, 3D-printed CPAP concepts intended for resource-limited settings. This reinforces opportunities for manufacturers and partners to industrialize low-cost designs while meeting MDR and FDA evidence expectations. Policy and reimbursement remain a key lever for fleet planning in the United States, where the Supplemental Oxygen Access Reform (SOAR) Act of 2025 proposes changes to how supplemental oxygen is handled in competitive bidding and payment updates beginning January 1, 2026, which directly affects how suppliers structure service models and device mix decisions.
Recent Industry Developments in Oxygen Therapy Equipment Market
- April 2026: Drive Medical (DeVilbiss by Drive) launched the 555 Compact Oxygen Concentrator, a 5L stationary platform positioned with a smaller footprint than the prior 525DS model and lower energy consumption. The update targets provider logistics and total cost of ownership, supporting facility and homecare deployments that are sensitive to storage density and operating expense.
- June 2025: Philips announced Europe-wide availability of the Oxygenate 5 stationary oxygen concentrator, emphasizing multi-stage filtration and patient-serviceable filters. Broader regional availability expands competitive choice for stationary therapy fleets while reinforcing maintenance-light designs for home settings.
- October 2024: Drive DeVilbiss Healthcare introduced the PulmO2 oxygen concentrator through a partnership with Sanrai International aimed at improving access in low- and middle-income countries. The update strengthens channel reach in markets where infrastructure constraints and procurement programs favor robust, scalable oxygen source equipment.
Oxygen Therapy Equipment Market Report Scope and Research Methodology
Market Definition and Coverage
This market covers equipment used to provide supplemental oxygen to patients in clinical and home settings, including oxygen source devices and delivery interfaces that help deliver oxygen at prescribed flow and concentration.
Scope exclusions: We exclude bulk medical oxygen gas sales, full mechanical ventilators, and hyperbaric oxygen chambers from this sizing.
Segments Covered in This Report
- By Product
- Oxygen Source Equipment
- Oxygen Cylinders
- Oxygen Concentrators
- Liquid Oxygen Devices
- Others
- Oxygen Delivery Devices
- Oxygen Masks
- Nasal Cannula
- Venturi Masks
- Non-Rebreather Masks
- Others
- Oxygen Source Equipment
- By Portability
- Stationary Devices
- Portable Devices
- By Application
- Asthma
- Obstructive Sleep Apnea
- Chronic Obstructive Pulmonary Disease (COPD)
- Respiratory Distress Syndrome
- Others
- By End User
- Hospitals
- Home Healthcare
- Ambulatory Surgical Centers
- Others
- By Geography
- North America
- United States
- Canada
- Mexico
- Europe
- Germany
- United Kingdom
- France
- Italy
- Spain
- Rest of Europe
- Asia-Pacific
- China
- Japan
- India
- Australia
- South Korea
- Rest of Asia-Pacific
- Middle East & Africa
- GCC
- South Africa
- Rest of Middle East & Africa
- South America
- Brazil
- Argentina
- Rest of South America
- North America
Data Sources, Market Sizing, and Validation
Desk Research
Desk work starts with publicly available demand and policy signals that indicate where oxygen therapy is being used and how quickly need is shifting across geographies. We reference CDC surveillance, NIH and PubMed publications, WHO respiratory health materials, and OECD health statistics, then map these signals to device-related regulatory and safety information from the US FDA and the European Commission medical device framework.
To keep the model grounded in market detail, we also review manufacturer annual reports, investor presentations, and press releases for product mix changes, capacity adjustments, and channel updates. In parallel, a paid subscription covering company financials and news helps track M&A activity, recalls, and major contract wins that can shift yearly revenues. The desk source list above is illustrative, and we checked additional public sources for data collection, validation, and research clarification.
Primary Interviews and Surveys
Primary work is used to pressure test assumptions that are difficult to confirm from public sources, particularly around adoption in homecare versus hospitals, pricing movements, and replacement cycles for concentrators and related delivery items. We speak with a mix of manufacturers, distributors, hospital procurement contacts, homecare providers, and clinicians across APAC, EMEA, and the Americas, then reconcile the feedback to the same year definitions used in the model.
Distribution of primary research fieldwork respondents
| Company type | Respondent position | Region |
|---|---|---|
| Top tier: 25% | CXOs: 13% | APAC: 41% |
| Mid tier: 61% | Functional/Unit leaders: 39% | EMEA: 33% |
| Smaller Players: 14% | Managers: 48% | Americas: 26% |
Market-Sizing & Forecasting
For sizing, a top-down approach is used where disease burden and treated population signals are converted into an addressable demand pool for oxygen therapy, and then translated into equipment spending using usage setting and device mix assumptions. The totals are then checked using selective bottom-up approximations, such as sampled revenue roll ups from key suppliers, channel checks with distributors, and simple volume times average selling price calculations for high-penetration products.
Inputs that materially influence the model include COPD and other chronic respiratory prevalence trends, the split of therapy delivered in homecare versus hospitals, device utilization and replacement cycles for concentrators and cylinders, average selling price movement by portability class, and regional reimbursement or tender intensity where it shapes uptake. Because the forecast needs to stay explainable, scenario analysis is used around adoption speed of portable solutions, pricing normalization, and supply constraints, and the scenario weights are refined based on expert feedback. Where a country level data series is missing, we bridge it with regional peer ratios and then re-check the output with interview-based adoption benchmarks before locking the final value.
Data Validation & Update Cycle
Validation is done through multiple passes where outputs are compared against independent signals, like respiratory patient counts, hospital infrastructure changes, and reported device shipment commentary where available. If a region shows an unusual jump, we re-check currency timing, price assumptions, and mix shifts, and then re-contact a small set of respondents to confirm whether a real market event happened.
Before sign-off, the model and assumptions are reviewed by another analyst to catch variance drivers that were missed in the first build. The report is refreshed annually, and interim updates are triggered when material events occur, such as large recalls, policy shifts, or sharp pricing changes. Right before delivery, we perform a fresh review pass so the numbers reflect the latest available evidence.
Mordor Intelligence's Oxygen Therapy Equipment Market Size Compared With Other Published Estimates
Published market sizes for oxygen therapy equipment do not always match because groups draw the boundary in different places, and they also make different choices on years, currency timing, and what gets counted as equipment versus related supply.
By tracking replacement cycles, homecare penetration, and average selling price movement, Mordor Intelligence ties the 2026 total to a defined equipment basket (source devices plus delivery interfaces) and then re-checks the result with regional adoption feedback, which reduces the chance of over-counting adjacent categories.
Benchmark comparison
| Source | Market Size | Gaps in Research Methodology |
|---|---|---|
| Mordor Intelligence | USD 4.11 B (2026) | |
| Global Consultancy A | USD 4.20 B (2025) | Uses a different base year and a longer horizon, and the public summary does not clarify whether disposables and service revenue are blended into the equipment total, which can inflate year-to-year comparability. |
| Industry Publisher B | USD 4.10 B (2025) | Scope notes indicate broader inclusion rules and mixed references across years, and the write-up suggests coverage may extend into adjacent surgical and institutional use definitions that do not map cleanly to standard homecare and hospital oxygen therapy equipment demand. |
Taken together, the spread is mainly explained by year selection, what is treated as core equipment, and whether pricing and mix are refreshed with current adoption signals. Our approach keeps each input linked to a practical driver like treated patient pool, setting mix, and replacement demand, so the final number can be followed and repeated as assumptions change.
Key Questions Answered in the Report
What is the current Oxygen Therapy Equipment Market size?
The Oxygen Therapy Equipment Market stands at USD 4.11 billion in 2026 and is projected to reach USD 5.7 billion by 2031.
Who are the key players in Oxygen Therapy Equipment Market?
DeVilbiss Healthcare, Hersill, Invacare Corporation, Koninklijke Philips N.V., and TECNO-GAZ SpA are the major companies operating in the Oxygen Therapy Equipment Market.
Which is the fastest growing region in Oxygen Therapy Equipment Market?
Asia-Pacific posts the highest growth, advancing at a 8.66% CAGR thanks to rising healthcare investments and an aging population
Which product category currently leads the market?
Oxygen Source Equipment, including concentrators and liquid systems, holds 64.78% of 2025 revenue, making it the dominant segment.