
Oxidative Stress Assay Market Size and Share
Market Overview
| Study Period | 2020 - 2031 |
|---|---|
| Market Size (2026) | USD 1.46 Billion |
| Market Size (2031) | USD 2.32 Billion |
| Growth Rate (2026 - 2031) | 9.68 % |
| Fastest Growing Market | Asia-Pacific |
| Largest Market | North America |
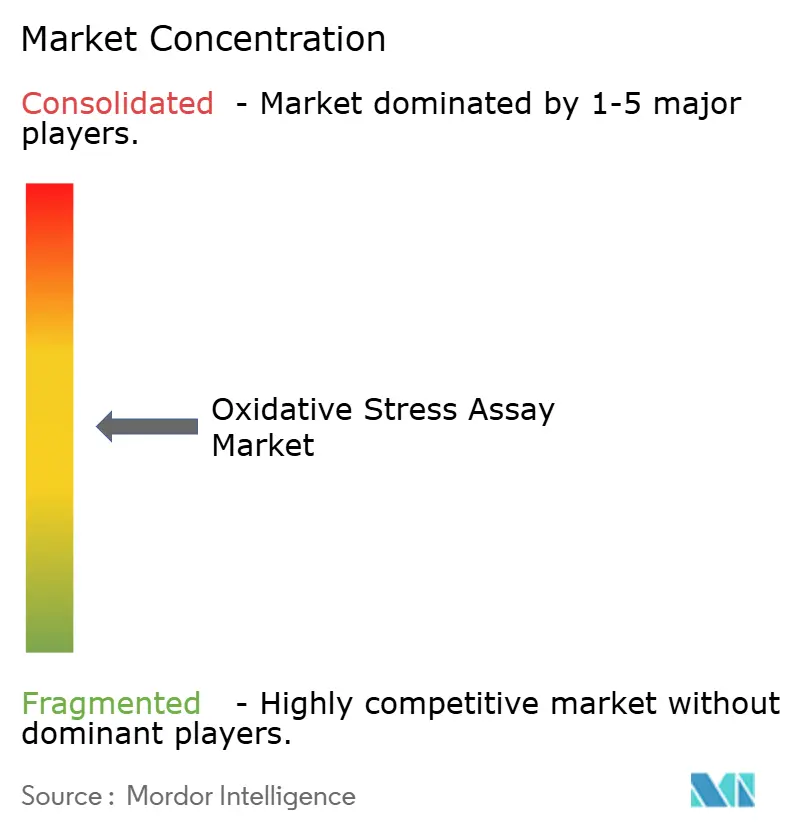
| Market Concentration | Medium |
Major Players *Disclaimer: Major Players sorted in no particular order Image © Mordor Intelligence. Reuse requires attribution under CC BY 4.0. | |
Oxidative Stress Assay Market Analysis by Mordor Intelligence
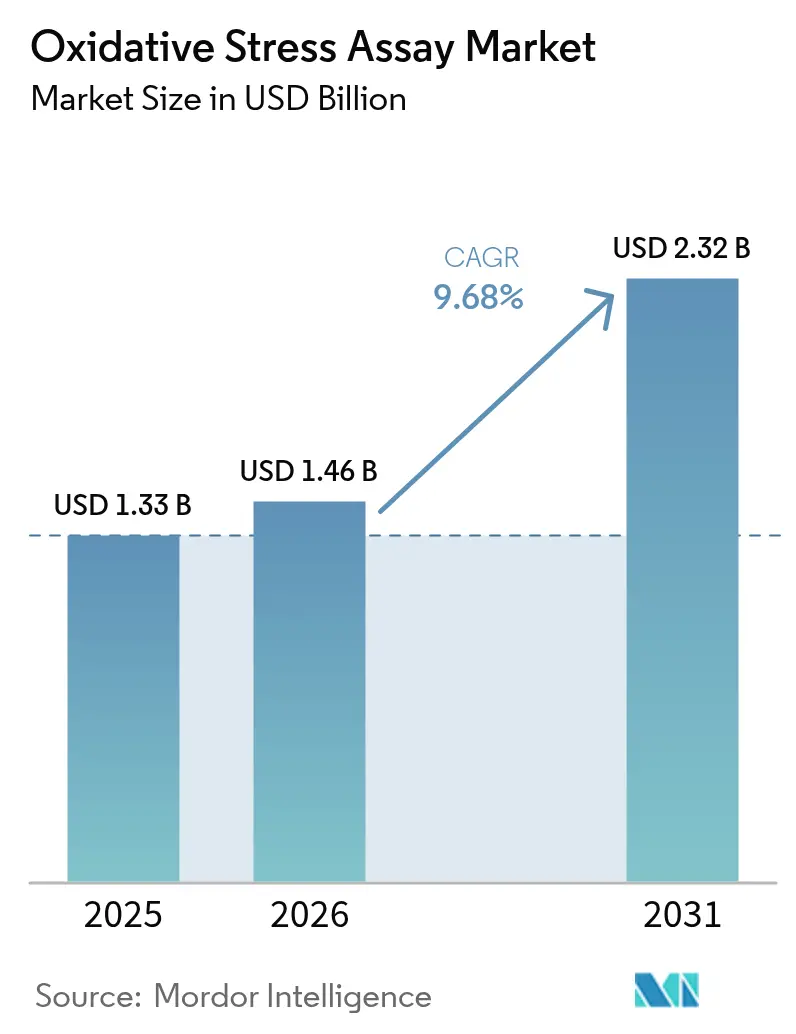
The oxidative stress assays market size was valued at USD 1.33 billion in 2025 and estimated to grow from USD 1.46 billion in 2026 to reach USD 2.32 billion by 2031, at a CAGR of 9.68% during the forecast period (2026-2031). Advancing biopharma scale-up, growing regulatory acceptance of in-vitro toxicology, and AI-enabled analytics are redefining how real-time reactive oxygen species measurement supports drug development. Instruments dominate current spending because high-throughput flow cytometry and mass spectrometry systems shorten screening cycles and improve data depth. Live-cell multiplex platforms that track mitochondrial dysfunction, lipid peroxidation, and antioxidant capacity in one workflow are replacing traditional single-endpoint kits, positioning the oxidative stress assays market for sustained technology-led growth.
Key Report Takeaways
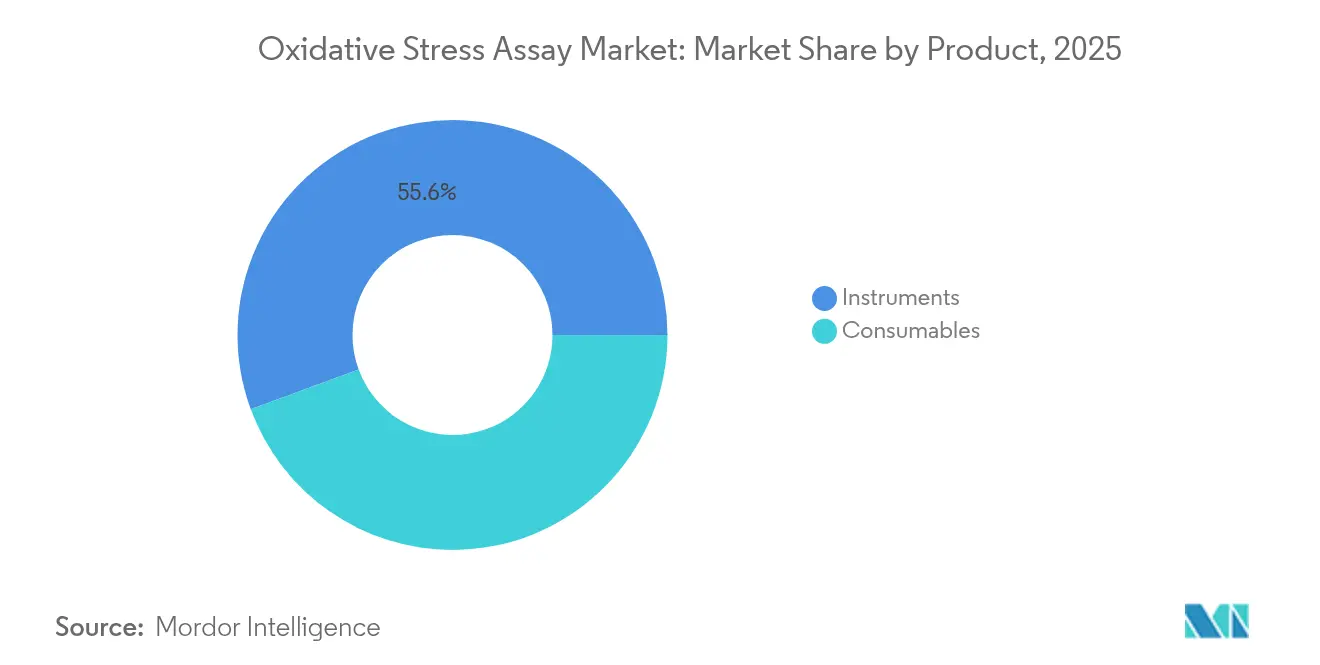
- By product type, instruments held 55.62% of oxidative stress assays market share in 2025; consumables will outpace with a 13.12% CAGR to 2031.
- By test type, ROS-based assays captured 29.10% of the oxidative stress assays market size in 2025 and will rise at 11.82% CAGR through 2031.
- By technology, flow cytometry led with 37.02% revenue share in 2025 while label-free impedance and real-time cell analysis record the highest projected CAGR at 11.66% to 2031.
- By disease type, cancer applications commanded 30.88% market share in 2025; neurodegenerative disorders will grow fastest at 10.79% CAGR through 2031.
- By end user, pharmaceutical and biotechnology companies accounted for 43.89% of 2025 revenue, whereas contract research organizations expand at 11.32% CAGR to 2031.
- By sample type, cell-based models represented 39.44% share and are advancing at 12.23% CAGR through 2031.
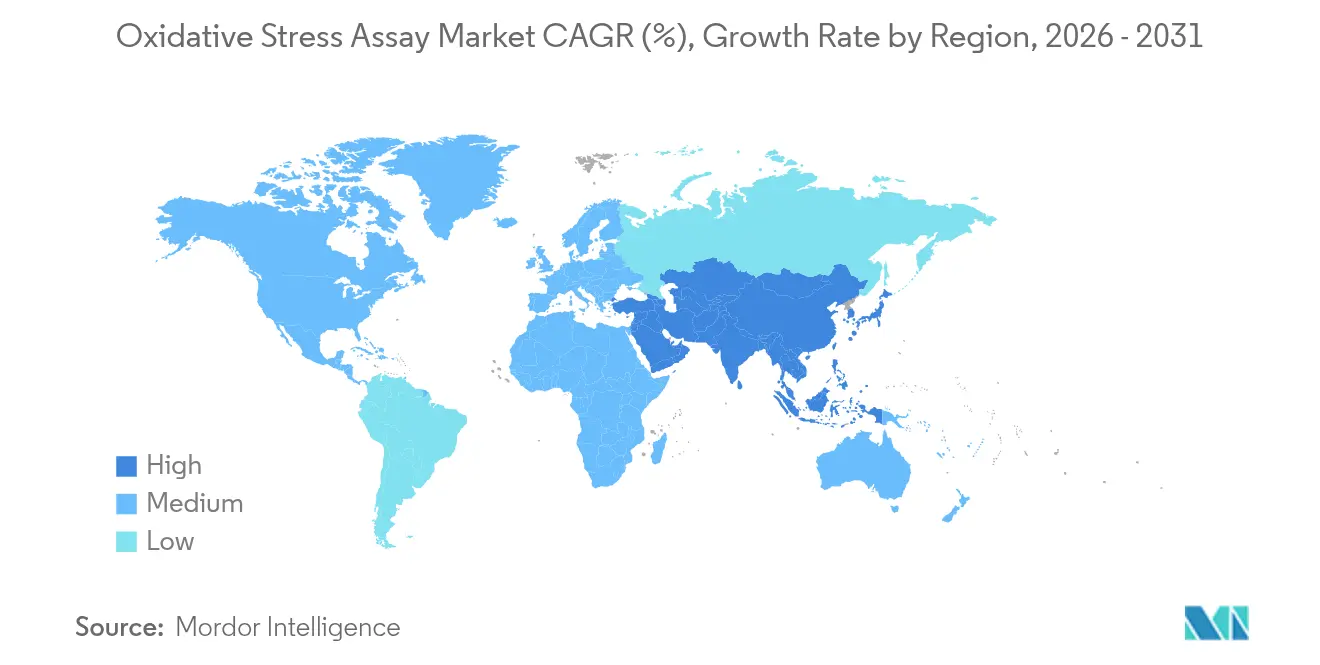
- By geography, North America retained 36.41% share in 2025 yet Asia Pacific posts the fastest 11.05% CAGR to 2031.
Note: Market size and forecast figures in this report are generated using Mordor Intelligence’s proprietary estimation framework, updated with the latest available data and insights as of 2026.
Market Trends and Insights
Drivers Impact Analysis of Oxidative Stress Assay Market*
| Driver | (~) % Impact on CAGR Forecast | Geographic Relevance | Impact Timeline |
|---|---|---|---|
| Rapid Growth In Biopharma & Biotech Manufacturing | +2.1% | Global, with concentration in North America & EU | Medium term (2-4 years) |
| Expansion Of High-Throughput Screening (HTS) For ROS Biomarkers | +1.8% | North America & APAC core, spill-over to EU | Short term (≤ 2 years) |
| Regulatory Push For In-Vitro Toxicology Alternatives | +1.5% | Global, led by North America & EU regulatory frameworks | Long term (≥ 4 years) |
| Mainstream Adoption Of Label-Free Live-Cell Imaging Assays | +1.3% | Global, with early adoption in North America | Medium term (2-4 years) |
| Novel Red-Fluorescent Probes For Real-Time Mitochondrial ROS | +1.0% | Global research institutions and biopharma | Short term (≤ 2 years) |
| Integration Of AI-Driven Assay Analytics | +0.9% | North America & EU, expanding to APAC | Medium term (2-4 years) |
| Source: Mordor Intelligence | |||
Rapid Growth in Biopharma and Biotech Manufacturing
Expanding biopharma capacity is amplifying demand for oxidative stress assays that serve as real-time quality indicators during process scale-up. Thermo Fisher Scientific invested USD 22 million in oral solid dose facilities and embedded predictive AI to monitor oxidative stress signatures that threaten protein stability. Continuous manufacturing workflows now depend on inline assays able to flag metabolic shifts before they affect yield. Bio-Rad’s purchase of Stilla Technologies brought digital PCR sensitivity to oxidative biomarker detection, confirming that next-generation production relies on integrated analytical ecosystems. This transition positions oxidative stress measurement as a standard parameter alongside purity and potency in commercial biologics runs.
Expansion of High-Throughput Screening for ROS Biomarkers
High-throughput screening (HTS) systems let scientists assess thousands of oxidative stress conditions in parallel, cutting discovery timelines for antioxidants and sensitizers. Abcam’s FirePlex multiplex platform couples validated antibody pairs with automation, removing the bottleneck of sequential testing and increasing quantitative sensitivity tenfold over earlier kits. Merging HTS with deep-learning algorithms further lowers false positive rates while CRISPR-based functional screening pinpoints genes that mediate redox balance. Cost-reducing miniaturization means libraries can expand without proportional reagent spend, accelerating early-stage drug pipelines.
Regulatory Push for In-Vitro Toxicology Alternatives
Regulators worldwide advocate in-vitro oxidative stress assays to replace animal studies, citing both ethics and superior mechanistic insight. The FDA’s revised laboratory-developed test rule standardizes clinical validation for oxidative biomarkers and its biomarker qualification program clarifies acceptance criteria. European agencies reinforce the 3Rs principle, prompting industry to adopt human-relevant oxidative endpoints for safety dossiers. Oncology programs gain particular value because a single assay can reveal both efficacy and cardiotoxicity profiles, streamlining submissions.
Mainstream Adoption of Label-Free Live-Cell Imaging Assays
Label-free imaging tracks oxidative dynamics without probe-induced artifacts. Fluorescence lifetime imaging of endogenous NADH distinguishes shifts in metabolic redox state at single-cell resolution, giving researchers temporal insight lost in endpoint staining.[1]Brandon G. Reid, “Label-Free FLIM of NADH Reveals Cellular Energy Metabolism in Live Cells,” Communications Biology, nature.comRaman-based microfluidic chips monitor ferroptosis in defined microscale environments, while flexible bioimpedance sensors deliver continuous viability data at lower cost than colorimetric kits.[2]Yong-Hua Luo, “Flexible Bioimpedance Sensors Deliver Rapid Viability Readouts,” Chemosensors, mdpi.com These advances unlock longitudinal studies of mitochondrial health during drug exposure.
Restraints Impact Analysis of Oxidative Stress Assay Market*
| Restraint | (~) % Impact on CAGR Forecast | Geographic Relevance | Impact Timeline |
|---|---|---|---|
| High Capital Cost Of Detection Instruments | -1.4% | Global, particularly affecting emerging markets | Long term (≥ 4 years) |
| Lack Of Trained Personnel In Multi-Modal Data Interpretation | -1.1% | Global, with acute shortages in APAC | Medium term (2-4 years) |
| Photobleaching & Probe-Derived Artifacts | -0.8% | Global research institutions | Short term (≤ 2 years) |
| Limited Standardization Of ROS Reference Materials | -0.6% | Global, affecting regulatory acceptance | Long term (≥ 4 years) |
| Source: Mordor Intelligence | |||
High Capital Cost of Detection Instruments
Top-tier orbitrap mass spectrometers exceed USD 1 million per unit, and many academic labs defer purchases because budgets trail the pace of innovation. Rapid obsolescence within seven years forces repeat investment, limiting diffusion into resource-constrained geographies. Leasing and pay-per-sample models are emerging but adoption remains low outside North America.
Lack of Trained Personnel in Multi-Modal Data Interpretation
Oxidative stress platforms produce complex outputs that span fluorescence, impedance, and genomic readouts. Analysts must understand biochemistry, statistics, and regulatory context, a combination still scarce in fast-growing Asia Pacific facilities.[3]Maria S. Domínguez, “Machine-Learning-Enabled Redox Signatures Enhance Cancer Therapy,” Antioxidants, mdpi.com While vendors run certification courses, the talent gap will persist until academic curricula align with new assay demands.
*Our forecasts treat driver/restraint impacts as directional, not additive. The impact forecasts reflect baseline growth, mix effects, and variable interactions.
Oxidative Stress Assay Market Segment Analysis
By Product – Instruments Propel Discovery While Consumables Accelerate Adoption
Instruments generated 55.62% of oxidative stress assays market revenue in 2025 and remain the backbone of advanced screening labs. Novel orbitrap analyzers that profile five times more compounds per run strengthen the segment’s appeal among pharmaceutical chemists who require deep metabolite coverage. Consumables, however, will register the fastest 13.12% CAGR to 2031 as kit-based workflows scale beyond top-tier centers. Ready-to-use red-fluorescent probes and standardized reference reagents simplify protocols for smaller labs, widening the oxidative stress assays market. Demand for consumables also benefits from recurring purchasing cycles that accompany ever-shorter assay turnaround expectations.
Second-generation probes with minimized autofluorescence broaden compatibility across flow cytometers and microscopes, boosting kit adoption. At the same time, instrument makers embed AI analytics directly on device firmware, condensing multi-step analysis into a single-click report. This convergence blurs the traditional boundary between hardware and consumables and sustains above-market growth for manufacturers able to provide end-to-end platforms that ensure data continuity.


By Test Type – ROS-Based Assays Retain a Leadership Position
ROS-based assays accounted for 29.10% of oxidative stress assays market share in 2025 and will grow at 11.82% CAGR as drug developers prioritize real-time insights into oxidative bursts that shape disease progression. Optogenetic H2O2 sensors achieve sub-cellular resolution and capture nanomolar fluxes, enabling researchers to correlate localized stress with pathway activation in cancer and neurodegeneration studies. Indirect assays that measure downstream products such as lipid peroxidation remain valuable when samples are fixed or when long-lived biomarkers are required for population studies.
Multiplex dashboards that combine ROS, antioxidant capacity, and protein oxidation endpoints on a single plate are now common, reducing experiment count and conserving precious primary cells. Such integrated testing shortens validation timelines and supports the oxidative stress assays market size expansion forecast to 2031.
By Technology – Flow Cytometry Maintains Versatility
Flow cytometry delivered 37.02% of 2025 revenue because single-cell resolution aligns with precision medicine goals. Next-generation protocols detect events below 0.001% frequency and allow researchers to isolate rare apoptotic populations. ELISA platforms still dominate regulated clinical workflows thanks to decades of accumulated validation, yet label-free impedance and real-time cell analysis achieve the fastest trajectory with continuous readouts that replace time-consuming endpoint staining.
Chromatography regains visibility as labs explore specific oxidative metabolites that cannot be captured by optical probes. Microscopy gains traction through fluorescence lifetime imaging modules that index metabolic reprogramming without dyes, further broadening the oxidative stress assays market.
By Disease Type – Oncology Drives Demand While Neurology Accelerates
Cancer applications delivered 30.88% of market revenue in 2025, fueled by the need to map tumor microenvironment redox states that influence therapy response. Machine-learning models now predict patient stratification based on redox signatures, positioning oxidative assays as a companion diagnostic input. Neurodegenerative disorders will outpace other segments with an 10.79% CAGR to 2031 as early-detection blood biomarkers progress toward clinical adoption.
Cardiovascular and COPD researchers continue to link oxidative biomarkers with endothelial dysfunction and pulmonary decline, validating assays as prognostic tools in chronic disease management. Cross-disciplinary uptake underpins healthy expansion across all disease-focused segments.
By End User – Pharma Dominates, CROs Expand Fastest
Pharmaceutical and biotechnology companies held 43.89% of 2025 spending because oxidative stress readouts are embedded in lead identification, safety assessment, and biomarker discovery. The segment benefits from FDA encouragement to include mechanistic biomarkers in regulatory packages. Contract research organizations deliver the highest 11.32% CAGR, as sponsors outsource multi-parameter analytics to specialists with validated workflows and regulatory expertise.
Academic and research institutes pioneer novel assay concepts that migrate to commercial settings, while service providers such as Creative Bioarray aggregate niche technologies into turnkey offerings that appeal to mid-size biotech firms.

By Sample Type – Cell-Based Models Gain Momentum
Cell-based assays captured 39.44% of revenue in 2025 and will expand at 12.23% CAGR to 2031 because 3D cultures and organoids reproduce human physiology more faithfully than traditional monolayers. Optimized lactate dehydrogenase protocols now quantify cytotoxicity in thick matrices, eliminating the need to section spheroids. Tissue homogenates remain essential for translational studies that confirm cellular findings within complex microenvironments.
Blood and plasma analysis grows as ultrasensitive kits detect low-abundance oxidative markers that mirror systemic stress. Non-invasive urine panels facilitate longitudinal monitoring, widening participation in large-cohort studies and advancing personalized medicine applications within the oxidative stress assays market.
Geography Analysis
North America Oxidative Stress Assay Market
North America maintained 36.41% revenue share in 2025 thanks to clear FDA biomarker qualification pathways and a dense biopharma infrastructure that rapidly pilots AI-driven assays from bench to clinic. Venture capital backing and equipment vendors headquartered in the United States foster rapid prototype adoption. Strategic collaborations, such as BioAge Labs partnering with Novartis to explore longevity targets, showcase how regional players leverage oxidative stress data to open new therapeutic frontiers.
Europe Oxidative Stress Assay Market
Europe follows closely, propelled by stringent 3Rs directives that push laboratories toward validated in-vitro oxidative platforms. Academic centers supply a steady pipeline of assay innovations, while reagent companies emphasize standardized reference materials that meet European Medicines Agency expectations. Joint public–private projects accelerate technology translation and embed oxidative testing in sustainable research frameworks.
APAC Oxidative Stress Assay Market
Asia Pacific records the fastest 11.05% CAGR through 2031. Chinese institutes advance electrochemical biosensors, and Japan aligns nutraceutical regulations with rigorous oxidative endpoint validation, broadening commercial demand. Government investment in biotechnology education is narrowing the analyst skills gap. Multinational suppliers expand distribution hubs and localized technical support, reflecting confidence in regional growth momentum.

Regulatory Landscape
In the United States, oxidative stress assays that support in vitro diagnostics and safety testing increasingly fall under standard medical-device oversight pathways, led by the US Food and Drug Administration (FDA). The FDA initiated a staged phaseout of enforcement discretion for laboratory developed tests (LDTs) beginning May 6, 2024, with additional compliance milestones on May 6, 2026 that include registration and listing for applicable IVDs and labeling requirements for most IVD products offered as LDTs. This tightens expectations around documentation, validation, and post-market requirements for oxidative biomarker-based assays used in clinical workflows.
On the standards side, ISO 10993-1:2025 reinforces a risk-management approach to biocompatibility that emphasizes material characterization and in vitro methods, supporting broader use of oxidative degradation and oxidative biomarker testing within medical-device development. FDA quality system expectations commonly align with ISO 13485, shaping how assay kit and instrument manufacturers structure design controls, change management, and traceability. In February 2026, the FDA also published a Regulatory Science Tool method (RST26MC01.01) related to maintaining oxidative capacity in test solutions for oxidative degradation screening of medical devices, which provides a practical reference point for labs generating oxidative-degradation data under regulated programs.
Value Chain Analysis
The value chain spans (1) specialty inputs, including chemically synthesized dyes/substrates and enzymes for colorimetric, fluorometric, and luminescence assays, plus antibodies and recombinant proteins for immunoassays; (2) assay development and manufacturing by large diversified suppliers and specialist kit makers; (3) instrument OEMs and platform vendors providing flow cytometry, ELISA, chromatography, microscopy, and label-free impedance/real-time cell analysis systems; and (4) distribution and end-use across pharmaceutical and biotechnology companies, CROs, and academic/research institutes. Participation also includes diversified manufacturers such as Thermo Fisher Scientific, Merck KGaA, and Qiagen N.V., alongside specialized providers including Oxford Biomedical Research, BioAssay Systems, Signosis, Redox Diagnostics, GENOX, and Enzo Life Sciences, with Abcam supporting oxidative stress marker and redox biochemistry assay offerings.
Downstream, cold-chain logistics and regional warehousing matter for temperature-sensitive reagents, while direct-to-lab ordering and regional distributor partnerships are used to improve lead times and buffer supply volatility. Many oxidative stress kits are positioned as research use only (RUO), which accelerates research adoption but increases the quality and documentation expectations when developers pursue clinical or regulated toxicology uses. Workflow integration, including bundling reagents, controls, software, and instruments into sample-to-insight packages, is a key value-capture point as customers shift toward multi-marker panels (ROS, MDA, GSH, SOD, 8-OHdG, lipid peroxidation) rather than single-endpoint tests.
Competitive Landscape
The oxidative stress assays market is moderately concentrated. Thermo Fisher Scientific, Abcam, and Merck KGaA leverage broad portfolios and global logistics to defend share, while agile specialists differentiate through proprietary probes or AI dashboards. Technology leadership outweighs price competition; customers value instruments that integrate data analytics and comply with evolving regulatory formats.
Mergers and alliances continue to reshape the field. Bio-Rad’s acquisition of Stilla Technologies bolstered digital PCR accuracy for redox markers, and Novartis joined BioAge Labs to mine aging datasets for oxidative targets. Start-ups focus on label-free, real-time sensing that bypasses fluorescent artifacts. Established firms counter by bundling consumables, software, and service contracts into platform subscriptions. Standardized ROS reference materials remain unmet needs that present white-space potential.
Oxidative Stress Assay Industry Leaders
Abcam plc
Merck KGaA
Thermo Fisher Scientific
Promega Corporation
Qaigen N.V.
- *Disclaimer: Major Players sorted in no particular order
Oxidative Stress Assay Market Companies Covered in this Report
- Thermo Fisher Scientific
- Abcam
- Merck
- QIAGEN
- Promega
- Cell Biolabs
- Cayman Chemical
- Enzo Life Sciences
- AMSBIO
- ImmunoChemistry Technologies
- Biovision
- Creative Diagnostics
- R&D Systems (Bio-Techne)
- Ethos Biosciences
- Signosis Inc.
- Agilent Technologies
- BioAssay Systems
- AssayGenie
- Bio-Rad Laboratories

Market Opportunities and Future Outlook
A key whitespace is clinical-grade, standardized multi-biomarker panels that move beyond direct ROS measurement toward stable downstream markers such as malondialdehyde (MDA), 4-HNE adducts, protein carbonyls, and 8-OHdG, supported by clearer pre-analytical handling requirements. Published clinical and translational work in 2025-2026 continues to prioritize these endpoints, and it also points to how panels combining oxidative and inflammatory readouts can be more actionable than single-analyte measures. This creates room for kit makers and platform vendors to package validated controls, reference materials, and SOP-aligned workflows that reduce inter-lab variability.
Technology-driven opportunities also center on higher-specificity analytical workflows and longitudinal, label-free measurements. Adoption of high-sensitivity LC-MS/MS, HPLC-based adductomics, and emerging persulfidomics-style measurements expands the set of oxidative metabolites that can be quantified alongside conventional antioxidant capacity and enzyme-based assays. In parallel, label-free impedance and real-time cell analysis enable continuous readouts that mitigate probe-derived artifacts. On the demand side, major clinical frameworks increasingly formalize metabolic and organ-function risk assessment, and the June 2026 AHA/ACC/ADA/ASN guideline for Cardiovascular-Kidney-Metabolic (CKM) syndrome anchors a screening and monitoring pathway where oxidative-stress-linked biomarker development and validation activity can concentrate, particularly for panel-based assays that fit high-throughput laboratory workflows.
Recent Industry Developments in Oxidative Stress Assay Market
- May 2026: Abbkine introduced the CheKine Micro Protein Carbonyl Assay Kit (KTB1200) to quantify protein oxidative damage as a downstream oxidative stress endpoint. Adding protein carbonyl testing complements ROS-only workflows and supports multi-marker study designs that improve specificity in oxidative stress research.
- March 2026: Elabscience released its Total and Reduced Glutathione Assay Kit (E-BC-F045) for glutathione profiling in oxidative stress studies. The launch strengthens access to GSH-focused readouts that are widely used in cell-based models and can be paired with ROS and lipid peroxidation assays for multiplex redox characterization.
- September 2025: Lumiquick Diagnostics acquired AOXRE LLC to integrate Bioxytech oxidative stress biomarker assay kits into its offerings. The acquisition consolidates a niche oxidative biomarker portfolio under a broader diagnostics platform and expands commercialization options for established oxidative stress kit lines.


Oxidative Stress Assay Market Report Scope and Research Methodology
Market Definition and Coverage
The oxidative stress assay market covers revenues from products and related services used to detect or quantify oxidative stress markers in biological samples. This includes assays used in research workflows and diagnostic oriented testing across major regions.
Scope exclusions: We exclude general lab consumables not specific to oxidative stress measurement and broad instrument sales that are not directly tied to oxidative stress assay use cases.
Segments Covered in This Report
- By Product
- Instruments
- Consumables
- By Test Type
- Indirect Assays
- Antioxidant Capacity Assays
- Enzyme-based Assays
- Reactive Oxygen Species (ROS)-based Assays
- By Technology
- Enzyme-linked Immunosorbent Assay (ELISA)
- Flow Cytometry
- Chromatography
- Microscopy
- Label-free Impedance & Real-Time Cell Analysis
- By Disease Type
- Cardiovascular Diseases
- Chronic Obstructive Pulmonary Disease (COPD)
- Cancer
- Neuro-degenerative Disorders
- By End User
- Pharmaceutical & Biotechnology Companies
- Academic & Research Institutes
- Contract Research Organizations
- By Sample Type
- Cell-based Samples
- Tissue Homogenates
- Blood / Plasma
- Urine & Other Biofluids
- By Geography
- North America
- United States
- Canada
- Mexico
- Europe
- Germany
- United Kingdom
- France
- Italy
- Spain
- Rest of Europe
- Asia-Pacific
- China
- Japan
- India
- Australia
- South Korea
- Rest of Asia-Pacific
- Middle East and Africa
- GCC
- South Africa
- Rest of Middle East and Africa
- South America
- Brazil
- Argentina
- Rest of South America
- North America
Data Sources, Market Sizing, and Validation
Desk Research
Desk work started by mapping where oxidative stress assays are used and where the spending comes from, then aligning it with public data series that describe demand and funding flows. We referenced sources such as the World Health Organization for disease burden context, the US National Institutes of Health and the OECD for biomedical R&D funding direction, the US FDA for diagnostic and clinical testing signals, and the World Bank for country level health and research indicators.
We also used publicly available company filings, investor presentations, and university and hospital lab procurement notes where available, plus reputable science journals, to sense-check which assay formats and markers are gaining attention. For price and mix logic, we used paid subscriptions for company financials and intelligence, supported by a patent database to track assay chemistry and detection method activity over time. This desk source list is not exhaustive, and additional public and paid references were used to collect inputs, validate assumptions, and clarify open questions.
Primary Interviews and Surveys
Primary work focused on interviews and short surveys with assay kit and reagent suppliers, instrument channel partners, contract research teams, and end users in pharma, biotech, and academic labs, so we could validate purchase drivers and typical ordering patterns. Since usage varies with lab maturity and funding cycles, feedback was also used to confirm adoption differences across major regions and to tighten assumptions that were unclear from desk sources.
Distribution of primary research fieldwork respondents
| Company type | Respondent position | Region |
|---|---|---|
| Top tier: 32% | CXOs: 13% | APAC: 44% |
| Mid tier: 51% | Functional/Unit leaders: 32% | EMEA: 30% |
| Smaller Players: 17% | Managers: 55% | Americas: 26% |
Market-Sizing & Forecasting
Sizing was built using a top-down and bottom-up approach. On the top-down side, we reconstructed demand from the active research and testing base and then linked it to oxidative stress assay usage intensity. The model was anchored on lab and clinical testing activity signals, and then penetration and repeat purchase logic were applied for oxidative stress panels, kits, and reagents in the settings where they are routinely used.
To keep the model tied to observed buying behavior, we used variables such as R&D funding trends, chronic disease and oncology research activity signals, typical test frequency by study type, the split between consumables and instruments, and average selling price movement by assay format (for example, colorimetric versus fluorometric workflows). We then corroborated results with selective bottom-up approximations based on sampled product portfolios, channel checks, and volume by end-user type. Where a country or segment had thin public disclosure, gaps were handled by using conservative ranges.
For forecasting, we used scenario analysis because demand can shift with funding cycles, new assay chemistry launches, and the pace of adoption in emerging labs. Inputs were projected with trend-based smoothing on mature markets and refreshed assumptions from primary feedback in faster-growing regions, and final totals were rolled forward year by year.
Data Validation & Update Cycle
Outputs are cross-checked against independent signals, including funding direction, publication and trial activity related to oxidative stress markers, and observable shifts in consumables versus instrument mix. When a country or segment shows a jump that does not match these signals, we review the drivers, rework assumptions, and trigger interview follow-ups if needed.
Before sign-off, a second analyst reviews the logic, inputs, and math, and variances are documented so the reasoning stays easy to trace. Reports refresh annually, and interim updates are made when material events occur that can change pricing, availability, or adoption. Before delivery, we do a fresh pass on key assumptions so clients receive the latest updated view.
Mordor Intelligence's Oxidative Stress Assay Market Estimate Compared With Other Published Estimates
Published estimates for oxidative stress assays often do not align because each source uses its own split between consumables, instruments, and services, and applies different adoption and pricing assumptions across regions. Timing differences also matter, since base years, currency conversion timing, and how inflation is treated can affect the stated value.
The main gap drivers here are scope and the demand pool that is assumed. Some estimates lean more on broad life science tool spending, while others restrict to oxidative stress marker specific testing. Another common difference is how average selling prices are stepped forward. Some models keep ASPs flat, while others assume rapid mix shift into higher priced, multiplex capable formats. In our view, this spread is reduced when the consumables repeat purchase cycle is explicitly modeled, which is consistent with how the 2026 value is constructed in Mordor Intelligence.
Benchmark comparison
| Source | Market Size | Gaps in Research Methodology |
|---|---|---|
| Mordor Intelligence | USD 1.46 B (2026) | |
| Trade Journal A | USD 1.22 B (2023) | Uses an earlier base year and a longer horizon, and the scope description is high level, so the split across consumables, instruments, and services is not clearly tied to assay-specific usage intensity. |
| Industry Bulletin B | USD 1.05 B (2023) | Anchors on a different starting year and appears to apply broad growth assumptions across offerings, which can understate near-term mix shift and regional adoption differences. |
The table shows that the spread is largely explained by year alignment and how tightly the definition is linked to assay-specific demand rather than wider lab tool spending. By keeping inputs traceable to adoption, repeat purchase behavior, and price movement by assay format, the estimate remains practical to replicate and easier to audit when new information becomes available.


Key Questions Answered in the Report
What is the current value of the oxidative stress assays market?
The oxidative stress assays market is valued at USD 1.46 billion in 2026 and is on track to reach USD 2.32 billion by 2031.
Which product segment is expected to grow fastest?
Consumables are projected to register the fastest 13.12% CAGR as ready-to-use kits and probes gain traction.
Why are ROS-based assays so important for drug development?
They capture real-time fluctuations in reactive oxygen species, providing direct insight into disease mechanisms that guide lead optimization and safety profiling.
Which region shows the strongest growth momentum?
Asia Pacific posts the highest 11.05% CAGR through 2031, supported by expanding pharmaceutical R&D and rising healthcare investments.Asia Pacific posts the highest 11.05% CAGR through 2031, supported by expanding pharmaceutical R&D and rising healthcare investments.
How are regulators influencing assay adoption?
The FDA and European agencies promote in-vitro oxidative stress assays as humane, mechanistic alternatives to animal testing, accelerating market uptake in toxicology workflows.
What are the main barriers for new entrants?
High instrument costs and the shortage of analysts skilled in multi-modal data interpretation remain the largest hurdles for smaller laboratories.
Page last updated on:


 Your data is secure and never sold or shared.


