
Market Overview
| Study Period | 2020 - 2031 |
|---|---|
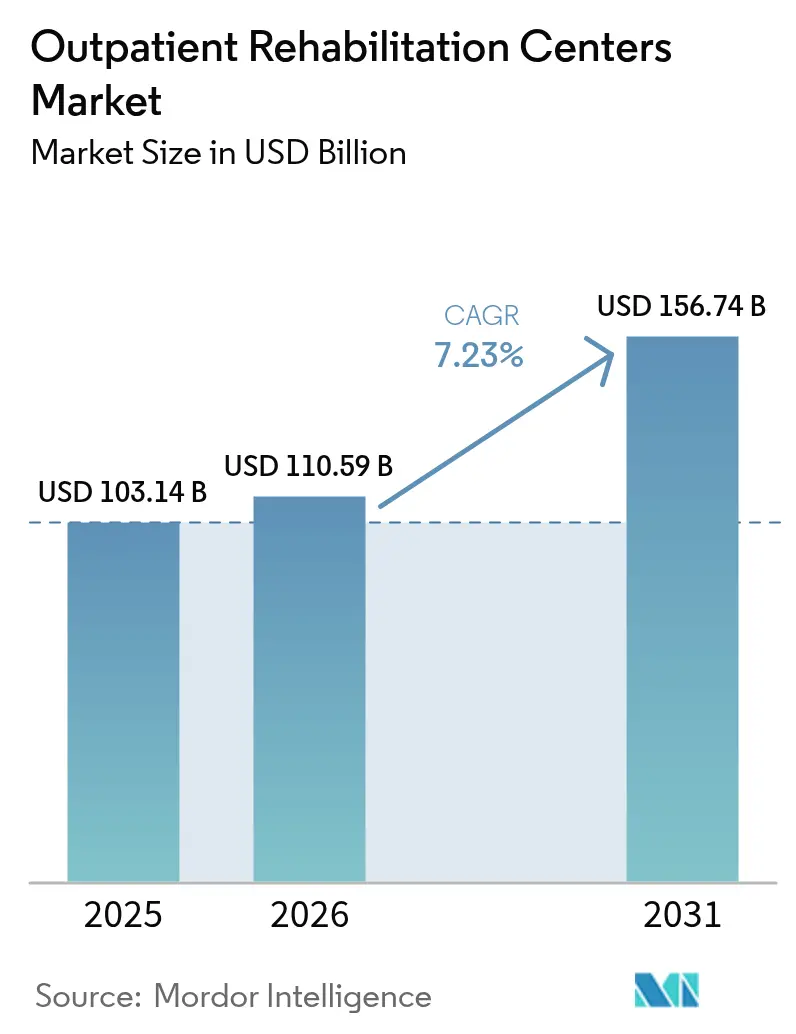
| Market Size (2026) | USD 110.59 Billion |
| Market Size (2031) | USD 156.74 Billion |
| Growth Rate (2026 - 2031) | 7.23 % |
| Fastest Growing Market | Asia-Pacific |
| Largest Market | North America |
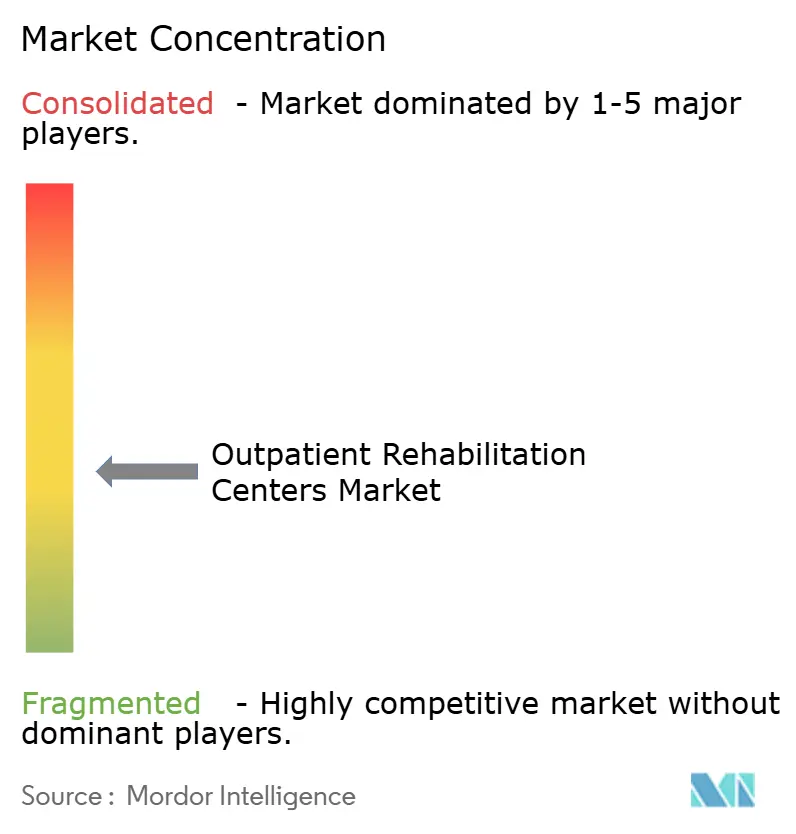
| Market Concentration | Medium |
Major Players *Disclaimer: Major Players sorted in no particular order Image © Mordor Intelligence. Reuse requires attribution under CC BY 4.0. | |
Outpatient Rehabilitation Centers Market Analysis by Mordor Intelligence
The outpatient rehabilitation centers market size is expected to grow from USD 103.14 billion in 2025 to USD 110.59 billion in 2026 and is forecast to reach USD 156.74 billion by 2031 at 7.23% CAGR over 2026-2031. This steady expansion reflects demographic aging, the surge in chronic diseases, and payer-led cost-containment that shifts volumes away from inpatient facilities. New Medicare Intensive Outpatient Program (IOP) billing codes introduced in 2024 have broadened reimbursement, while tele-rehab parity laws and employer-sponsored musculoskeletal (MSK) programs are funneling additional patient traffic into clinics. Technological adoption—from virtual reality (VR) therapy to AI-guided exercise prescriptions—continues to elevate clinical outcomes and widen provider reach. Consolidation remains an overarching theme as scale advantages help clinics absorb talent shortages and reimbursement pressure, yet the model is still largely fragmented and ripe for acquisition.
Key Report Takeaways
- By program, standard outpatient programs led with 39.12% of outpatient rehabilitation centers market share in 2025; hybrid tele-outpatient programs are poised for the fastest expansion at a 10.32% CAGR to 2031.
- By therapy, physical therapy held 42.31% of the outpatient rehabilitation centers market size in 2025, but VR-assisted therapy is forecast to accelerate at an 11.05% CAGR through 2031.
- By condition, musculoskeletal rehabilitation commanded 43.85% of outpatient rehabilitation centers market size in 2025, whereas cardiac rehabilitation will record the quickest growth at a 10.29% CAGR.
- By end user, adults represented 50.71% of 2025 volume; sports-injury patients form the most dynamic segment, expanding at a 9.11% CAGR to 2031.
- By geography, North America captured 44.05% of 2025 revenue, while Asia-Pacific is on track for the highest regional CAGR of 9.62% in the forecast window.
Note: Market size and forecast figures in this report are generated using Mordor Intelligence’s proprietary estimation framework, updated with the latest available data and insights as of 2026.
Market Trends and Insights
Drivers Impact Analysis of Outpatient Rehabilitation Centers Market*
| Driver | (~) % Impact on CAGR Forecast | Geographic Relevance | Impact Timeline |
|---|---|---|---|
| Rapidly Ageing Population & Chronic Disease Burden | +1.8% | Global, with highest impact in North America and Europe | Long term (≥ 4 years) |
| Cost-Shift From Inpatient To Lower-Cost Outpatient Settings | +1.4% | Global, led by North America and Europe | Medium term (2-4 years) |
| Inclusion Of Intensive Outpatient Program (IOP) Codes In Medicare (2024) | +0.9% | North America, specifically United States | Short term (≤ 2 years) |
| Tele-Rehab Parity Laws Boosting Rural Access | +0.7% | North America and Australia, rural regions | Medium term (2-4 years) |
| Employer-Sponsored MSK Programmes Driving Clinic Foot-Fall | +0.6% | North America and Europe, urban centers | Short term (≤ 2 years) |
| ACO / MSO Consolidation Accelerating Referral Volumes | +0.5% | North America, integrated health systems | Medium term (2-4 years) |
| Source: Mordor Intelligence | |||
Rapidly ageing population & chronic disease burden
Adults aged 65+ will exceed 20% of the U.S. population by 2030, intensifying demand for rehabilitation of arthritis, cardiovascular sequelae, and diabetes-related mobility issues. With 39% of adults already living with at least one chronic disease, payers and providers view outpatient programs as the most cost-effective long-term management setting. Clinics that bundle physical, occupational, and behavioral therapies are especially positioned to capture sustained, non-cyclical volumes.
Cost-shift from inpatient to lower-cost outpatient settings
Outpatient visits are projected to hit 5.82 billion annually by 2030, propelled by Medicare’s value-based purchasing and payer pushback against high hospital facility fees. States trimming Certificate-of-Need requirements have fueled a jump in ambulatory facility openings, widening choice for both surgeons and rehabilitation patients. Because outpatient rehabilitation costs 30-50% less than comparable inpatient episodes, commercial payers increasingly steer beneficiaries toward community clinics for post-acute recovery.
Inclusion of Intensive Outpatient Program codes in Medicare (2024)
Medicare’s new IOP codes allow hospitals, CAHs, and community mental health centers to bill at least nine hours of structured psychiatric care weekly, unlocking fresh revenue pools for rehabilitation operators embracing behavioral health.[1]Initial claims data show outpatient behavioral volumes rising in tandem, strengthening the business case for integrated physical-mental service lines.
Tele-rehab parity laws boosting rural access
Permanent telehealth parity in many U.S. states and Australia equalizes reimbursement for virtual and in-person sessions, eliminating geography as a payer hurdle. Rural Health Clinics secured rule changes that maintain flexibilities through December 2025, further easing adoption.[2] By layering remote monitoring and VR coaching atop limited on-site therapy, providers can stretch scarce clinical staff across wider patient panels.
Restraints Impact Analysis of Outpatient Rehabilitation Centers Market*
| Restraint | (~) % Impact on CAGR Forecast | Geographic Relevance | Impact Timeline |
|---|---|---|---|
| Shortage Of Licensed Therapists & Clinicians | -1.2% | Global, most acute in North America and Europe | Long term (≥ 4 years) |
| Downward Reimbursement Pressure From Private Payors | -0.8% | North America and Europe, private insurance markets | Medium term (2-4 years) |
| Rising Cyber-Security & HIPAA Compliance Costs For Tele-Rehab | -0.4% | Global, technology-dependent markets | Short term (≤ 2 years) |
| Community Zoning Restrictions On New Outpatient Sites | -0.3% | North America, urban and suburban markets | Medium term (2-4 years) |
| Source: Mordor Intelligence | |||
Shortage of licensed therapists & clinicians
A projected shortfall of 12,070 full-time physical therapists by 2037 threatens capacity, with current outpatient vacancy reaching 9.5% and rural supply at just 19% of need.[3] Salary inflation and retention bonuses squeeze margins for smaller independents and may slow new-site rollouts.
Downward reimbursement pressure from private payors
The 2025 Physician Fee Schedule lowers Medicare conversion factors 2.93%, signaling similar moves by commercial carriers. Prior-authorization protocols and shorter approved episode durations obligate clinics to prove outcomes quickly or absorb unreimbursed visits.
*Our forecasts treat driver/restraint impacts as directional, not additive. The impact forecasts reflect baseline growth, mix effects, and variable interactions.
Outpatient Rehabilitation Centers Market Segment Analysis
By Program:
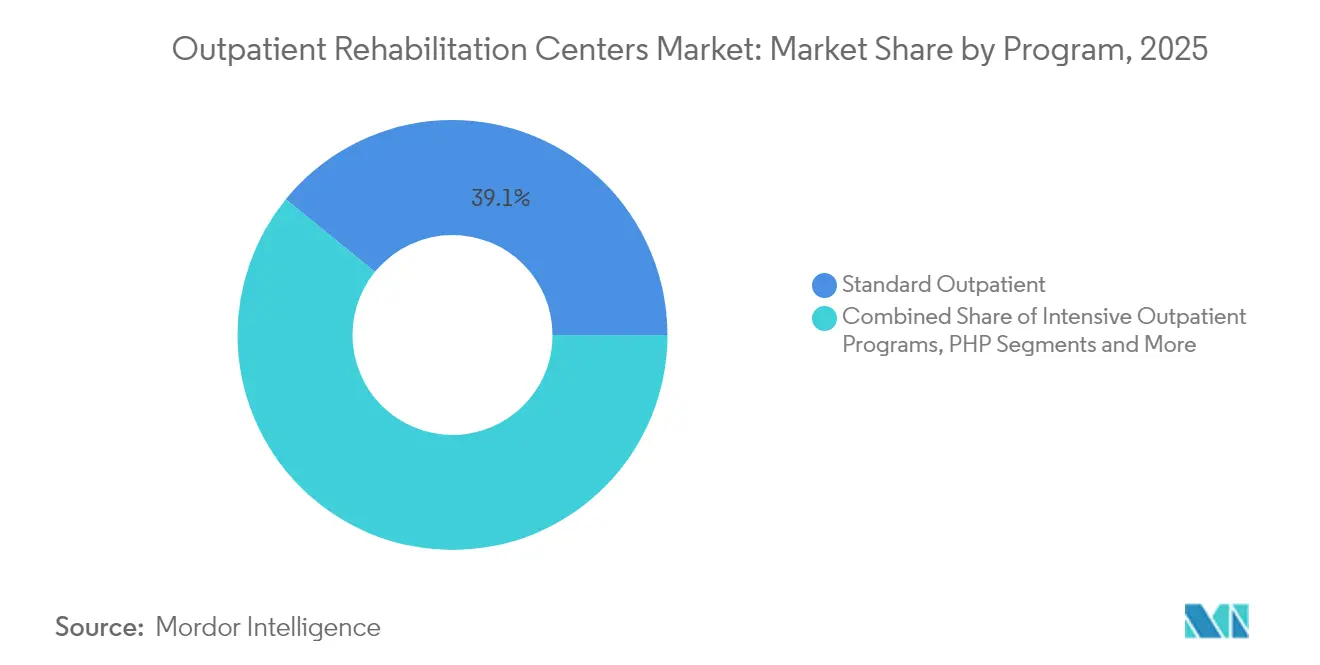
Hybrid Models Drive InnovationStandard outpatient programs generated the largest share of 39.12% in 2025, underpinning the outpatient rehabilitation centers market through routine post-surgical and chronic-care visits. These clinics benefit from predictable volume streams and embedded referral pathways. Hybrid tele-outpatient programs, although nascent, are scaling at a 10.32% CAGR as patients welcome the convenience of alternating in-clinic assessments and at-home VR-guided sessions. Payers back these models when real-time data feed proves adherence and functional gains, curbing unnecessary in-person encounters and travel costs.
Hybrid formats combine traditional therapist oversight with AI-driven progress dashboards. Because reimbursement parity exists in many jurisdictions, providers can monetize digital-first follow-ups without revenue dilution. Intensive outpatient programs, newly reimbursable under Medicare, add a behavioral-health revenue layer, while partial-hospitalization and day-rehab schemes address complex neurologic and orthopedic cases needing multidisciplinary input. The upshot is a diversified service mix that cushions operators against payer or regulatory shocks.

By Therapy:
VR Technology Transforms Treatment ParadigmsPhysical therapy accounted for 42.31% of 2025 revenue, making it the anchor modality on which most clinics build broader service bundles. Its dominance stems from pervasive MSK and post-operative needs. VR-assisted therapy, expanding at an 11.05% CAGR, introduces immersive tasks that sharpen balance and neuro-motor control, shortening average recovery timelines. Occupational and speech therapy maintain steady demand for stroke and pediatric populations, whereas cognitive behavioral therapy and motivational interviewing open new revenue lanes in integrated substance-use and chronic-pain programs.
Therapists increasingly deploy exoskeletons and gamified VR labs to manage higher caseloads without sacrificing quality. AI-backed platforms personalize session intensity and adapt exercise scripts mid-stream, boosting adherence and outcomes. As outcome-based reimbursement tightens, clinics leveraging objective digital metrics gain favor with value-based payors.
By Condition Treated:
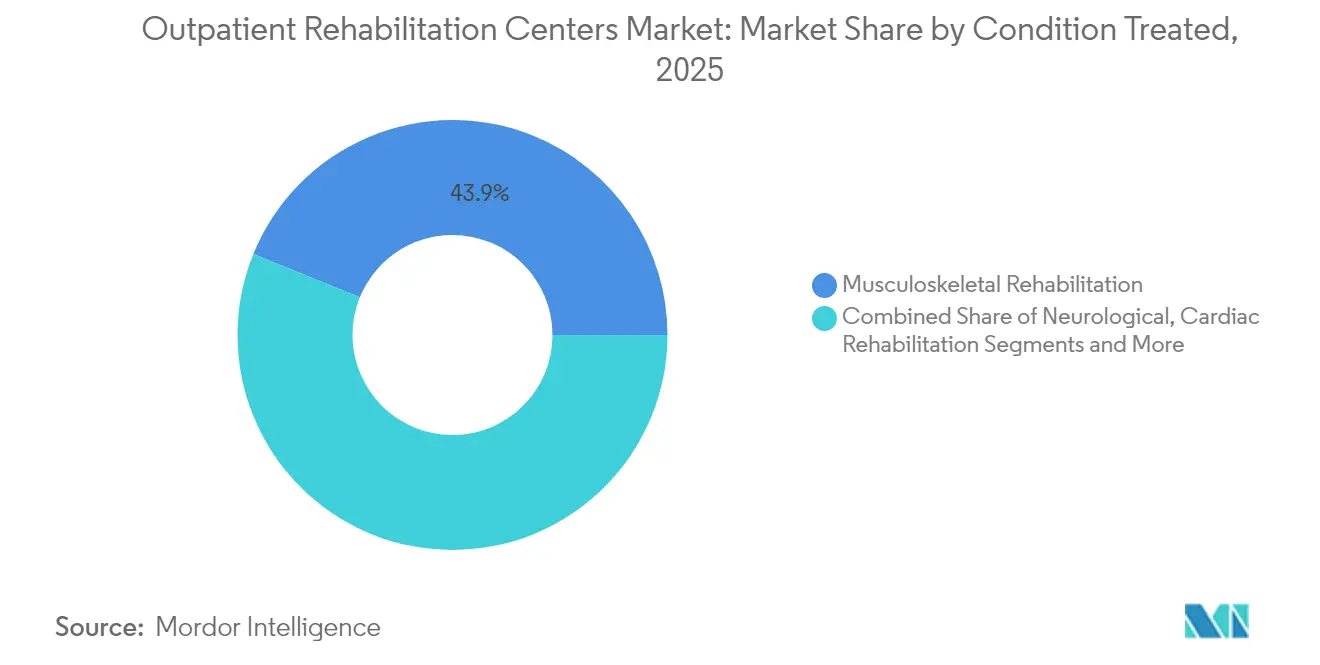
Cardiac Rehabilitation Accelerates GrowthMusculoskeletal rehabilitation remained the largest condition category in 2025 at 43.85% because of prevalent workplace injuries and degenerative joint disease. Cardiac rehabilitation, though smaller, is outpacing all others at a 10.29% CAGR as guidelines embed rehab into secondary-prevention bundles following myocardial infarction and coronary bypass. Neuro-rehabilitation stands as a high-acuity segment requiring long episode lengths, while pulmonary and substance-use programs are expanding under integrated care protocols.
Remote patient monitoring devices now feed cardiopulmonary vitals directly into clinic dashboards, enabling therapists to titrate effort levels safely in home settings. VR-based neuro exercises demonstrate superior upper-limb gains in stroke survivors compared with conventional methods, unlocking payer support in outcome-driven contracts.
By End User:
Sports Medicine Drives Premium GrowthAdults constituted 50.71% of 2025 visits and will remain the volume mainstay as chronic-care prevalence rises. Sports-injury patients, however, exhibit a 9.11% CAGR, drawn to high-tech gait labs and performance-optimization packages that carry premium price tags. Geriatric demand rises steadily as fall-prevention and osteoporosis programs extend functional independence, while pediatric rehabilitation requires developmental tailoring and family engagement.
Sports rehabilitation centers differentiate by integrating motion-capture analytics and strength-conditioning curricula, expanding revenue per patient and fueling word-of-mouth referrals among athletic communities. Workers’ compensation cases continue to supply reliable, insurer-funded caseloads focused on expedited return-to-duty metrics.
Geography Analysis
North America Outpatient Rehabilitation Centers Market
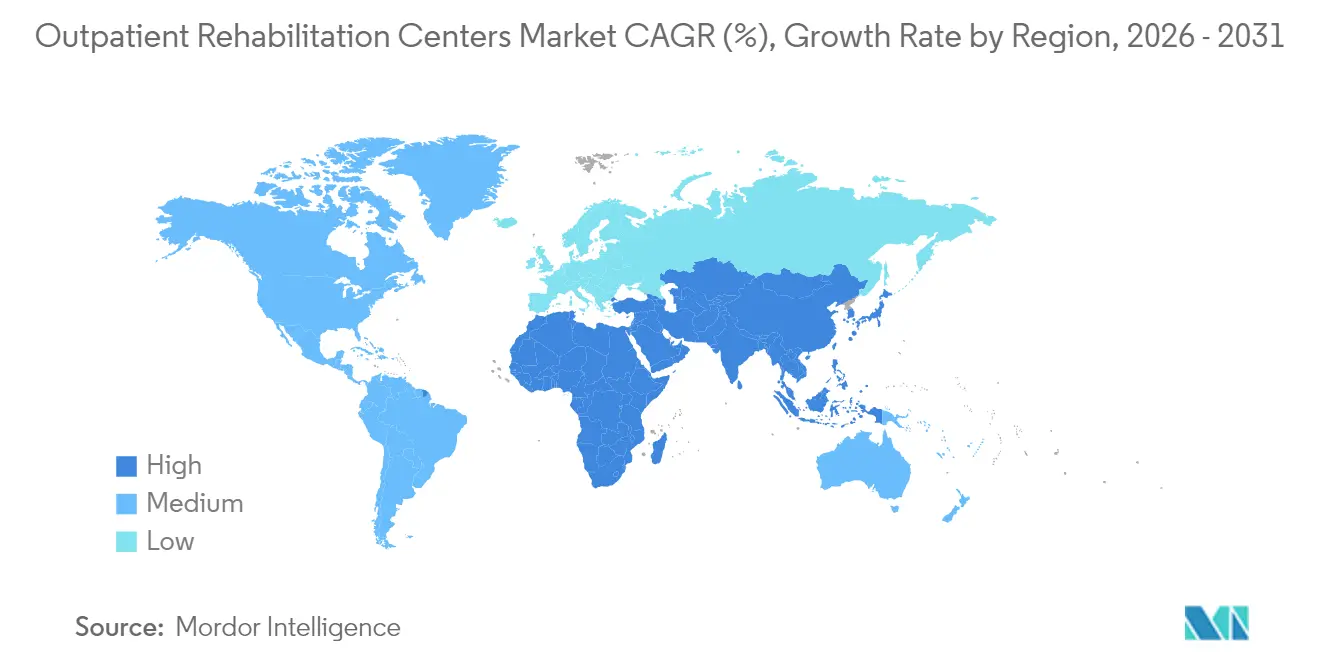
North America led the outpatient rehabilitation centers market with 44.05% revenue share in 2025, powered by broad insurance coverage, wage-adjusted reimbursement, and dense clinic networks. The United States embodies most spending, as Medicare and large commercial insurers reimburse diverse program types, including the new IOP behavioral codes. Canada supplements demand through universal coverage and rising chronic-disease prevalence, while Mexico’s growing medical tourism and employer MSK initiatives add cross-border volume.
Europe Outpatient Rehabilitation Centers Market
Europe maintains mid-single-digit growth thanks to public-sector investment in community-based rehab and updated EU directives favoring home-based tele-rehab. Countries such as Germany are rolling out digital-health prescriptions reimbursed under statutory insurance, widening VR therapy acceptance. The United Kingdom’s NHS long-term plan invests in MSK hubs that coordinate surgeon, physio, and occupational therapy under value-based budgets, increasing outpatient throughput.
APAC Outpatient Rehabilitation Centers Market
Asia-Pacific is the fastest-expanding region with a 9.62% CAGR, propelled by rapid population aging in China, South Korea, and Singapore, plus public–private partnerships that finance greenfield clinic builds. Governments champion AI adoption to offset therapist shortages, sparking demand for smart rehabilitation devices. Emerging markets such as India and Indonesia witness surging lifestyle disease incidence, spurring domestic chains to replicate Western outpatient models. Tele-rehab overcomes rural provider gaps and reduces capital required per patient served, accelerating geographic coverage.
South America and MEA Outpatient Rehabilitation Centers Market
South America and the Middle East & Africa present nascent yet promising landscapes. Brazil is streamlining private-insurance approvals for outpatient rehab as hospital occupancy rates climb, whereas Saudi Arabia’s Vision 2030 health agenda designates rehabilitation as a priority service. Infrastructure constraints and clinician scarcity continue to limit immediate scale, but bilateral training initiatives with U.S. and European partners are beginning to bolster capacity.
Regulatory Landscape
In the United States, outpatient rehabilitation participation in Medicare is anchored by Centers for Medicare & Medicaid Services (CMS) conditions for Comprehensive Outpatient Rehabilitation Facilities (CORFs) under 42 CFR 485.50-485.74, alongside therapy billing and documentation requirements administered through CMS and HHS guidance. For CY 2026, CMS maintains the KX modifier threshold at USD 2,480 for PT/SLP combined and USD 2,480 for OT, and it adds new Remote Therapeutic Monitoring (RTM) codes (98979, 98984, 98985) designated as sometimes therapy services. This expands reimbursement pathways linked to digitally tracked adherence and progress.
Tele-rehabilitation oversight is increasingly shaped by federal policy and device governance. Section 6209 of the Consolidated Appropriations Act, 2026 extends authorization for PTs, OTs, and SLPs to furnish telehealth services (including telephone assessment and management) through December 31, 2027, supporting hybrid care models while raising HIPAA and cybersecurity compliance demands. In Europe, rehabilitation equipment procurement and clinical use are influenced by Medical Device Regulation (EU) 2017/745 (MDR) and related implementing rules such as Implementing Regulation (EU) 2026/977. Extended MDR transition periods for legacy devices, varying by risk class into 2027-2029, ease supply timing for some assets while keeping conformity assessment timelines central to purchasing decisions.
Value Chain Analysis
The value chain runs from referral generation and care coordination (acute-care hospitals, orthopedic and cardiology practices, ACO/MSO networks, employers, and workers' compensation) to care delivery (outpatient clinic operators and therapist labor). Enabling infrastructure includes EHR and digital engagement platforms, remote monitoring tools, and revenue cycle and billing services. Therapy inputs cover rehabilitation equipment such as robotics, sensors, motion-capture and VR systems, as well as orthotics/prosthetics and other durable medical equipment.
Reimbursement and utilization management by public and private payers shape visit authorization, documentation, and outcomes reporting requirements that drive clinic throughput and margins. Negotiation points concentrate on clinician supply and specialized technology procurement, with labor availability (licensed therapists and assistants) acting as a key capacity constraint. High-tech rehabilitation tools can also create single-source dependencies for components, software licensing, and maintenance, increasing exposure to delays and service interruption. Larger multi-site networks and hospital-affiliated operators increasingly centralize contracting and procurement to improve unit economics and standardize protocols, while smaller clinics use distributors, group purchasing, and cloud software vendors to access advanced modalities without heavy upfront capital. Across both models, CORF compliance requirements under 42 CFR Part 485 and payer billing rules influence staffing mix, supervision, and the minimum service set delivered.
Competitive Landscape
The outpatient rehabilitation centers market remains fragmented, with the top ten operators controlling less than 20% of global revenue. Select Medical and Encompass Health expand by clustering multi-disciplinary centers near acute-care hospitals to capture bundled-payment discharges. ATI Physical Therapy focuses on employer MSK partnerships, while FOX Rehabilitation and Powerback Rehabilitation accelerate via acquisitions—FOX acquired Ageility in 2024 and Powerback bought Encore GC the same year.
Technology is now a primary differentiator. Net Health’s June 2025 acquisition of Limber Health adds remote-exercise tracking to its EHR suite, equipping small clinics with enterprise-grade data capture. DIH’s partnership with Nobis Rehabilitation deploys robotics and sensor-based gait training in inpatient-to-outpatient transitions, raising throughput without proportional headcount growth. Early adopters of VR platforms report double-digit increases in patient satisfaction scores and measurable reductions in average visits per episode, appealing to payers eyeing total-cost savings.
Value-based contracts continue to mature. Operators able to furnish real-time functional-outcome dashboards win share from independents reliant on fee-for-service models. However, capital intensity for technology rollouts and talent recruitment spurs ongoing consolidation; private-equity vehicles favor multi-state bolt-on strategies that build regional density and bargaining leverage with insurers and referring surgeons.
Outpatient Rehabilitation Centers Industry Leaders
-
Select Medical Holdings
-
AIM Health Group Inc.
-
LHC Group, Inc.
-
Trilogy Health Services, LLC.
-
Craig Hospital
- *Disclaimer: Major Players sorted in no particular order
Outpatient Rehabilitation Centers Market Companies Covered in this Report
- Select Medical
- Kindred Healthcare
- Encompass Health
- ATI Physical Therapy
- LHC Group
- Shirley Ryan AbilityLab
- Mayo Clinic
- Kessler Institute for Rehabilitation
- Brooks Rehabilitation
- U.S. Physical Therapy Inc.
- Athletico Physical Therapy
- Pivot Physical Therapy
- AIM Health Group
- Craig Hospital
- Moss Rehabilitation
- Rusk Rehabilitation
- Shephard Center
- Trilogy Health Services
- TIRR Memorial Hermann
- The Dunes East Hampton
Read Analysis of Outpatient Rehabilitation Centers Companies
Market Opportunities and Future Outlook
Reimbursement and care-model flexibility in the United States support near-term whitespace for hybrid tele-outpatient programs that pair in-clinic evaluations with remote follow-ups. CY 2026 CMS actions, including new RTM codes (98979, 98984, 98985) designated as sometimes therapy services, alongside the KX modifier threshold maintained at USD 2,480 for PT/SLP combined and USD 2,480 for OT, support provider investment in data capture, adherence tracking, and outcomes dashboards. These capabilities can then be leveraged across payer contracts. At the same time, the Consolidated Appropriations Act, 2026 extends telehealth authority for PTs, OTs, and SLPs through December 31, 2027, reinforcing operating models that stretch scarce clinicians across broader geographies while keeping documentation, privacy, and cybersecurity capabilities as competitive differentiators.
Beyond modality, service-line expansion is tied to behavioral health integration and employer-oriented MSK programs, where operators can bundle physical therapy with structured mental and social support pathways. The Medicare Intensive Outpatient Program (IOP) billing changes introduced in 2024 widen the reimbursable footprint for structured outpatient psychiatric care, which supports clinics building integrated physical-mental programs for chronic pain, post-surgical recovery, and substance-use comorbidities. Technology adoption is also a concrete differentiator, with EHR and remote-care toolkits such as Net Health expanding into remote exercise tracking via Limber Health helping smaller clinics operationalize hybrid pathways, standardize outcomes reporting, and participate in value-based arrangements with fewer manual workflows.
Recent Industry Developments in Outpatient Rehabilitation Centers Market
- July 2026: Select Medical and Tallahassee Memorial HealthCare formed a joint venture partnership to operate a 47-bed specialty hospital in Tallahassee, Florida, including 19 critical illness recovery beds and 28 acute rehabilitation beds. The project expands Select Medicals post-acute continuum in the Florida Panhandle and strengthens hospital-aligned referral capture across complex recovery pathways.
- May 2026: Select Medical and Carilion Clinic entered a joint venture to build and operate a new 50-bed inpatient rehabilitation hospital in Roanoke, Virginia, with construction starting in spring 2026. The partnership adds capacity in a growing regional hub and supports tighter transitions from acute care to rehab within a shared operating model.
- July 2024: Blue Cross Blue Shield of Michigan launched a virtual muscle and joint program with Hinge Health, offering eligible members 12 no-cost physical therapy visits per year. The benefit design encourages earlier engagement in MSK rehabilitation and accelerates payer acceptance of virtual-first pathways that can steer volume toward hybrid outpatient networks.
Outpatient Rehabilitation Centers Market Report Scope and Research Methodology
Market Definition and Coverage
For this study, the market covers paid rehabilitation services delivered in outpatient settings, where patients return home the same day and care is provided through scheduled therapy visits and structured programs.
Scope exclusions: Inpatient rehab hospitals, long-term residential rehab, and informal home-based caregiving that is not billed as outpatient rehabilitation services are excluded.
Segments Covered in This Report
- By Program
- Standard Outpatient Programs
- Intensive Outpatient Programs (IOP)
- Partial Hospitalisation Programs (PHP)
- Hybrid Tele-Outpatient Programs
- Specialised Day Rehabilitation (Neuro, Cardiac, Ortho)
- By Therapy
- Physical Therapy
- Occupational Therapy
- Speech & Language Therapy
- Cognitive Behavioural Therapy (CBT)
- Contingency Management (CM)
- Motivational Interviewing (MI)
- Virtual-Reality-Assisted Therapy
- Aquatic / Ocean Therapy
- By Condition Treated
- Musculoskeletal Rehabilitation
- Neurological Rehabilitation
- Cardiac Rehabilitation
- Pulmonary Rehabilitation
- Substance-Use-Disorder Rehabilitation
- Others (Burn, Oncology, etc.)
- By End User
- Paediatric Population
- Adult Population
- Geriatric Population
- Sports-Injury Patients
- Workers’ Compensation Cases
- By Geography
- North America
- United States
- Canada
- Mexico
- Europe
- Germany
- United Kingdom
- France
- Italy
- Spain
- Rest of Europe
- Asia-Pacific
- China
- Japan
- India
- Australia
- South Korea
- Rest of Asia-Pacific
- Middle East and Africa
- GCC
- South Africa
- Rest of Middle East and Africa
- South America
- Brazil
- Argentina
- Rest of South America
- North America
Data Sources, Market Sizing, and Validation
Desk Research
Desk work was used to map how outpatient rehab demand is created and how it is paid for before any numbers were modeled. We relied on public sources such as the US CDC (chronic condition burden), CMS Medicare payment and utilization materials, OECD health statistics for service use signals, and the World Bank for macro indicators that influence healthcare spend.
To keep the scope realistic, we also reviewed sources such as national health ministries and regulators, plus peer reviewed clinical and health-economics literature (to understand care pathways and visit intensity). We supplemented this with reputable press and investor materials that describe clinic footprints and service mix. In addition, we used paid databases for company financials and intelligence, relevant news and financials, and patent databases to spot shifts in therapy delivery that can change visit volumes and price points over time. These sources are illustrative only, and they are not exhaustive because many other public documents and datasets were also referred to for data collection, validation, and research clarification.
Primary Interviews and Surveys
Primary calls and surveys were conducted with a mix of clinic operators, therapy department leaders, referral-side stakeholders, and payor-facing experts. This helped check assumptions where public data is thin, especially around how visits are scheduled and how reimbursement changes flow through to clinic pricing.
For a global market, we covered the major regions and used respondents to confirm visit frequency patterns, staffing constraints, payer coverage behavior, and pricing changes that typically follow billing updates and care-setting shifts.
Distribution of primary research fieldwork respondents
| Company type | Respondent position | Region |
|---|---|---|
| Top tier: 27% | CXOs: 20% | APAC: 43% |
| Mid tier: 52% | Functional/Unit leaders: 22% | EMEA: 30% |
| Smaller Players: 21% | Managers: 58% | Americas: 27% |
Market-Sizing & Forecasting
The core sizing logic uses a top-down and bottom-up flow. We use healthcare spending and service-utilization indicators to reconstruct the outpatient rehabilitation demand pool by geography, then filter it through outpatient share and paid-visit intensity.
We corroborated the result using selective bottom-up approximations such as sampled clinic revenue run-rates, therapist headcount capacity assumptions, and ASP times estimated visit volumes. We then adjusted the model when gaps looked structural rather than data noise.
Key inputs that were tracked include outpatient program mix (standard outpatient versus intensive outpatient and partial hospitalization where relevant), therapy modality mix (for example physical, occupational, and speech therapy), condition mix (musculoskeletal and neurological signals tend to steer volumes), payer reimbursement direction (especially public payer rule changes), and average visits per episode of care. Since price and volume do not move in lockstep every year, scenario analysis was used to forecast, with base case trends shaped by expert expectations on referral flows, staffing availability, and reimbursement sensitivity. Where bottom-up checks could not cover smaller clinics consistently, we used region-level penetration and capacity proxies and then stress-tested these assumptions in validation rounds.
Data Validation & Update Cycle
Outputs were validated through multiple passes. We started with checks on year-over-year movement, regional share sanity checks, and whether implied revenue per visit stayed within realistic bounds.
We then compared totals against independent demand signals such as therapy workforce direction, public payer utilization notes, and reported service expansion patterns. Any anomalies were investigated before sign-off.
If a material variance appeared, we re-contacted relevant respondents to confirm whether it came from pricing, coding, payer rules, or a short-term utilization swing. Reports are refreshed annually, and interim updates are made when major reimbursement or policy changes, care-setting shifts, or visible consolidation events can meaningfully move the outlook. Before delivery, an analyst performs a final review so clients receive the latest updated view.
Mordor Intelligence's Outpatient Rehabilitation Centers Market Sizing Compared With Other Published Estimates
Published market sizes for outpatient rehabilitation centers can look far apart, even when the topic sounds the same, because the service scope can be stretched in different directions. Differences usually come from which care settings are counted, which payer flows are assumed to be included, and how fast ASP and visit volumes are allowed to grow.
The key gap drivers in this market are usually about setting definitions and billing-linked revenue capture. Some estimates mix outpatient rehab centers with broader therapy services delivered through hospital outpatient departments or home health, and then apply price growth that is not consistently tied back to reimbursement changes in each region. Currency timing also matters, since multi-country totals can shift based on the exchange-rate year used and whether the model is refreshed after major payer code updates.
Benchmark comparison
| Source | Market Size | Gaps in Research Methodology |
|---|---|---|
| Mordor Intelligence | USD 110.59 B (2026) | |
| Global Consultancy A | USD 142.30 B (2026) | This figure appears to fold in broader outpatient therapy services beyond dedicated outpatient rehabilitation centers, and it can also include hospital outpatient departments, which expands the counted care settings and lifts totals. |
| Industry Association B | USD 98.40 B (2026) | This estimate looks more conservative because it likely tracks a narrower set of reimbursed categories and may undercount private-pay and employer-sponsored MSK program volumes, which are less consistently visible in public datasets. |
The table shows a wide spread for the same year, and under Mordor Intelligence's scope the value is counted only when services are delivered in outpatient rehabilitation center settings rather than being blended with outpatient therapy delivered in other settings. By anchoring totals to visit intensity, payer-linked pricing signals, and repeatable regional adjustments, we keep the result traceable and easier to reconcile when clients test assumptions.
Key Questions Answered in the Report
What is the current size of the outpatient rehabilitation centers market?
The outpatient rehabilitation centers market stands at USD 110.59 billion in 2026.
How fast is the market expected to grow?
The market is forecast to expand at a 7.23% CAGR, reaching USD 156.74 billion by 2031.
Which program segment is growing the quickest?
Hybrid tele-outpatient programs are posting the highest growth, with a projected 10.32% CAGR through 2031.
Why is VR-assisted therapy gaining traction?
VR-assisted therapy delivers immersive, data-rich sessions that improve functional outcomes and patient engagement, fueling an 11.05% CAGR.
Which region offers the strongest growth opportunity?
Asia-Pacific is expected to grow the fastest at 9.62% CAGR thanks to healthcare modernization and supportive AI initiatives.