
Outdoor Solar LED Market Size and Share
Market Overview
| Study Period | 2020 - 2031 |
|---|---|
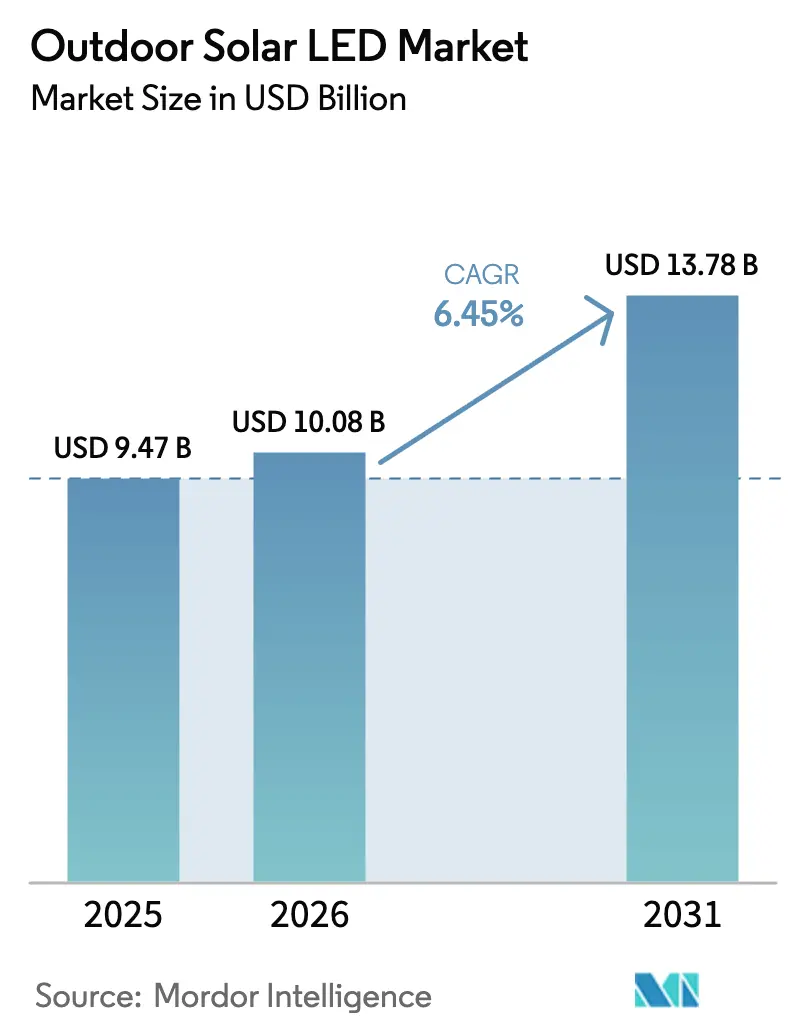
| Market Size (2026) | USD 10.08 Billion |
| Market Size (2031) | USD 13.78 Billion |
| Growth Rate (2026 - 2031) | 6.45 % |
| Fastest Growing Market | Africa |
| Largest Market | Asia |
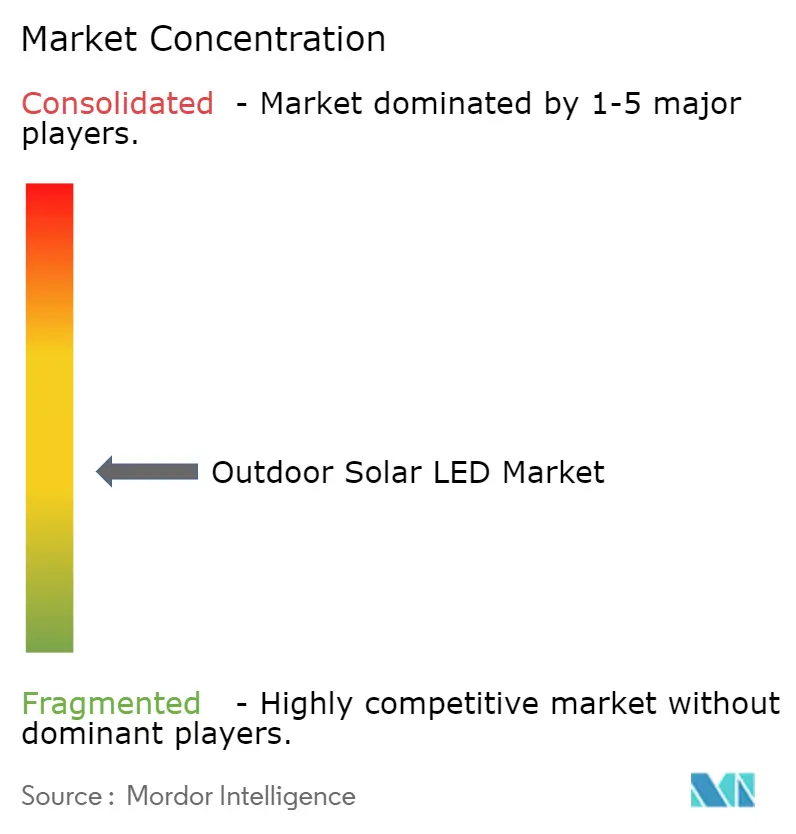
| Market Concentration | Medium |
Major Players *Disclaimer: Major Players sorted in no particular order Image © Mordor Intelligence. Reuse requires attribution under CC BY 4.0. | |
Outdoor Solar LED Market Analysis by Mordor Intelligence
Outdoor solar LED market size in 2026 is estimated at USD 10.08 billion, growing from 2025 value of USD 9.47 billion with 2031 projections showing USD 13.78 billion, growing at 6.45% CAGR over 2026-2031. Regulators are tightening light-pollution rules, battery prices are falling, and governments are funding rural electrification, all of which reinforce a shift from grid-tied to autonomous lighting. Asia commands demand through large-scale public projects, while Africa supplies the strongest growth momentum as multilateral lenders back distributed solar. High-wattage fixtures are now viable in colder climates because lithium iron phosphate (LiFePO₄) pack costs keep dropping and hybrid charging reduces winter downtime. Established suppliers respond by localizing assembly and embedding smart controls, whereas regional specialists exploit local-content rules. Against these drivers stand battery theft, thermal-management limits above 150 W, and financing gaps for mid-sized commercial campuses, challenges that could slow adoption in specific use cases.
Key Report Takeaways
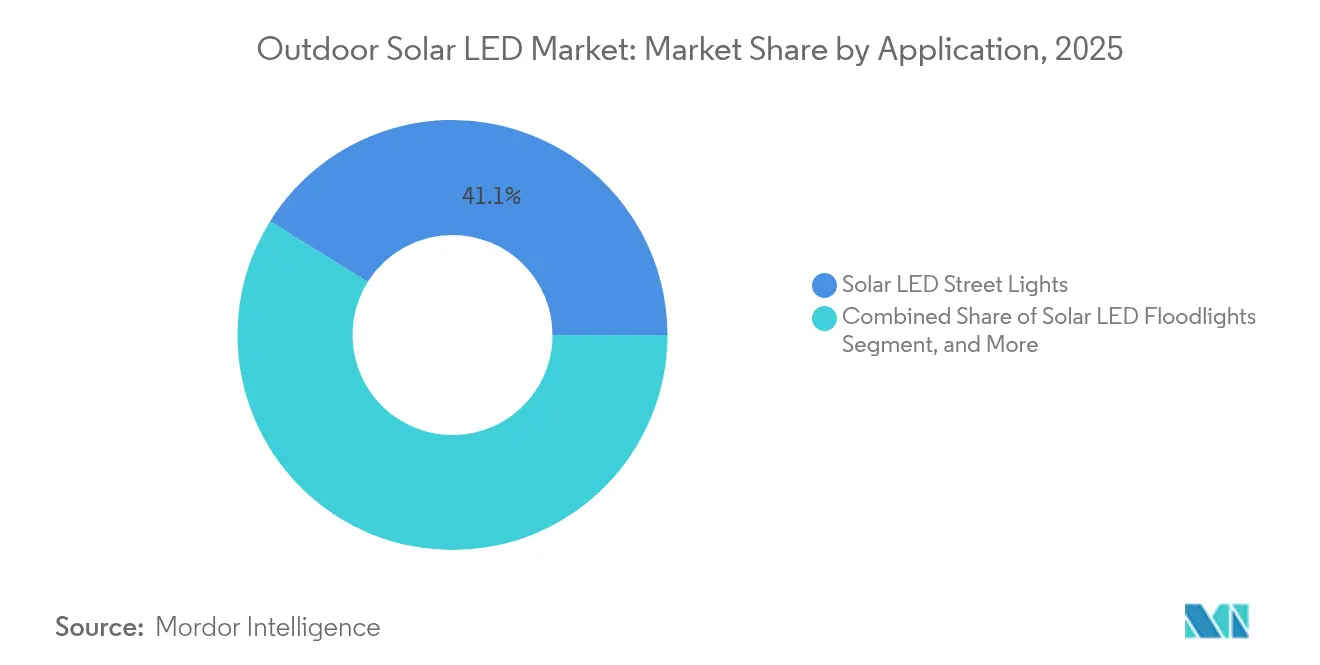
- By application, street lights held 41.12% Outdoor solar LED market share in 2025; floodlights are projected to advance at an 8.32% CAGR to 2031.
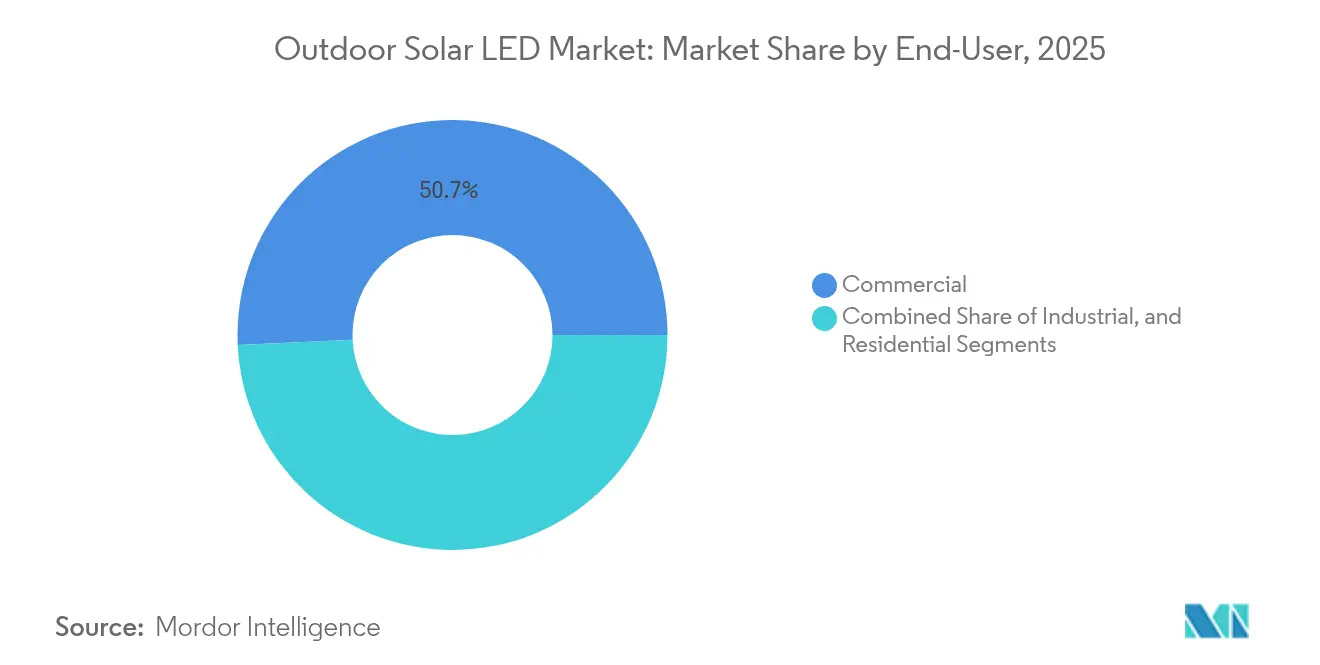
- By end-user, commercial installations accounted for 50.74% of the Outdoor solar LED market size in 2025, while industrial sites are set to grow at 6.94% CAGR through 2031.
- By wattage, 40 W-149 W fixtures captured 46.05% Outdoor solar LED market share in 2025; ≥150 W units are expected to expand at a 7.55% CAGR to 2031.
- By component, luminaires led with 34.22% of the Outdoor solar LED market size in 2025; battery packs exhibit the fastest 8.14% CAGR to 2031.
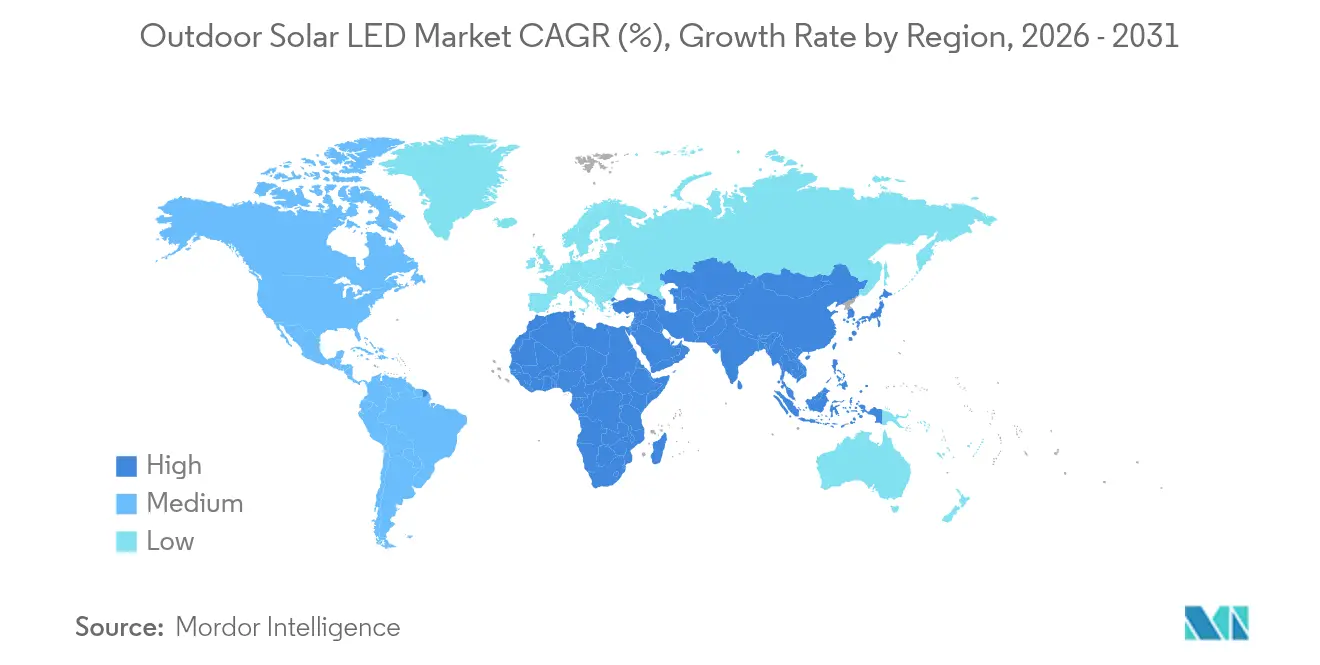
- By geography, Asia commanded 44.75% Outdoor solar LED market share in 2025, whereas Africa is forecast to grow at 7.2% CAGR between 2026 and 2031.
Note: Market size and forecast figures in this report are generated using Mordor Intelligence’s proprietary estimation framework, updated with the latest available data and insights as of 2026.
Market Trends and Insights
Drivers Impact Analysis of Outdoor Solar LED Market*
| Driver | (~) % Impact on CAGR Forecast | Geographic Relevance | Impact Timeline |
|---|---|---|---|
| Solar-LED road-illumination mandates | +1.2% | Sub-Saharan Africa, spill-over to MENA | Medium term (2-4 years) |
| Dark-sky retrofit regulations | +0.8% | Europe & North America | Short term (≤2 years) |
| Hybrid telecom-tower upgrades | +0.9% | South Asia, Southeast Asia | Medium term (2-4 years) |
| Rural electrification programs | +1.4% | India, Kenya, Nigeria | Long term (≥4 years) |
| Rapid LiFePO₄ price decline | +1.1% | Global | Short term (≤2 years) |
| Smart-city procurement incentives | +0.6% | Europe, East Asia | Medium term (2-4 years) |
| Source: Mordor Intelligence | |||
Mandatory Solar-LED Road-Illumination Mandates in Sub-Saharan Africa
Governments confronting energy poverty now specify solar LEDs in road contracts, creating predictable demand that encourages local assembly plants. The World Bank’s USD 35 billion electrification drive recognizes solar as faster and cheaper than extending grids, while private suppliers in Niger already sell quality modules below USD 75, confirming affordability thresholds.[1]“A $35 Billion Loan Project, Led by World Bank, Aims to Expand Electricity in Africa,” The New York Times, nytimes.com
Dark-Sky Regulations Fueling Municipal Retrofits in Europe and North America
Statutes such as Maine’s LD 1934 cap brightness and color temperature, forcing municipalities to swap high-pressure sodium units for compliant solar LEDs that natively meet downward-facing and lumen limits. Early adopters like Groveland, Florida, budget six-figure sums for phased retrofits, anchoring a replacement cycle that favors off-grid systems with built-in controls.[2]“City looks to the stars for lighting policy,” Congress for the New Urbanism, cnu.org
Hybrid Telecom-Tower Upgrades Adopting Solar LEDs in South Asia
Tower owners reduce diesel costs and improve perimeter security by bundling lighting with renewable micro-grids. India’s village-level 8 kW systems run flawlessly through outages, proving technical viability, while policy schemes such as PM-KUSUM unlock capex for rural operations.
Rural Electrification Programs Accelerating Off-Grid Street Lighting
Community solar now reaches three times more people than in 2010, as subsidies absorb upfront costs and monthly tariffs fund maintenance. India’s Aspirational Districts and Kenya’s county schemes favor solar LED street lights that deliver immediate, reliable illumination when grid build-out would take decades.
Restraints Impact Analysis of Outdoor Solar LED Market*
| Restraint | (~) % Impact on CAGR Forecast | Geographic Relevance | Impact Timeline |
|---|---|---|---|
| Battery theft and vandalism | -0.7% | Sub-Saharan Africa, Latin America, South Asia | Short term (≤2 years) |
| High O&M costs in low-irradiance cities | -0.5% | Northern Europe, Canada, Alaska | Medium term (2-4 years) |
| Limited campus-scale financing | -0.4% | Global emerging markets | Long term (≥4 years) |
| Thermal challenges above 150 W | -0.3% | Hot-climate regions | Medium term (2-4 years) |
| Source: Mordor Intelligence | |||
Battery Theft and Vandalism Risk in Developing Regions
Municipalities that adopted solar to stop copper wire theft now face new risks as thieves target Li-ion packs. Los Angeles spends USD 20 million yearly on cable repairs, prompting a 900-unit solar rollout, yet tamper-proof housings and alarms raise capex for off-grid systems, particularly in Sub-Saharan Africa where resale incentives remain high.[3]“Residents Are Fed Up With Copper Theft Shutting Off Street Lights,” LAist, laist.com
High O&M Costs in High-Latitude, Low-Irradiance Cities
Seasonal darkness cuts energy harvest, forcing larger batteries and frequent maintenance. Canada’s CAD 300 million Arctic program underscores cost pressures, while bifacial panels and vertical mounts improve yield yet add engineering complexity that stretches payback periods north of 60° latitude.[4]“Potentiality of solar energy in the Arctic,” University of Oulu, oulu.fi
*Our forecasts treat driver/restraint impacts as directional, not additive. The impact forecasts reflect baseline growth, mix effects, and variable interactions.
Outdoor Solar LED Market Segment Analysis
By Application:
Street Lights Anchor Municipal AdoptionStreet lights contributed USD 3.89 billion to the Outdoor solar LED market size in 2025 and retained 41.12% share as cities favored proven procurement templates. Municipal buyers cite 3-year payback periods and improved citizen safety, illustrated by Seville’s 20 SunStay units delivering 3,000 lumens at 175 lm/W. Solar LED floodlights gained traction in industrial yards and stadiums, growing at 8.32% CAGR as insurers demand better night-time surveillance.
Evolving priorities trigger convergence across lighting forms. Fonroche’s 67,000-unit Senegal project guarantees 365-night autonomy, validating reliability for large public rolls-outs. Campus managers now blend street, area, and garden fixtures inside a single control platform that dims during low-traffic hours, widening use cases without ballooning O&M costs. As dark-sky rules proliferate, downward-directed floodlights gain an edge, and policy-driven retrofits sustain volume while adding smart features.


By Wattage:
Mid-Range Dominates, High-Power AcceleratesFixtures rated 40 W-149 W represented USD 4.36 billion and 46.05% Outdoor solar LED market share in 2025, balancing brightness with panel size and battery depth. They light most collector roads and retail lots, and standardization keeps installation costs predictable. Units exceeding 150 W are forecast to climb 7.55% CAGR as LiFePO₄ packs hit cost thresholds that bring high-mast ports and freight yards into scope.
Cree’s XFL10K diode provides 20,000 lumens with longer throw distance, cutting pole counts and civil works. Heat-sink advances and graphite composites alleviate thermal stress, especially in Gulf Coast and equatorial sites. Sub-39 W devices stay niche in decorative landscapes because limited lumen output restricts commercial uptake, yet smart-home ecosystems could unlock incremental demand as prices fall.
By End-User:
Commercial Leadership, Industrial MomentumCommercial establishments generated USD 4.81 billion, or 50.74% of the Outdoor solar LED market size in 2025, owing to parking-lot retrofits, wayfinding upgrades, and tenant-driven ESG targets. Financing tools such as power-purchase agreements match lease lengths, easing capex hurdles for malls and universities. Industrial users embrace solar to avoid downtime; manufacturing sites post a 6.94% CAGR outlook through 2031 as they secure perimeter zones and loading docks during grid failures.
Developers weave lighting into amenity packages. D.R. Horton integrates solar poles in new communities, raising property values and meeting municipal sustainability codes. Industrial complexes pursue micro-grid resilience strategies that pair rooftop PV with yard lighting, shrinking diesel backup use and trimming scope-2 emissions.
By Component:
Luminaires Lead, Batteries AccelerateLuminaires accounted for 34.22% revenue in 2025 as optics, color rendering, and housing design define end-user perception. On-chip solar cells now exceed 25.79% conversion on test wafers, hinting at future integration that could shrink panel footprints.
Battery packs grow 8.14% CAGR, reflecting scale economies in LiFePO₄ and rising demand for multi-day autonomy. AI-driven controllers dynamically trim output, extending life cycles while supporting IoT sensors that feed asset-management dashboards. Panels, poles, and mounting systems follow price-curve declines, yet innovations such as tilt-adjustable brackets and integrated 5G antennas enrich value propositions beyond mere illumination.
Geography Analysis
APAC Outdoor Solar LED Market
Asia delivered 44.75% of global revenue in 2025 due to deep supply chains, government subsidies, and massive grid-extension gaps still best solved through off-grid lighting. China anchors module exports, while India’s National Solar Mission sponsors village micro-grids that combine telecom, household, and street-light loads into single service packages. Japan’s 20 GW perovskite roadmap signals regional R&D leadership that could lower panel weight and broaden rooftop sites. Southeast Asian tower retrofits amplify orders for hybrid lighting kits that share battery strings with radio equipment, improving logistics efficiency.
Africa Outdoor Solar LED Market
Africa stands out with a projected 7.2% CAGR through 2031, underpinned by the World Bank loan program and private leasing models targeting 600 million people still without evening light. Niger’s retail boom in sub-USD 100 panels proves that affordability has crossed consumer thresholds, while Senegal’s record-scale street-light rollout shows how national mandates translate to immediate orders. Emerging assembly plants in Egypt and Kenya add local-content advantages that speed tenders.
Middle East, North America and Europe Outdoor Solar LED Market
The Middle East tripled solar generation in five years as oil exporters diversify. Saudi Arabia targets 58 GW of PV by 2030, and regional LED factories now top 3 GW yearly output, lowering landed costs and shortening lead times. Harsh summer temperatures spur demand for high-thermal-tolerance luminaires and smart cooling. North America and Europe focus on replacement rather than greenfield installations, yet dark-sky ordinances, copper-theft countermeasures, and tax-credit transfers keep budgets flowing, sustaining steady mid-single-digit growth.

Regulatory Landscape
Outdoor solar LED products are increasingly subject to tighter efficiency and conformity requirements that affect tender eligibility and product design. In China, new mandatory energy-efficiency requirements for LED road and tunnel luminaires (GB 37478-2025) took effect on June 1, 2026 for new and imported products, and GB/T 31832-2025 was implemented on February 1, 2026, raising the bar for labeled performance and compliance documentation for public works and large projects.
Outside China, building and electrical codes shape system architecture, particularly around PV wiring, disconnects, and installed-system acceptance. In the European Union, the revised Energy Performance of Buildings Directive (EPBD) requires member states to transpose measures by May 29, 2026, with building-level deadlines starting December 31, 2026, while CE marking continues to govern product placement. In India, BIS issued IS 10322 (Part 1):2026 for LED luminaires, and existing licensees are required to implement the revised standard by August 2, 2026, pushing suppliers toward updated testing, labeling, and certification alignment for luminaires sold into municipal and institutional procurement.
Value Chain Analysis
The outdoor solar LED value chain begins with system design and specification, covering photometrics, autonomy targets, thermal management, and control logic. This is followed by component sourcing for luminaires, including LED packages, optics, and drivers or housings, plus solar panels, battery packs (including LiFePO4), and charge-controller and sensor units. Inputs then move into assembly models spanning fully integrated manufacturing, SKD/CKD assembly, and kitting, before distribution through national wholesalers, EPCs, and municipal procurement channels, with aftersales services such as commissioning, battery replacement, firmware or control tuning, and O&M contracts.
The market structure is also shifting toward localization and compliance-driven sourcing, with more tenders favoring in-country value addition and documented standards adherence. In Africa, Abia State in Nigeria has been working with investors on a USD 145 million solar manufacturing plant proposal, aimed at reducing import and foreign-exchange exposure while building local technical capacity. On the demand side, multi-year maintenance requirements in public and agency procurements shift more value downstream into service networks and spares logistics, increasing the importance of installer capability, warranty administration, and secure hardware choices to address theft and vandalism risks.
Competitive Landscape
Incumbents such as Signify, Hubbell, and Cree retain leadership by combining optical engineering, grid-hybrid firmware, and multi-country service networks. Signify’s hybrid charging expands viability in Scandinavia and Alaska, while its 60%-owned Egyptian joint venture satisfies local-content clauses in public bids across MENA. Hubbell reports that 65% of 2024 sales link to renewable applications, signalling a pivot toward full-solution energy resilience packages.
Regional specialists differentiate through financing and climate-specific engineering. Ambient Photonics supplies ultra-low-light indoor cells that can power motion sensors inside covered transit hubs, unlocking cross-selling with outdoor luminaires for unified platforms. Fonroche and Sunna Design scale rapidly in francophone Africa thanks to concessional export guarantees. Chinese OEMs leverage vertical integration to undercut prices yet now face tariffs in North America and stricter quality audits in Europe.
The financing landscape is changing as tax-credit marketplaces enable real-estate investment trusts to monetize solar attributes without direct ownership. Black Bear Energy’s 2025 deal transfers investment credits to institutional buyers, injecting liquidity into campus-scale lighting retrofits. Technology roadmaps emphasise AI-augmented control nodes, battery health monitoring, and edge-based occupancy sensing, features that raise switching barriers and tie customers into long-term service contracts.
Outdoor Solar LED Industry Leaders
CREE Lighting
Gamasonic
Hubbell Outdoor
Ligman Lighting
Sokoyo Solar Lighting Co. Ltd.
- *Disclaimer: Major Players sorted in no particular order
Outdoor Solar LED Market Companies Covered in this Report
- Signify Holding
- Hubbell Outdoor Lighting
- Sokoyo Solar Lighting Co. Ltd
- Sunna Design SA
- Greenshine New Energy
- CREE Lighting
- Gamasonic
- Ligman Lighting
- Jiawei Renewable Energy
- LEADSUN
- OkSolar
- SBM-SolarTech
- SEPCO Solar Electric Power Company
- Solar Street Lights USA
- Acuity Brands (Holophane)
- Fonroche Lighting
- Sol Inc. (Carmanah Technologies)
- SolarOne Solutions
- Evluma
- ELEDLIGHTS

Market Opportunities and Future Outlook
Near-term whitespace is concentrated where compliance changes, public funding, and service-linked procurement overlap. The 2026 implementation timeline for updated standards and energy-labeling regimes, including China making GB 37478-2025 mandatory from June 1, 2026 and India moving to BIS IS 10322 (Part 1):2026 with an August 2, 2026 implementation deadline for existing licensees, creates an opportunity for suppliers that can document performance quickly and support customers with certification packs for tenders and import pathways. On product strategy, higher-wattage outdoor systems and smart-control bundles fit where theft mitigation and uptime requirements are explicit in municipal and campus RFPs, supporting tamper-resistant battery enclosures, remote monitoring, and service-ready modular designs.
Opportunities also appear in emerging-market deployment models that link distributed power and lighting. In India, CREDA awarding Lords Mark Industries a solar home lighting systems contract that includes a five-year maintenance scope highlights how agencies bundle products with long-term O&M, a structure that can extend into outdoor lighting estates through standardized service models. In Africa, WeLight progressing a USD 650 million investment to expand solar mini-grid operations into Nigeria and the Democratic Republic of Congo points to adjacent infrastructure buildouts where perimeter and public-area lighting becomes an add-on for operators and local authorities, supporting cross-selling of solar LED street and area lights into mini-grid and community electrification footprints.
Recent Industry Developments in Outdoor Solar LED Market
- April 2026: Govee launched the Govee Outdoor Solar String Lights featuring proprietary LuminBlend technology, a 6W solar panel, and IP67-rated durability, priced at $99.99. The product launch in outdoor solar string lights expands Govee's consumer oriented solar portfolio. It taps into residential demand for integrated solar lighting solutions.
- April 2026: Hausolar announced the launch of a new series of all-in-one solar street lights using 100% Grade A LiFePO4 batteries designed for high-temperature municipal projects in Africa. The release strengthens Hausolar's municipal grade offering and battery technology stack. It supports operation in high-temperature environments and local market expansion.
- February 2026: Cree Lighting signed a long-term contract manufacturing agreement with a U.S.-based lighting manufacturer to address capacity constraints and delivery performance. The arrangement secures supply for industrial and harsh environment outdoor luminaires. It could affect cost structure and delivery reliability across the outdoor solar LED supply chain.


Outdoor Solar LED Market Report Scope and Research Methodology
Market Definition and Coverage
For this methodology, the outdoor solar LED market covers revenue from completed outdoor lighting fixtures that use a solar panel, battery, and LED light source to provide illumination in open-air settings.
Scope exclusions: We exclude indoor solar lamps, solar panels sold as standalone components, and conventional outdoor LED fixtures that do not include an integrated solar power system.
Segments Covered in This Report
- By Application
- Solar LED Street Lights
- Solar Garden LED Lights
- Solar LED Floodlights
- Solar LED Area Lights
- Solar LED Spot Lights
- By Wattage
- Less than 39 W
- 40 W - 149 W
- Above 150 W
- By End-User Industry
- Residential
- Commercial
- Industrial
- By Component
- Luminaire (LED Module)
- Solar Panel
- Monocrystalline
- Polycrystalline
- Thin-Film
- Battery Pack
- Li-ion
- LiFePO?
- Lead-acid
- Charge Controller and Smart Sensor Unit
- Pole and Mounting Structure
- By Geography
- North America
- United States
- Canada
- Mexico
- Europe
- Germany
- United Kingdom
- France
- Nordics
- Rest of Europe
- South America
- Brazil
- Rest of South America
- Asia-Pacific
- China
- Japan
- India
- South-East Asia
- Rest of Asia-Pacific
- Middle East and Africa
- Middle East
- Gulf Cooperation Council Countries
- Turkey
- Rest of Middle East
- Africa
- South Africa
- Rest of Africa
- Middle East
- North America
Data Sources, Market Sizing, and Validation
Desk Research
We first built the market map using public, non-paywalled sources that explain where outdoor lighting demand is coming from and how it is being funded. Common inputs include government energy and efficiency publications (such as the US Department of Energy), international energy statistics (such as IEA), customs and trade releases for lighting products, and standards or guidance from lighting bodies (such as IES) along with solar industry references (such as IRENA).
To convert these signals into a workable sizing structure, we also reviewed company filings, investor presentations, tender announcements, and credible press coverage on municipal projects and off-grid electrification programs. In parallel, selective paid subscriptions were used only for company financials and intelligence, patent database checks, and shipment-level import-export context where it helped validate directionally. This desk list is illustrative, and many other references were used to collect data, cross-check assumptions, and clarify open questions.
Primary Interviews and Surveys
Primary work was used to pressure-test what desk research cannot show clearly, such as typical pricing bands by wattage, replacement versus new-install shares, and how battery chemistry choices affect product life and servicing. We spoke with executives, product and sales leaders, and operational managers across key buying pools such as municipalities, commercial campuses, contractors, and distributors in major regions so the assumptions reflect real procurement behavior.
Distribution of primary research fieldwork respondents
| Company type | Respondent position | Region |
|---|---|---|
| Top tier: 27% | CXOs: 22% | APAC: 48% |
| Mid tier: 51% | Functional/Unit leaders: 24% | EMEA: 30% |
| Smaller Players: 22% | Managers: 54% | Americas: 22% |
Market-Sizing & Forecasting
Sizing starts with a top-down reconstruction of the addressable outdoor lighting demand pool, and then we filter it through solar adoption drivers that are visible in public programs and buyer behavior. The model uses indicators such as urban infrastructure spending for streets and public areas, rural and peri-urban electrification activity, solar module and battery pack price direction, typical wattage mix for roadway versus area lighting, and regional tender intensity.
Those totals are then checked with selective bottom-up approximations, where we use sampled price points and shipment proxies to ensure the implied volumes look realistic. Where direct datapoints are thin (for example, smaller private projects), gaps are handled by using channel checks and applying conservative penetration ranges that were validated in calls. For forecasting, we rely on scenario analysis supported by a simple multivariate view of the most repeatable drivers, and we align the ranges with what interviewees expect on policy funding, replacement cycles, and component cost trends.
Data Validation & Update Cycle
Outputs are validated in steps so large swings are explained before the numbers are finalized. We compare results against independent signals like tender pipelines, trade movement direction, and company revenue exposure to solar lighting, and then anomalies are reviewed and corrected through assumption tuning.
Before sign-off, an additional analyst review is done to recheck math, currency handling, and regional splits, and follow-up calls are triggered when a key assumption moves outside the expected band. Reports refresh annually, with interim updates for material events, and a final pre-delivery pass is performed so clients receive the latest updated view.
Mordor Intelligence's Outdoor Solar Led Market Size Versus Other Published Estimates
Published market values for outdoor solar LED often differ because the product boundary is not treated the same way, and because some studies assume faster price and adoption changes than what buyers actually report. Timing choices also matter, since a 2025 base and a 2026 base can look like a real gap even when the underlying trend is similar.
The main gap drivers usually come from whether the estimate counts only complete solar lighting fixtures, or also pulls in adjacent spend like standalone solar panels, controllers, or installation services. Another common difference is the way average selling price is moved forward, where some methods keep pricing flat while others assume sharp declines from battery and module cost drops. Refresh cadence and currency conversion timing can further widen the spread, especially when tenders accelerate in one region for a short period, which is why the fixture-only treatment and a 2026 demand cross-check were kept explicit, a modeling choice applied by Mordor Intelligence.
Benchmark comparison
| Source | Market Size | Gaps in Research Methodology |
|---|---|---|
| Mordor Intelligence | USD 10.08 B (2026) | |
| Industry Report Publisher A | USD 7.74 B (2025) | Uses an earlier base year and appears to emphasize end-user rollout assumptions that push faster near-term adoption, which can understate 2026 value when price and volume shifts are not reconciled year to year. |
| Industry Report Publisher B | USD 7.60 B (2025) | Uses a 2025 base and a longer horizon with a higher growth curve, and the scope language suggests broader product groupings that may mix decorative solar lights with wider outdoor solar lighting spend, changing what is counted as core market revenue. |
Across the three figures, the spread is explained mostly by base-year choice, what is treated as a fixture versus adjacent spend, and how ASP movement is carried into the forecast. By tying the 2026 number to observable demand signals and checking it against pricing and mix inputs from interviews, the estimate stays traceable to clear variables and repeatable steps.


Key Questions Answered in the Report
What is the current size of the Outdoor solar LED market?
The market stands at USD 10.08 billion in 2026 and is projected to reach USD 13.78 billion by 2031.
Which application contributes the largest revenue?
Solar LED street lights dominate with 41.12% market share in 2025 because municipalities favor their proven return-on-investment models.
Why is Africa considered the fastest-growing region?
Multilateral loans and government mandates addressing electricity access for 600 million people drive a 7.2% CAGR forecast for 2026-2031.
How are falling LiFePO₄ battery prices influencing adoption?
Lower battery costs now make ≥150 W fixtures economical, extending solar lighting to industrial yards and high-latitude cities.
What are the main obstacles to wider deployment?
Battery theft, high maintenance costs in low-irradiance zones, limited financing for mid-sized campuses, and thermal constraints above 150 W remain key restraints.
How competitive is the supplier landscape?
The top five vendors control just over 60% of global revenue, with regional specialists gaining share through local-content rules and financing innovation.
Page last updated on:


 Your data is secure and never sold or shared.


