
Market Overview
| Study Period | 2020 - 2031 |
|---|---|
| Forecast Data Period | 2026 - 2031 |
| Base Year Market Size (2025) | USD 6.98 Billion |
| Market Size (2026) | USD 7.41 Billion |
| Market Size (2031) | USD 10.03 Billion |
| Growth Rate (2026 - 2031) | 6.24% CAGR |
| Market Concentration | Medium |
Major Players *Disclaimer: Major Players sorted in no particular order Image © Mordor Intelligence. Reuse requires attribution under CC BY 4.0. | |
United States Outdoor Furniture Market Analysis by Mordor Intelligence
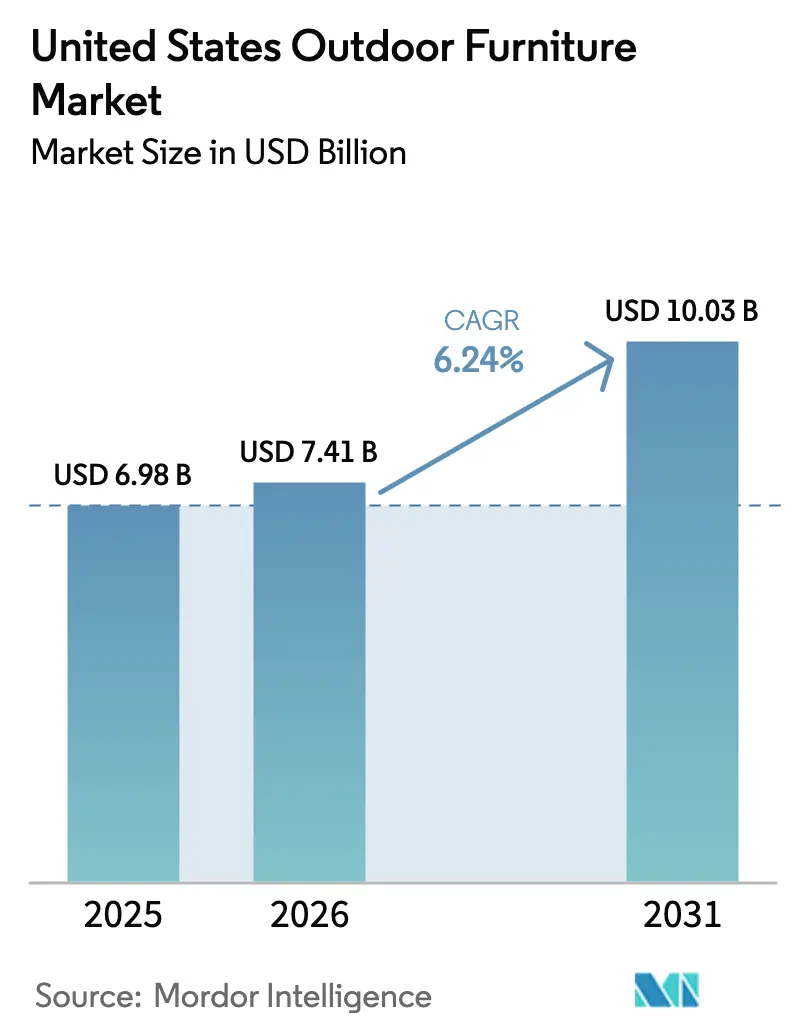
The United States outdoor furniture market size is expected to grow from USD 6.98 billion in 2025 to USD 7.41 billion in 2026 and is forecast to reach USD 10.03 billion by 2031 at 6.24% CAGR over 2026–2031. Consumer spending momentum is supported by sustained household focus on patio, porch, and backyard upgrades that convert underused areas into functional living zones. Commercial demand remains anchored by hospitality and foodservice operators that have embedded permanent outdoor seating into their layouts. Input costs and labor constraints shape pricing and delivery strategies as manufacturers balance procurement hedging with streamlined production. Digital discovery remains influential for product research and configuration, while distributors secure large project wins by solving code compliance and durability requirements for high-traffic settings.
Key Report Takeaways
- By product, chairs captured 45.74% of the United States outdoor furniture market share in 2025, while the United States outdoor furniture market size for loungers and daybeds is projected to expand at a 9.78% CAGR through 2031.
- By material, wood led with a 51.36% share in 2025, and metal recorded the fastest 8.76% CAGR through 2031, underscoring durability-led choices in the United States outdoor furniture market.
- By end user, the commercial segment held 62.37% share in 2025, while the United States outdoor furniture market size for residential applications is projected to grow at a 9.87% CAGR through 2031.
- By price range, mid-range options accounted for a 52.73% share in 2025, while the premium tier shows the highest 9.35% CAGR to 2031 within the United States outdoor furniture market.
- By distribution channel, B2B accounted for a 59.87% share in 2025, and online retail recorded the fastest 10.32% CAGR to 2031 in the United States outdoor furniture market.
- By geography, the South captured 46.34% of the United States outdoor furniture market share in 2025, while the United States outdoor furniture market size for the West is projected to grow at a 7.03% CAGR through 2031.
Note: Market size and forecast figures in this report are generated using Mordor Intelligence’s proprietary estimation framework, updated with the latest available data and insights as of January 2026.
United States Outdoor Furniture Market Trends and Insights
Drivers Impact Analysis*
| Drivers | (~) % Impact on CAGR Forecast | Geographic Relevance | Impact Timeline |
|---|---|---|---|
| Remote work-driven outdoor renovations | +1.2% | National tech-focused metros | Medium term (2-4 years) |
| Hospitality shift to expanded outdoor dining | +0.8% | Urban centers and tourist areas | Short term (≤ 2 years) |
| Eco mandates boosting certified wood and recycled plastics | +0.7% | Coastal states | Long term (≥ 4 years) |
| Sunbelt housing boom raising patio spending | +1.0% | Florida, Texas, Arizona, California | Medium term (2-4 years) |
| Smart-enabled furniture with lighting and charging features | +0.5% | Affluent suburbs and cities | Medium term (2-4 years) |
| Online retail surge powered by AR visualization tools | +0.6% | Nationwide | Medium term (2-4 years) |
| Source: Mordor Intelligence | |||


Remote work-driven outdoor renovations
Remote work normalization has reshaped how households use exterior areas by making patios and porches extensions of daily life. In 2025, 59% of United States consumers indicated plans to buy new outdoor furniture, with Millennials showing the highest intent at 76%, which reinforced the role of seating and dining pieces in home-based entertaining and work-from-home routines[1]ICFANET.ORG https://www.icfanet.org/news/2025_trend_report. Consumers who upgrade outdoor spaces report spending more time relaxing and entertaining after installations, which keeps the category on replacement cycles instead of being a one-off seasonal purchase. Preferences in the South and West emphasize covered outdoor rooms, fire features, and outdoor kitchens, which support demand for both weather-resistant materials and comfort-focused upholstery. The residential segment benefits from these patterns and maintains the fastest growth outlook through 2031 as household use of outdoor assets becomes a standard part of American home life.
Hospitality shift to expanded outdoor dining
Operators in restaurants and hotels have moved temporary outdoor seating into standard operating configurations by using codified permit programs. Dining Out NYC rules set clear parameters for placement, safety, and structures, while cities like Portland have established permit types with annual fees and area-based charges that formalize year-round outdoor operations[2]PORTLAND.GOV https://www.portland.gov/transportation/permitting/business-support/outdoor-dining. Accessibility rules require clear floor space at fixed tables and compliant surface heights, which pushes operators toward commercial-grade furniture that meets ADA guidance. The industry has also advanced outdoor performance testing by consolidating standards for structural integrity and accelerated weathering through BIFMA’s OF-2025 framework. These policies and standards align with high utilization in urban and resort locations and support volume orders of durable seating, tables, and shade systems.
Eco mandates boosting certified wood and recycled plastics
Compliance requirements for composite wood products cap formaldehyde emissions at specific levels, which aligns with independent certification and responsible sourcing. California’s consumer product rules restrict volatile organic compounds in maintenance products and prohibit high global warming potential compounds for furniture care, which shapes product selection in commercial settings. Industry scorecards show a mix of leaders and laggards on wood sourcing, with a subset of retailers and brands achieving high marks and others documenting progress plans. For wood, FSC certification and audited chains of custody give buyers documentation that supports procurement policies and municipal requirements. Together, these rules and market initiatives have increased interest in recycled resin, certified solid wood, and low-emissions finishes[3]FSC.ORG https://fsc.org/en/businesses/furniture.
Sunbelt housing boom raising patio spending
New residential construction activity concentrates in the South and West, where detached homes and townhomes often include patios or covered outdoor spaces. In August 2025, the South recorded 667,000 starts on a seasonally adjusted annual basis, representing roughly half of national activity, which supports higher per-household purchases of chairs, dining sets, and integrated shade. The West also saw a rebound in single-family activity during 2025, which correlates with increased procurement of premium materials that perform in heat and sun exposure. Builders have included patios in a large share of new single-family starts in recent years, which aligns with homeowner interest in covered rooms and outdoor kitchens. These structural tailwinds maintain the South’s share leadership and support the West’s above-market growth profile.
Restraints Impact Analysis*
| Restraint | (~) % Impact on CAGR Forecast | Geographic Relevance | Impact Timeline |
|---|---|---|---|
| Lumber and aluminum price swings | -0.6% | Nationwide, heavier for domestic makers | Short term (≤ 2 years) |
| Skilled labor shortages in furniture manufacturing | -0.4% | North Carolina, Michigan, California hubs | Medium term (2-4 years) |
| Fire-safety and VOC compliance costs for cushions | -0.3% | California and aligned states | Long term (≥ 4 years) |
| Distribution hub reductions and logistic bottlenecks | -0.2% | National freight corridors | Short term (≤ 2 years) |
| Source: Mordor Intelligence | |||
Lumber and aluminum price swings
Commodity input movements have pressured margins and pricing strategies for wood and metal-based outdoor furniture. Manufacturers increased emphasis on hedging, supplier diversification, and design optimizations to manage bill-of-materials exposure in 2025. Inventory positions in furniture categories rose during 2025 as companies balanced the risk of delays with carrying cost tradeoffs, which points to cautious stock planning across the value chain. Tiered assortments and premiumization have partially offset cost inflation by differentiating performance and lifespan, while contract-grade categories use specifications to justify higher price points. These conditions encourage the use of recycled resin, aluminum alloys with favorable cost-performance profiles, and engineered wood alternatives where appropriate.
Skilled labor shortages in furniture manufacturing
Furniture producers faced ongoing hiring challenges that reduced capacity utilization in several manufacturing hubs during 2025. Employment within furniture manufacturing declined in late 2025, and firms reported difficulty recruiting upholsterers, skilled woodworkers, and CNC technicians. Wage differentials relative to other trades and the perception of limited long-term career pathways have weighed on recruitment, which has led companies to explore automation and targeted training partnerships. Industry employment statistics show notable job losses across the year, which aligns with reports of extended build and delivery times for complex products. Training investments and targeted programs are underway, yet official projections suggest modest long-term declines in certain occupations due to productivity gains.
*Our forecasts treat driver/restraint impacts as directional, not additive. The impact forecasts reflect baseline growth, mix effects, and variable interactions.
Segment Analysis
By Product: Volume Leaders Meet Fast-Growing Niches
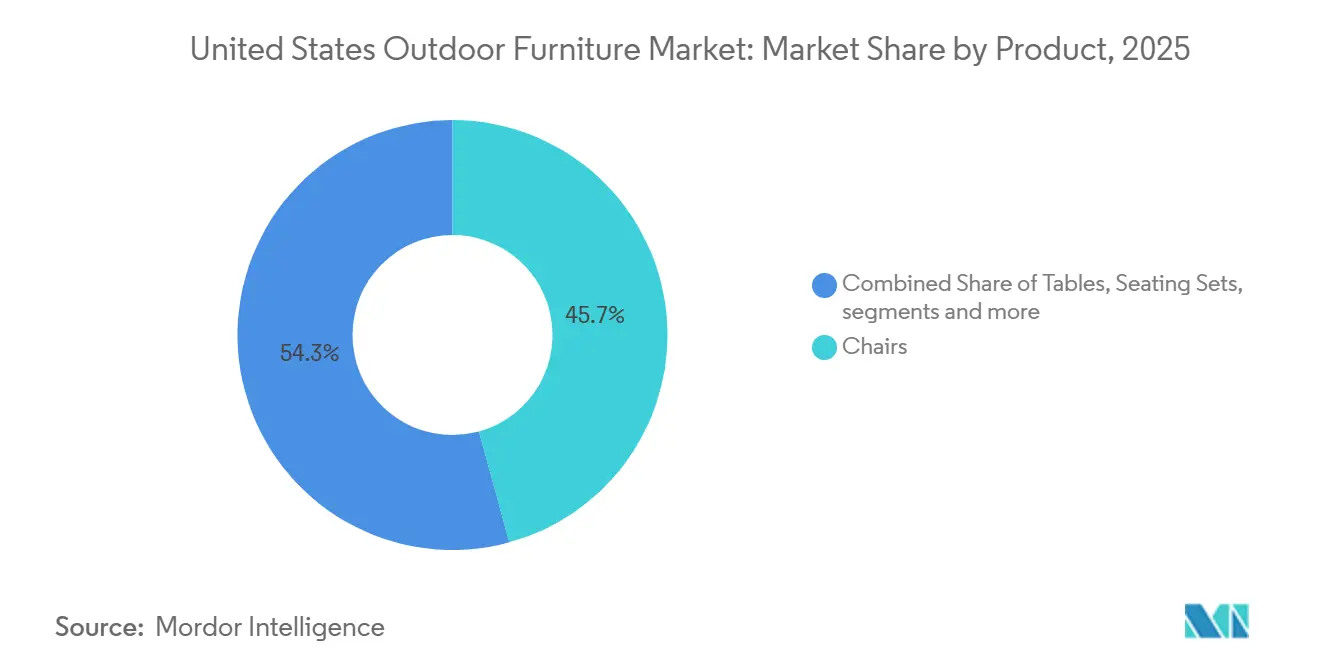
Chairs accounted for 45.74% of the United States outdoor furniture market in 2025, driven by high sales, diverse formats in dining and lounge sets, and steady replacement cycles. In 2024, lounge seating gained popularity, boosting demand for comfort-focused designs with quick-dry cushions and weather-resistant upholstery. Accessibility guidelines for public seating areas, requiring compliance with floor space and height standards, supported demand for commercial fixtures. Dining and conversation sets benefited from coordinated purchases, creating cohesive outdoor spaces for homes and restaurants. Loungers and daybeds grew at a 9.78% CAGR, reflecting consumer preferences for relaxation, poolside use, and seamless indoor-outdoor transitions.
Product preferences in the United States outdoor furniture market balance availability, durability, and aesthetics. Chairs remain essential for residential patios and commercial terraces, accommodating daily meals and large gatherings with minimal adjustments. The rise in loungers and daybeds aligns with the trend toward multifunctional outdoor spaces for leisure and social activities. Tables anchor dining and coffee areas, while modular seating sets attract coordinated-buy shoppers. Hospitality and municipal buyers sustain demand for contract-grade pieces by standardizing specifications to simplify maintenance and replacement.


By Material: Wood Dominance Meets Metal’s Momentum
Wood held a 51.36% market share in 2025, driven by natural aesthetics, repairability, and premium species like teak. Metal achieved an 8.76% CAGR due to its corrosion resistance and structural strength in the United States outdoor furniture market. While few companies excelled in responsible wood practices, leading retailers advanced certified sourcing and traceability. Salt spray and thermal cycling tests differentiate contract and residential-grade offerings. Plastics and polymers, such as recycled HDPE, dominate the economy and mid-range segments, reducing maintenance without compromising weatherability. Composite lumber suppliers emphasize recycled content and heat-mitigating innovations for hot climates.
Regulatory limits on formaldehyde emissions influence material and coating choices. Procurement policies in the West Coast and Northeast markets favor certified wood and low-VOC products. Recycled resin adoption grows as municipalities and commercial buyers align with eco-labeling and lifecycle considerations. Metals gain popularity in coastal and humid regions, with aluminum frames and powder coating offering durability and predictable maintenance. Advances in powder-coat chemistry and fastener selection address corrosion and thermal expansion. The material mix reflects practical use cases, building codes, and sustainability commitments in the United States outdoor furniture market.
By End User: Commercial Scale Meets Residential Growth
The commercial segment held a 62.37% share in the United States outdoor furniture market in 2025, driven by hospitality dining, corporate campuses, and public spaces. The residential segment is expected to grow at a 9.87% CAGR through 2031. Permanent outdoor dining programs and ADA regulations favor durable, contract-grade pieces that meet structural and weathering standards, ensuring safety and compliance. Residential buyers are investing in patios and porches for work and leisure, supported by widespread access to outdoor spaces. This dual-track demand supports both bulk procurement and consumer purchases.
Homeowners prioritize covered areas, fire features, and outdoor kitchens, increasing demand for durable tables, lounge seating, and dining sets. Commercial customers focus on maximizing seating while maintaining access routes, favoring stackable chairs, stable tables, and modular shade systems. Supply partners differentiate through specification support and installation services for multi-site rollouts. Residential buyers use digital tools and in-store visits to compare finishes, cushions, and frame materials across price tiers. These preferences shape assortments and stocking strategies in the United States outdoor furniture industry.
By Price Range: Mid-Range Volume Meets Premium Acceleration
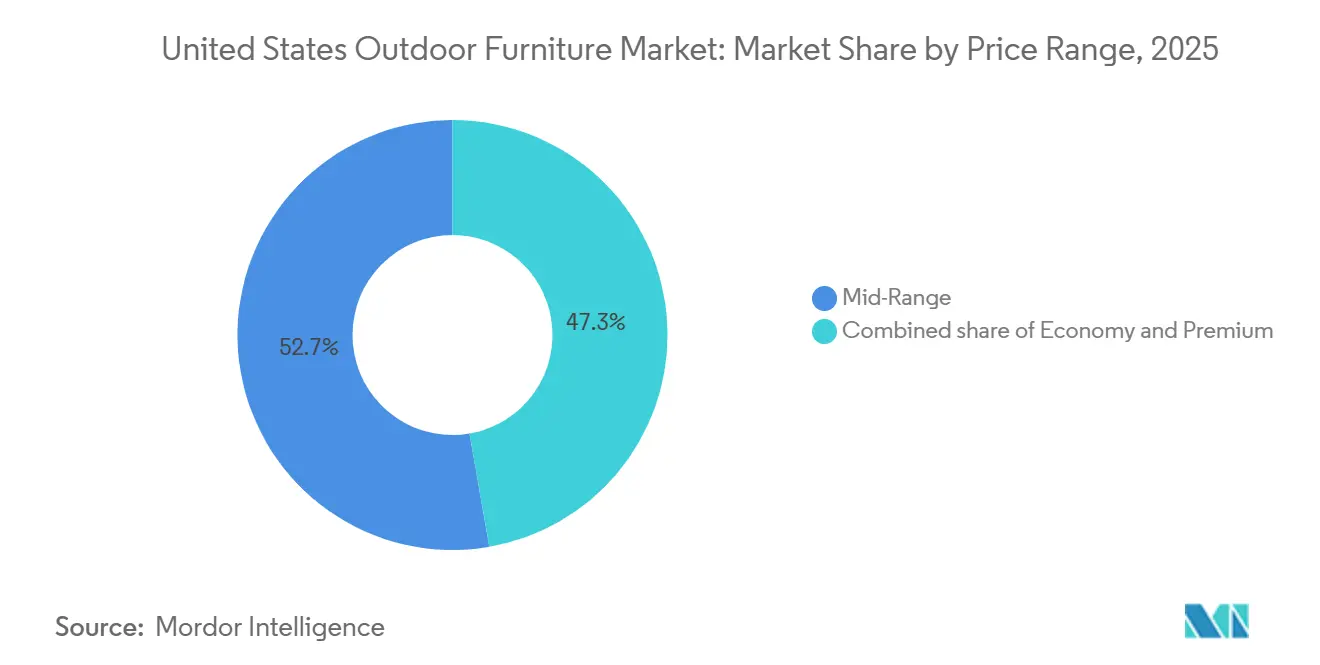
Mid-range products accounted for 52.73% of the market in 2025, driven by consumer demand for affordability and durability. Premium offerings in the United States outdoor furniture market are projected to grow at a 9.35% CAGR through 2031. Luxury collections emphasize exclusive designs, premium materials, and long warranties, attracting affluent households with higher price points and repeat purchases. Composite brands focus on recycled content and heat-diffusing technologies for sunlit environments. Consumers prioritize practicality and invest in exact-match items, stabilizing mid-range demand through coordinated sets and replacement cushions. Economy assortments remain relevant for budget-conscious buyers in rentals, second homes, and seasonal use.
Premium growth is supported by technology integrations, designer collaborations, and curated catalogs showcasing complete outdoor setups. Mid-range volumes flow through home centers, specialty retailers, and direct-to-consumer platforms, leveraging material mixes and streamlined logistics to manage price points. Premium segments differentiate through warranties and service levels, while value tiers focus on ease of assembly and availability. Retailers adjust assortments to suit regional climates and code requirements for multi-family and hospitality projects. This price segmentation enables targeted marketing and efficient inventory planning across the United States outdoor furniture market.
By Distribution Channel: B2B Scale Meets Online Disruption
B2B accounted for a 59.87% share in 2025 as distributors and contract partners outfitted hospitality sites and public spaces, while online retail posted a 10.32% CAGR to 2031 in the United States outdoor furniture market. Distribution agreements expanded geographic coverage for composite railing and decking systems, which support integrated projects that include furniture zones. Municipal and campus buyers rely on specification support and installation expertise, which bolsters the role of contract-focused channels. Retail B2C and specialty stores capture residential volume through immediate availability and curated set presentations with companion shade and fire features. Direct-to-consumer brands pair digital discovery with selected showrooms to compress delivery timelines and simplify configuration.
Omnichannel strategies bridge catalogs, e-commerce, and experience centers where buyers can assess finishes, textiles, and ergonomics. Contract teams focus on ADA compliance and ingress protection for powered elements, which drives selection toward proven SKUs in high-traffic locations. Retailers expand private-label programs at key price points, while brands refine packaging and last-mile services to reduce damages and returns. Online research behaviors influence in-store conversion through QR-guided configuration and swatch sampling. This mix of channels continues to evolve as buyers expect consistent information and reliable lead times in the United States outdoor furniture market.
Geography Analysis
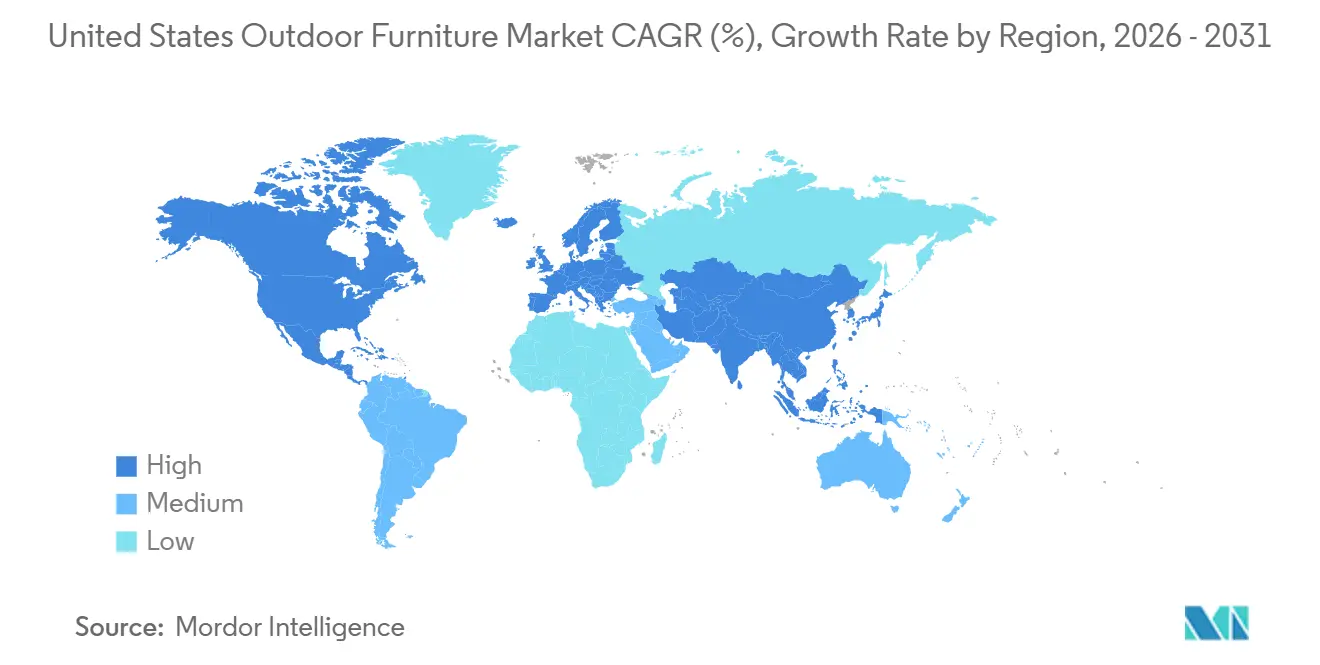
The South held a 46.34% market share in 2025, driven by favorable climates, household migration, and single-family construction emphasizing outdoor spaces. Housing starts in the South reached 667,000 in August 2025 (seasonally adjusted annual basis), sustaining demand for dining sets, lounge seating, and shade structures. Hospitality deployments in resort corridors and urban centers transitioned outdoor seating from temporary to permanent infrastructure. Legacy manufacturing resources and trade associations in southern hubs guide sustainability practices and compliance. High import reliance for key categories influences sourcing strategies during cost volatility.
The West is projected to achieve a 7.03% CAGR through 2031, supported by rising construction activity and demand for premium products in coastal metros. Single-family starts rebounded in 2025, driving purchases of durable, low-maintenance materials suited for heat and sunlight. Municipal outdoor dining frameworks in western cities align with increased use of public plazas and parklets. Composite suppliers expanded distribution networks to improve product availability. Innovations in heat management and UV protection technologies are gaining traction among Western buyers.
The Midwest and Northeast contribute smaller shares with steady replacement demand and shorter outdoor seasons. The Midwest recorded 220,000 housing starts in August 2025 (seasonally adjusted annual basis), maintaining demand for patio and porch installations. Northeastern markets balance urban density and historic districts with outdoor spaces requiring specific accessibility considerations. Manufacturers and distributors support four-season use cases with durable, modular, and weather-resistant materials, protective covers, and compact configurations for limited spaces.

Regulatory Landscape
The United States outdoor furniture market is shaped by federal product-safety oversight and trade policy that affect sourcing and landed cost. The US Consumer Product Safety Commission (CPSC) is the primary federal body for consumer product safety, with mandatory requirements applying in specific areas (for example, the STURDY Act-driven clothing storage unit rule at 16 CFR Part 1261 that incorporates ASTM F2057-23) alongside general safety obligations under the Consumer Product Safety Act. Outdoor furniture is not uniformly covered by a single mandatory standard, but compliance programs commonly extend to lead limits for surface coatings and children’s product certification where applicable.
Trade measures have become a material external compliance variable for outdoor furniture that uses wood and metal inputs. Under Section 232, a 25% ad valorem tariff has applied to certain furniture categories since October 14, 2025, and a scheduled tariff increase for upholstered furniture, cabinets, and vanities on January 1, 2026 was delayed by Presidential Proclamation until at least January 1, 2027. An April 6, 2026 proclamation also modified Section 232 tariff calculations for affected furniture with metal components by shifting the assessment base from metal content value to full customs value, which increases the importance of product composition and customs classification discipline for importers and brands building assortments.
Value Chain Analysis
The value chain for outdoor furniture in the United States covers raw materials (wood, aluminum, and polymers such as recycled HDPE), component processing (powder coating, fasteners, cushions, and upholstery), manufacturing and assembly (a mix of domestic production and overseas finished goods), and multi-format distribution into residential retail and commercial or contract channels. Imports remain a large part of market supply, commonly cited at roughly half or more of demand, with China continuing as a key source even as alternative origins such as Vietnam and India expand. This dependence increases exposure to freight variability, tariffs, and lead-time risk, particularly for metal-framed and multi-material sets.
Downstream, distribution splits between high-volume omnichannel retail (home centers, specialty, and brand DTC sites) and specification-driven B2B procurement for hospitality, campuses, and public spaces where durability and compliance documentation carry weight. Vertically integrated retailers and brand platforms, including Williams-Sonoma and specialty outdoor brands, influence assortment and pricing, while domestic manufacturers such as POLYWOOD and Homecrest emphasize proprietary materials and domestic manufacturing to reduce exposure to import disruptions. USMCA-enabled duty advantages for Mexico can affect sourcing for frames and assembled goods, and the 2025-2026 environment of input cost swings and logistics constraints has reinforced hybrid models that combine global sourcing with domestic assembly and closer-to-market distribution.
Competitive Landscape
The United States outdoor furniture market comprises established brands, niche players, and direct-to-consumer entrants competing on durability, design, and service. Trex Company utilizes composite technologies with high recycled content to expand into related categories and accessories. The company announced capital investments for facility expansions and heat-mitigating surface technologies, set for 2026. Partnerships with regional building products distributors have extended its reach across Western states, enabling Trex to offer integrated solutions combining furniture zones with decking and railing.
RH differentiates itself in the luxury segment with exclusive designer collections, premium materials, and complete outdoor room setups[4]RH, “RH Unveils 2025 Outdoor Sourcebook With Over 40 Exclusive Collections by Acclaimed Designers From Around the World,” ir.rh.com. Its 2025 Outdoor Sourcebook introduced over 40 collections, emphasizing premium teak, aluminum, and all-weather wicker in refined styles. Collaborations with designers and shade manufacturers ensure cohesive aesthetics and flexible specifications. Catalogs and galleries serve as effective selling tools, promoting set-based purchases like lounge, dining, and poolside arrangements. This premium focus drives higher order values and brand loyalty in the U.S. outdoor furniture market.
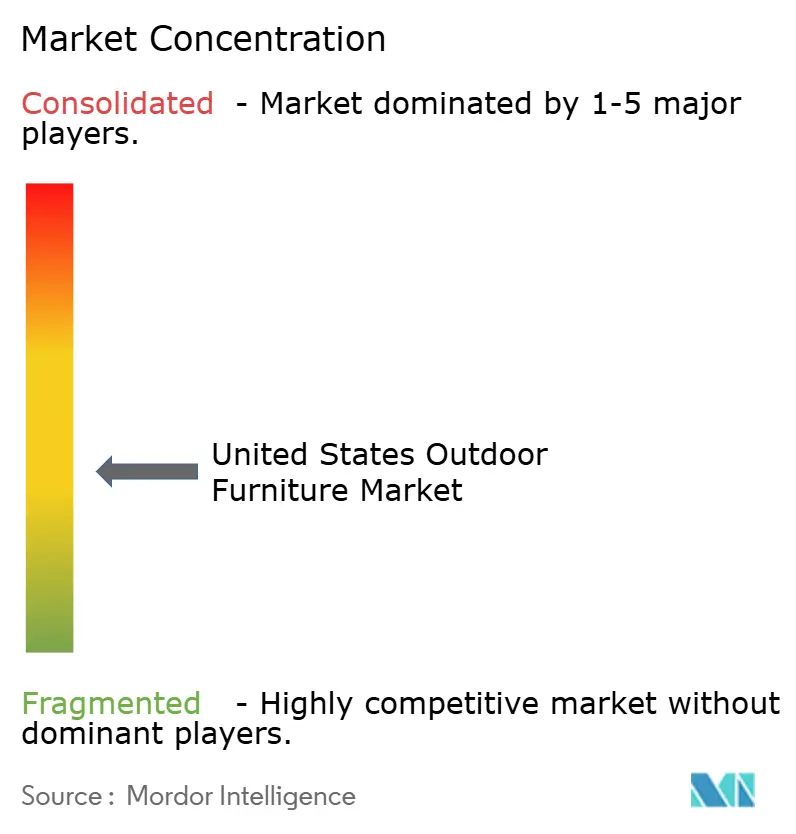
Polywood and Yardbird highlight the role of material innovation and omnichannel strategies in shaping competition. Polywood scales domestic manufacturing and introduces proprietary lumber technologies that enhance surface performance and color retention, supported by multi-year warranties. Yardbird combines a digital-first approach with growing physical touchpoints, emphasizing reclaimed and ocean-bound plastics. Large retailers rely on private-label programs and nationwide distribution, while specialty dealers focus on custom configurations and curated assortments. The market remains moderately fragmented, with differentiation driven by materials science, brand design, and channel strategies.
United States Outdoor Furniture Industry Leaders
Ashley Furniture Industries Inc.
Brown Jordan Inc.
Home Depot Product Authority LLC
Lowe’s Companies Inc.
Williams-Sonoma Inc.
- *Disclaimer: Major Players sorted in no particular order

Market Opportunities and Future Outlook
Omnichannel selling tied to visualization and configuration tools is a clear whitespace area as online retail grows faster than other channels and buyers increasingly begin with digital discovery before committing to set-based purchases. Brands that connect online configuration (including finish and cushion choices) with physical touchpoints, samples, and faster delivery windows can better win higher-value categories such as loungers and daybeds, while improving fit-for-purpose selection for climate and use intensity. The market also has room for specification-forward offerings that help commercial buyers address durability and accessibility needs, supported by the ongoing formalization of outdoor dining programs in major cities and the increasing use of performance test frameworks such as BIFMA OF-2025 for outdoor furniture.
Material and manufacturing innovation is also a near-term opportunity, particularly for products that reduce maintenance and extend service life in high-UV and coastal environments, including UV resistance testing aligned with ASTM G154 and flame considerations where applicable in commercial textiles. Investment activity in adjacent outdoor living manufacturing points to sustained interest in capacity and regional responsiveness: in July 2026, Deckorators (UFP Industries) opened a 253,310-square-foot production facility in Lackawanna, New York to increase capacity for Surestone technology decking products, which supports integrated project demand when furniture, decking, and railing are purchased together. At the same time, the April 2026 shift in Section 232 tariff assessment for certain metal-component products elevates the commercial case for redesign-to-value, alternate material mixes including recycled polymers, and supply chain diversification to protect price points across mid-range and premium tiers.
Recent Industry Developments
- July 2026: Ashley Furniture Industries Inc. scheduled its 2026 Outdoor Market at AmericasMart for July 21-23, 2026, positioning a large, retail-ready assortment (over 15,000 SKUs) for dealer ordering. The event format supports faster line reviews and replenishment planning as retailers manage lead times alongside seasonal demand spikes.
- December 2025: Brown Jordan expanded into outdoor lighting, introducing solar-powered lanterns in two models, Terra and Sora. The move broadens the line beyond seating and tables and strengthens cross-sell potential for residential and hospitality buyers pursuing full-room outdoor packages.
- April 2025: Brown Jordan partnered with Kravet to launch the Kravet x Brown Jordan outdoor furniture collection. The collaboration highlights continued premiumization through design-led collections and gives suppliers a differentiated option in higher-margin channels that prioritize coordinated aesthetics across textiles and frames.


Research Methodology Framework and Report Scope
Market Definition and Coverage
For this study, the market covers revenue generated from outdoor furniture sold in the United States for open-air residential and commercial spaces, including common patio and garden pieces purchased through retail and project channels.
Scope exclusions: We exclude used furniture re-sales, indoor-only furniture, and camping furniture that is mainly designed for portable outdoor recreation.
Segmentation Overview
- By Product
- Chairs
- Tables
- Seating Sets
- Loungers and Daybeds
- Dining Sets
- Other Products
- By Material
- Wood
- Metal
- Plastic & Polymer
- Other Materials
- By End User
- Residential
- Commercial
- By Price Range
- Economy
- Mid-Range
- Premium
- By Distribution Channel
- Retail/B2C Channels
- Home Centers
- Specialty Stores
- Online
- Other Distribution Channels
- B2B Channel/Contractors
- Retail/B2C Channels
- By Geography
- Northeast
- Midwest
- South
- West
Data Sources, Market Sizing, and Validation
Desk Research
We start with desk research to set a clear line around what counts as outdoor furniture in the United States, and to collect inputs that can be tracked the same way each year. Public and official sources give us dependable context on demand and pricing, such as US Census Bureau housing and retail indicators, Bureau of Labor Statistics consumer price and spending series, US International Trade Commission trade statistics for relevant furniture categories, and Federal Reserve rate signals tied to financing conditions.
To convert these signals into a working model, we also review company filings, investor presentations, association websites, and reputable press coverage to understand product mix shifts, channel momentum, and pricing actions. In a few places, paid subscriptions that support company financials, news screening, and patent look-ups are used to speed up cross-checks and reduce missed updates. The desk research sources named here are not exhaustive, and many other public references were used for data collection, validation, and clarification.
Primary Interviews and Surveys
Our primary work uses expert interviews and structured surveys with manufacturers, importers, distributors, retailers, and commercial buyers such as hospitality and property managers, so assumptions stay close to how products are priced and purchased. These conversations help us validate offline versus online splits, the effect of promotions on realized prices, and the pace of replacement demand in residential backyards and commercial venues. When desk inputs disagree, we re-contact respondents to confirm realistic ranges before finalizing the model.
Distribution of primary research fieldwork respondents
| Company type | Respondent position | Region |
|---|---|---|
| Top tier: 32% | CXOs: 15% | |
| Mid tier: 53% | Functional/Unit leaders: 30% | |
| Smaller Players: 15% | Managers: 55% |
Market-Sizing & Forecasting
Sizing is built using top-down and bottom-up methods. We first reconstruct the demand pool from US housing activity, outdoor living-related spend signals, and furniture trade flows, then we check the result using selective supplier and channel approximations. These bottom-up checks are kept practical, such as sampled price bands by product type, observed channel discounting, and interview-confirmed sell-through patterns that typically peak in spring and summer.
Key inputs in the model include housing starts and remodeling momentum, seasonality by quarter, average selling price movement by material mix, online penetration in furniture purchasing, and commercial refresh cycles for patios in hospitality settings. For forecasting, scenario analysis is applied and then guided by simple trend smoothing on the main drivers, followed by a review with primary respondents to keep price and volume paths realistic. Where a company-level roll-up is not possible, gaps are handled using bounded ranges that are tightened using consistent price-times-volume logic rather than forcing overly granular splits.
Data Validation & Update Cycle
We validate outputs through triangulation across independent signals, and we run variance checks at the total level and across key cuts such as residential versus commercial and offline versus online. Outliers are reviewed, assumptions are revisited, and the model is recalculated so the final number stays consistent with observable demand and pricing signals.
Reports refresh annually, with interim updates when material events shift consumer spending, promo intensity, or input costs that affect pricing. Before delivery, an analyst performs a fresh pass across the latest public indicators and recent interview feedback, and then the final numbers are signed off after multi-step internal reviews.
Mordor Intelligence's United States Outdoor Furniture Market Estimate Compared With Other Published Estimates
Published market sizes for US outdoor furniture often diverge because the scopes look similar on the surface, but the included items, pricing basis, and base year are not always aligned. Differences also come from how firms treat online discounting, the seasonal selling curve, and whether commercial replacement demand is separated or blended into a single average.
Import trends for furniture categories, housing and retail demand indicators, and interview-based realized price checks are the evidence that keeps Mordor Intelligence's estimate limited to outdoor furniture, instead of folding in outdoor cooking or other adjacent outdoor living products.
Benchmark comparison
| Source | Market Size | Gaps in Research Methodology |
|---|---|---|
| Mordor Intelligence | USD 6.98 B (2025) | |
| Trade Publisher A | USD 6.90 B (2024) | The value is discussed in a broader outdoor setting that also covers grills, so furniture-only boundaries can be interpreted differently, and manufacturer-level demand framing can shift the comparable dollar base. |
| Industry Brief B | USD 9.30 B (2022) | The figure is anchored to an earlier price environment and may apply broader average pricing without fully adjusting for channel promotions and mix changes that influence realized selling prices. |
The spread across sources mainly reflects year selection, whether values reflect realized selling prices, and whether adjacent outdoor products are blended into the total. By keeping the furniture-only scope consistent and by checking totals against repeatable demand and pricing signals, we provide a balanced number that can be updated using the same steps each cycle.


Key Questions Answered in the Report
What is the size and growth outlook of the United States outdoor furniture market by 2031?
The United States outdoor furniture market size is USD 7.41 billion in 2026 and is forecast to reach USD 10.03 billion by 2031 at a 6.24% CAGR.
Which product categories lead demand in the United States outdoor furniture market?
Chairs lead on volume with a 45.74% share in 2025, and loungers and daybeds show the fastest 9.78% CAGR as households invest in comfort-oriented seating.
Which regions contribute most to sales within the United States outdoor furniture market?
The South held a 46.34% share in 2025, supported by strong housing starts, while the West recorded the fastest projected 7.03% CAGR to 2031.
How are sustainability and compliance affecting the United States outdoor furniture market?
Emissions caps for composite wood and VOC limits in maintenance products, alongside FSC certification and recycled materials, are shaping sourcing and product specifications.
What channels are growing fastest in the United States outdoor furniture market?
B2B channels led with 59.87% share in 2025, and online retail is the fastest-growing channel with a 10.32% CAGR to 2031.
What challenges could slow growth in the United States outdoor furniture market?
Volatile input costs and skilled labor shortages weigh on margins and production timing, although inventory and sourcing strategies are helping firms absorb near-term pressure.
Page last updated on:






