
Outage Management Systems Market Size and Share
Market Overview
| Study Period | 2021 - 2031 |
|---|---|
| Market Size (2026) | USD 3.48 Billion |
| Market Size (2031) | USD 7.53 Billion |
| Growth Rate (2026 - 2031) | 16.72 % |
| Fastest Growing Market | Asia Pacific |
| Largest Market | North America |
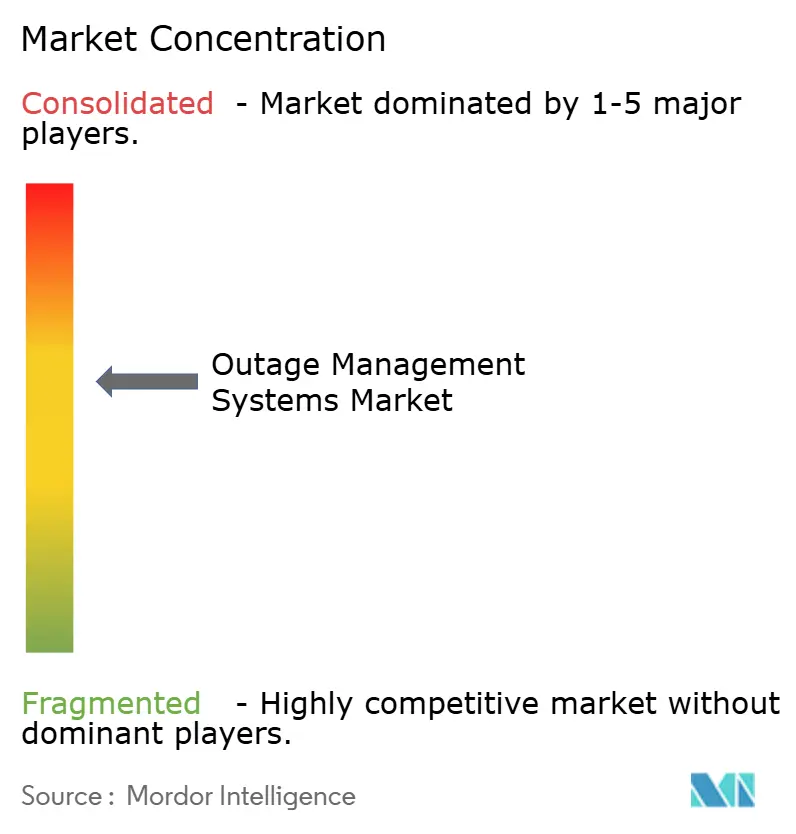
| Market Concentration | Medium |
Major Players *Disclaimer: Major Players sorted in no particular order Image © Mordor Intelligence. Reuse requires attribution under CC BY 4.0. | |
Outage Management Systems Market Analysis by Mordor Intelligence
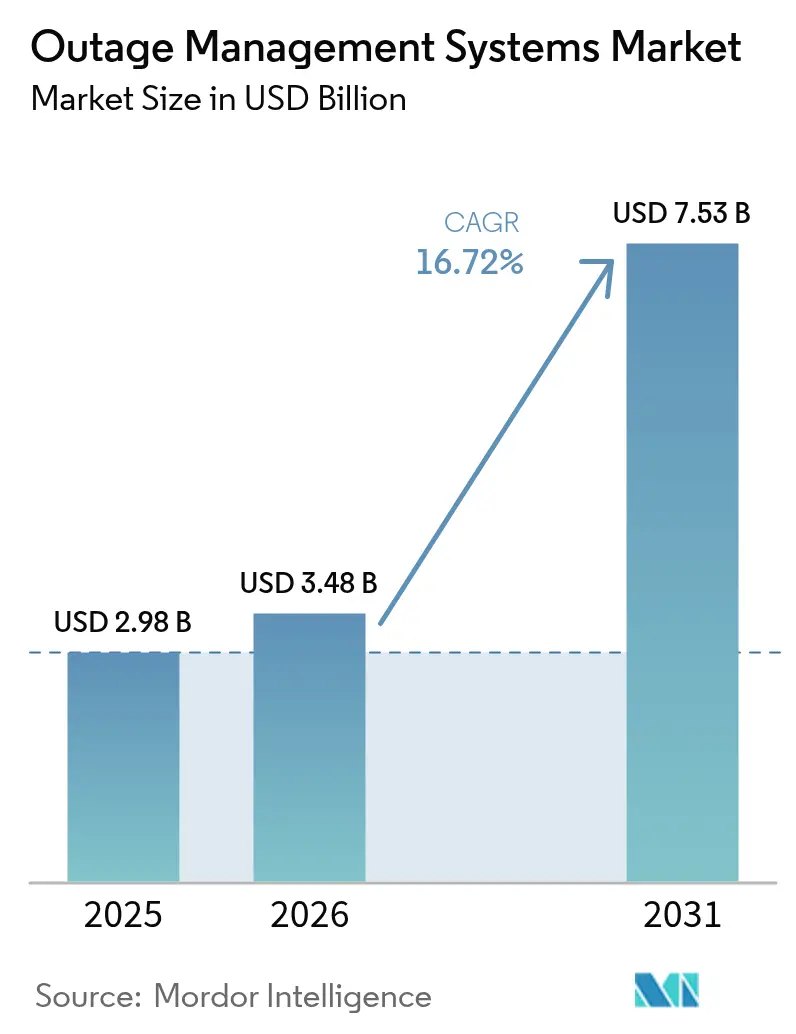
The Outage Management Systems Market size was valued at USD 2.98 billion in 2025 and estimated to grow from USD 3.48 billion in 2026 to reach USD 7.53 billion by 2031, at a CAGR of 16.72% during the forecast period (2026-2031).
Demand accelerates as utilities deploy AI-enabled grid orchestration to counter rising climate-driven disruptions, integrate rapidly growing distributed energy resources (DERs), and meet increasingly stringent reliability metrics, such as SAIDI and SAIFI. Regulatory mandates now require utilities to replace legacy fault-location tools with predictive analytics platforms that ingest real-time data from smart inverters, AMI, and SCADA networks, resulting in sustained capital expenditures. Integrated solutions dominate because they consolidate fault detection, crew dispatch, and customer communications inside one vendor ecosystem, reducing data-silo friction and accelerating restoration cycles. Although on-premise deployments still prevail, hybrid and cloud architectures are gaining ground, offering scalable AI processing for vegetation management and predictive maintenance while addressing cybersecurity through Zero-Trust designs. Geographically, North America anchors spending with federal transmission investments, whereas Asia-Pacific emerges as the fastest-growing market, propelled by China’s record grid modernization funding and Japan’s large-scale infrastructure upgrades.
Key Report Takeaways
- By type, Integrated platforms held 61.90% of the Outage Management System market share in 2025, while standalone solutions declined in relative importance.
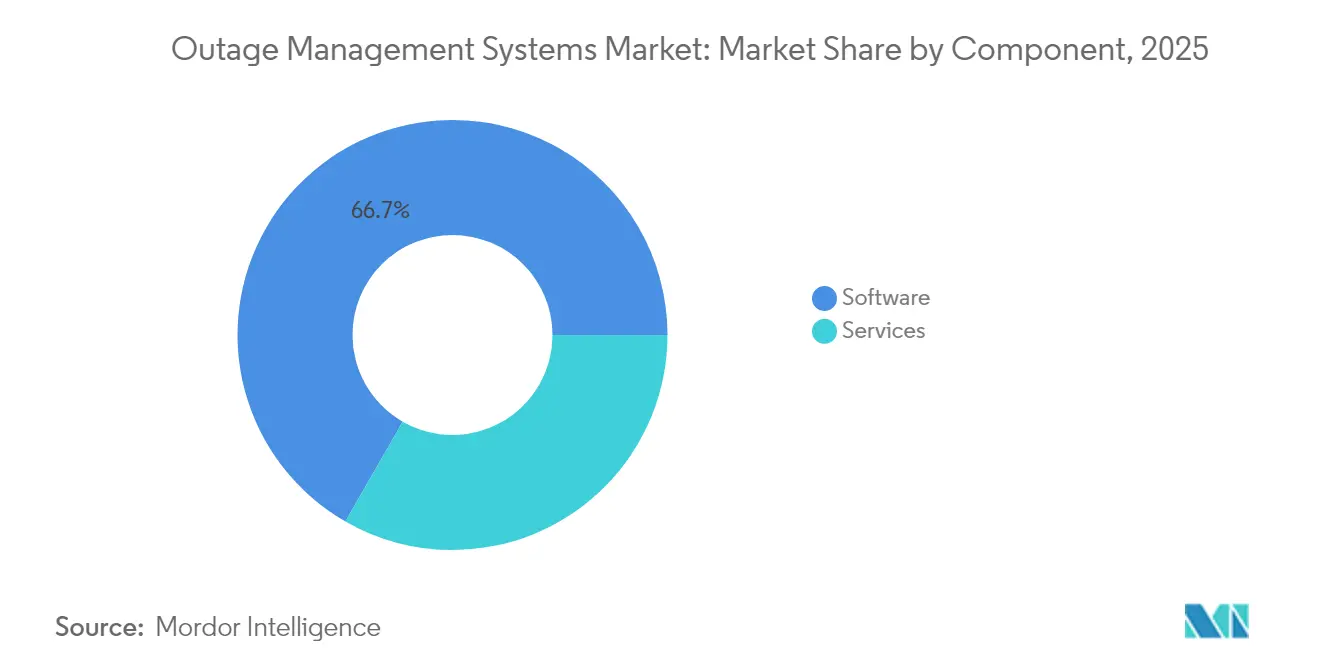
- By component, software captured 66.70% of the revenue in 2025; the services segment is advancing at a 18.02% CAGR to 2031 as utilities seek AI/ML expertise.
- By deployment mode, On-premise deployments retained a 63.10% share in 2025; however, cloud-based options are rising at a 20.05% CAGR, driven by hybrid adoption strategies.
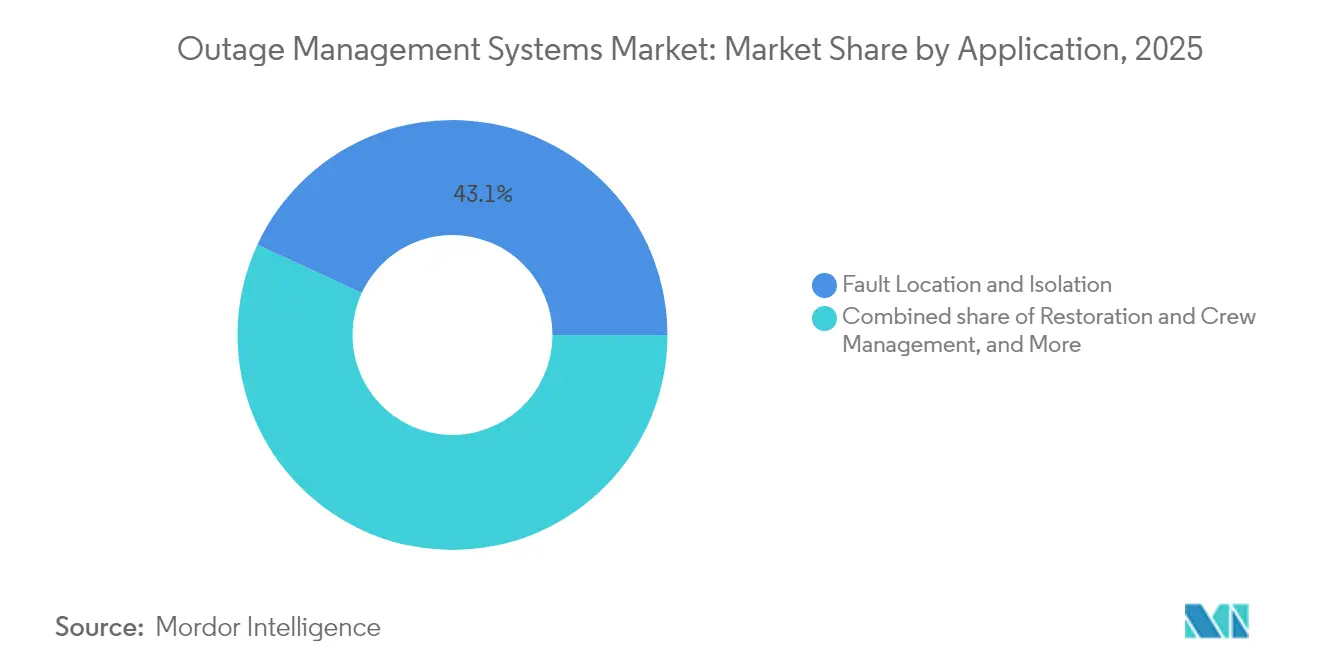
- By application, fault location and isolation accounted for 43.10% of the 2025 Outage Management System market size, while restoration and crew management led growth at 18.35%.
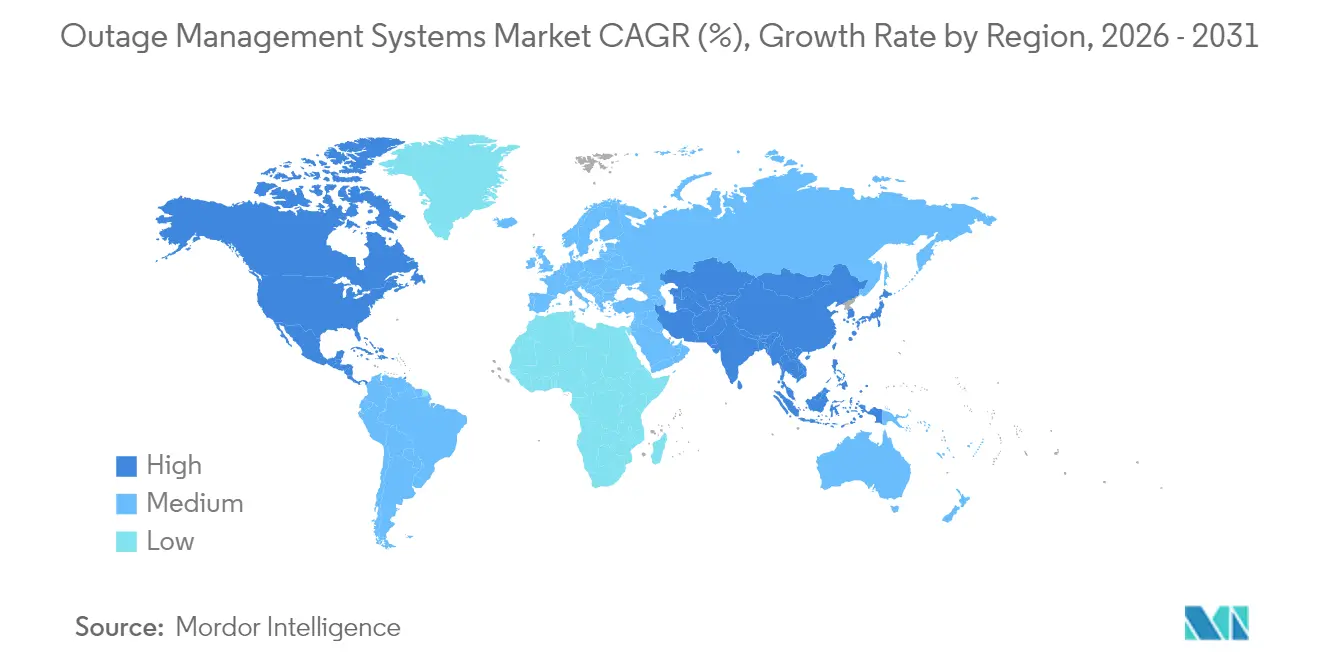
- By geography, North America accounted for 37.00% of the revenue in 2025; the Asia-Pacific region is projected to grow at a 19.18% CAGR through 2031.
Note: Market size and forecast figures in this report are generated using Mordor Intelligence’s proprietary estimation framework, updated with the latest available data and insights as of 2026.
Market Trends and Insights
Drivers Impact Analysis of Outage Management Systems Market*
| Driver | (~) % Impact on CAGR Forecast | Geographic Relevance | Impact Timeline |
|---|---|---|---|
| Intensifying climate-related outages boosting grid-resilience spend | 4.20% | High in North America and Asia-Pacific coastal markets | Medium term (2-4 years) |
| Smart-grid & ADMS roll-outs across Tier-1 utilities | 3.80% | North America, Europe, expanding into Asia-Pacific core markets | Long term (≥ 4 years) |
| Reliability-index (SAIDI/SAIFI) compliance mandates | 2.90% | Global, variable enforcement | Short term (≤ 2 years) |
| AI-driven predictive outage analytics adoption | 3.10% | Early uptake in North America and Europe | Medium term (2-4 years) |
| DER proliferation demanding real-time visibility | 2.40% | Global, strongest in renewable-heavy grids | Long term (≥ 4 years) |
| Shift to cloud-native OMS & mobile workforce tools | 1.80% | Faster uptake in developed markets | Short term (≤ 2 years) |
| Source: Mordor Intelligence | |||
Intensifying Climate-Related Outages Boosting Grid-Resilience Spend
Weather now drives nearly 80% of major outages, prompting utilities to invest heavily in grid-hardening initiatives, such as automated sectionalizers, undergrounding, and AI-based vegetation analytics(1)Source: Laila Sharpless & Christine Byrne, “Powering Up Resilience,” T&D World, tdworld.com . CenterPoint Energy alone has allocated USD 21 billion over five years to bolster storm resilience, illustrating the large-scale capital currently being invested in preventive technologies(2)Source: CenterPoint Energy, “Collaboration with Technosylva,” centerpointenergy.com . OMS platforms have evolved from fault location tools into comprehensive resilience hubs that integrate weather feeds, asset health data, and automated switching. The economic stakes are evident as multi-day outages repeatedly impose multi-billion-dollar losses on regional economies, strengthening return-on-investment arguments for predictive solutions. Utilities also recognize that preventing customer interruptions enhances satisfaction metrics more effectively than merely accelerating restoration, which in turn prompts accelerated OMS upgrades.
Smart-Grid & ADMS Roll-Outs Across Tier-1 Utilities
Large utilities are replacing siloed applications with unified ADMS-OMS suites that can process SCADA, GIS, and AMI data in real-time. GE Vernova’s GridOS and Schneider Electric’s One Digital Grid platforms exemplify the shift, promising outage reductions of up to 40% through automated fault isolation and DER coordination(3)Source: GE Vernova, “GridOS Software Announcement,” gevernova.com . As bidirectional power flows rise, integrated solutions become indispensable, explaining their premium pricing and faster adoption curve. Utilities increasingly embed Zero-Trust security, reflecting regulators’ insistence on cyber-resilient architectures.
AI-Driven Predictive Outage Analytics Adoption
Artificial intelligence is moving utilities from reactive notification to predictive mitigation. Eversource reported avoiding 40,000 customer interruptions within two months of deploying AI algorithms trained on historical faults and weather patterns. California’s statewide adoption of AI-enabled outage management underscores regulatory confidence in machine-learning--based decision support. Accuracy rates ranging from 75% to 88% in identifying vulnerable grid assets are attainable; yet, 43% of utilities cite skill gaps as the primary obstacle to scaling AI use(4)Source: Marina Donovan, “Workforce Readiness Gap,” itron.com . Consulting and training, therefore, form a fast-growing services revenue pool.
DER Proliferation Demanding Real-Time Visibility
Rapid DER uptake requires OMS platforms to manage bidirectional flows and coordinate with virtual power plants. Sunrun’s network aggregated 80 MW of residential solar-plus-storage capacity in 2024, demonstrating DERs’ ability to deliver peak-support services(5)Source: Sunrun Inc., “Virtual Power Plant Programs,” sunrun.com . Utilities must therefore upgrade OMS solutions to maintain situational awareness and to dispatch distributed assets alongside traditional feeders. Vendors with DER-aware architectures are gaining a competitive advantage, particularly in markets enabling aggregator participation in wholesale settlements.
Restraints Impact Analysis of Outage Management Systems Market*
| Restraint | (~) % Impact on CAGR Forecast | Geographic Relevance | Impact Timeline |
|---|---|---|---|
| High capex & legacy integration hurdles | -2.1% | Global with higher impact in regions with aging infrastructure | Medium term (2-4 years) |
| Cyber-security vulnerabilities in connected OMS | -1.7% | Global with heightened concerns in critical infrastructure regions | Short term (≤ 2 years) |
| GIS data-quality gaps undermining algorithms | -1.3% | Global with acute impact in utilities with legacy mapping systems | Medium term (2-4 years) |
| Workforce skill shortage in AI/ML analytics | -1.5% | North America & EU primary, expanding to APAC markets | Long term (≥ 4 years) |
| Source: Mordor Intelligence | |||
High Capex & Legacy Integration Hurdles
Enterprise-grade OMS deployments often exceed USD 50 million for large investor-owned utilities. Cost escalates when integrating decades-old SCADA, GIS, and CIS assets that lack modern APIs, forcing custom middleware development and long data-migration projects. Organizational change management further complicates roll-outs as frontline crews adapt to automated workflows. Regulatory scrutiny remains intense because utilities must uphold reliability metrics during system migrations, amplifying execution risk.
Cyber-Security Vulnerabilities in Connected OMS
Expanding connectivity has magnified the attack surface across more than 23,000 grid entry points tracked by NERC in 2024, up from roughly 21,000 two years earlier. Academic studies show that coordinated strikes on smart inverters can destabilize grids, even at modest penetration levels(6)Source: Xiangyu Hui et al., “Destabilizing Power Grid,” arxiv.org . Utilities face talent shortages in cyber disciplines, making it difficult to implement Zero-Trust, continuous-monitoring frameworks at scale. Consequently, some operators delay cloud migrations or limit remote access, tempering short-term adoption of fully connected architectures.
*Our forecasts treat driver/restraint impacts as directional, not additive. The impact forecasts reflect baseline growth, mix effects, and variable interactions.
Outage Management Systems Market Segment Analysis
By Type:
Integrated Solutions Drive Market ConsolidationIntegrated platforms commanded 61.90% of the revenue in 2025 and are forecast to grow at a 19.12% CAGR to 2031, reflecting utilities’ drive to consolidate multiple point tools into a single pane of glass. This leadership position underscores how integrated suites cut vendor-management overhead, eliminate data-silo latency, and streamline restoration workflows. Utilities that deploy integrated offerings report 30-40% shorter average outage durations compared to users of fragmented systems.
Oracle’s Energy & Water Data Intelligence exemplifies the trend, fusing operational telemetry, weather intelligence, and customer analytics to automate decision logic. As a result, the Outage Management System market size attributed to integrated solutions is set to widen its lead over standalone deployments through 2031. Vendors with comprehensive portfolios, therefore, obtain negotiating leverage, while niche point-solution providers increasingly seek partnerships or acquisitions to remain relevant.
By Component:
Services Surge as AI Complexity GrowsSoftware maintained a 66.70% share in 2025, anchored by mature codebases from ABB, GE Vernova, and Schneider Electric. Yet services are expanding at 18.02% CAGR because utilities need guidance in AI model training, cyber-hardening, and multi-system data alignment. Consulting captures the fastest growth as utilities confront jurisdiction-specific reliability rules and cloud-sovereignty statutes.
Implementation and support also scale briskly because software procurement accounts for only about one-third of total project spend. The transition toward subscription models reinforces vendor annuity streams. Schneider Electric recorded a 140% jump in SaaS revenue in 2024, signaling utilities’ willingness to trade capital expenditures (capex) for operational expenditures (opex). Consequently, service providers wield outsized influence over project outcomes, nudging the Outage Management System market toward higher lifetime-value economics.


By Deployment Mode:
Cloud Adoption Accelerates Despite Security ConcernsOn-premise installations retained a 63.10% share in 2025 because utilities prize local control of mission-critical data and have invested in hardened data centers. Nevertheless, cloud-hosted deployments are rising at a 20.05% CAGR. Hybrid topologies are now common: operational controls remain on-site while heavy-compute analytics run in Amazon Web Services or Microsoft Azure environments.
Hitachi Energy’s tie-up with AWS exemplifies this model, utilizing satellite imagery and AI to forecast vegetation-caused outages while maintaining real-time SCADA loops on utility premises. Vendors that offer flexible data-sovereignty options, therefore, find receptive audiences, and utilities increasingly stipulate Zero-Trust architectures and immutable-log capabilities as baseline procurement criteria.
By Application:
Restoration Management Gains MomentumFault location and isolation generated 43.10% of 2025 revenues, cementing its role as a foundational capability. However, restoration and crew management tools are expanding at 18.35% CAGR as utilities aim to minimize customer minutes interrupted by optimizing workforce routing. These modules integrate real-time traffic feeds, crew skill profiles, and inventory data to prioritize repair tasks, steadily increasing the Outage Management System's market share for restoration applications.
Customer communication functions, while essential, face commoditization because multi-channel messaging frameworks are now ubiquitous. Consequently, differentiation shifts to AI-enabled crew dispatch and predictive asset inspection. Vendors embedding mobile workforce apps that operate during severe weather secure premium contract values and lock-in through continuous feature updates.
Geography Analysis
North America Outage Management Systems Market
North America generated 37.00% of the Outage Management System market revenue in 2025, driven by USD 8 billion in federal transmission grants and a series of severe weather events that compelled utilities to strengthen their grids. Investors reward the procurement of integrated solutions because it visibly improves SAIDI/SAIFI performance. Canada supports regional momentum through provincial-level modernization, as illustrated by Énergie NB Power’s AI-based outage prediction program, which restored 90% of customers within 24 hours during a 2024 ice storm.
APAC Outage Management Systems Market
The Asia-Pacific region is the fastest-growing, with a 19.18% CAGR. China’s State Grid budgeted more than 600 billion yuan in 2024 for digital substations and ultra-high-voltage corridors, fuelling large OMS tenders. Japan committed upwards of 150 billion yen to reinforce its network in anticipation of AI-driven data-center expansion. India presents additional upside, as Hitachi Energy has earmarked INR 2,000 crore to scale its domestic manufacturing and digital solutions capabilities.
EMEA and LATAM Outage Management Systems Market
Europe, Latin America, and the Middle East & Africa show steady though lower growth. In Latin America, Chile’s 2050 carbon-neutrality roadmap requires USD 431 billion in distribution spending by 2040, thereby expanding the addressable OMS budgets. European utilities emphasize DER integration and storm-resilience upgrades but face slower revenue expansion given their matured grid-modernization baselines. Across all secondary regions, government policy support and multilateral climate finance mechanisms play pivotal roles in the pace of OMS adoption.

Regulatory Landscape
In North America, outage management and adjacent ADMS deployments are increasingly shaped by mandatory cyber and reliability standards tied to bulk electric system operations. In March 2026, the US Federal Energy Regulatory Commission (FERC) published Order No. 918 approving NERC Critical Infrastructure Protection (CIP) Reliability Standard CIP-003-11 for low-impact facilities, and Order No. 919 approving virtualization-related CIP standards while directing NERC to develop additional criteria for certain exceptions. The updates tighten expectations on auditability, access controls, and secure operational architectures, which in turn affect OMS integration, hosting, and vendor selection.
Grid-operational regulation is also evolving around inverter-based resource (IBR) integration, raising data exchange and modeling needs that feed into outage analytics and restoration workflows. In February 2026, FERC approved multiple Reliability Standards, including MOD-032-2 and TOP-003-8, addressing IBR modeling and data sharing requirements. This reinforces the need for OMS platforms to ingest near-real-time telemetry from grid-edge and DER-connected systems while maintaining compliance-grade records. In Europe, the European Commission moved digital governance forward in June 2026 by publishing a strategic roadmap for digitalisation and AI in the energy sector and initiating an annual Energy Digitalisation Forum, supporting broader adoption of standardized monitoring and performance indicators for smart grid technologies used alongside OMS.
Competitive Landscape
Competition spans global conglomerates, mid-tier domain specialists, and AI-native startups, yielding moderate market fragmentation. ABB, GE Vernova, Schneider Electric, and Siemens anchor the top tier with comprehensive end-to-end portfolios that cover OMS, ADMS, SCADA, and cybersecurity. Their long-standing utility relationships, robust service arms, and ongoing R&D investments underpin their sticky market positions. Mid-sized players, such as Survalent Technology and Milsoft Utility Solutions, win business by offering configurable software tailored to the needs of municipal and cooperative utilities.
Strategically, incumbents are acquiring AI capabilities: GE Vernova’s purchase of Alteia adds computer-vision analytics for predictive maintenance. Oracle’s recent launch of an AI-powered customer-service module further illustrates the pivot toward data intelligence. Vendors also forge cloud partnerships—such as Hitachi Energy with AWS and Itron with Microsoft—to accelerate the time-to-market for advanced analytics. Startups specializing in vegetation-risk AI challenge traditional players but often partner with them instead of competing head-to-head, given utilities’ preference for proven vendors.
The Outage Management System market rewards vendors that marry domain depth with AI agility. As utilities standardize on integrated suites, smaller point-solution providers may face pressure to consolidate or specialize in niche areas. Cyber-resilience capabilities and DER orchestration functions are emerging as decisive evaluation criteria in ongoing RFPs.
Outage Management Systems Industry Leaders
ABB Ltd.
General Electric Company
Schneider Electric SA
Siemens AG
Oracle Corporation
- *Disclaimer: Major Players sorted in no particular order
Outage Management Systems Market Companies Covered in this Report
- ABB Ltd.
- General Electric Co.
- Oracle Corp.
- Schneider Electric SE
- Siemens AG
- Hitachi Energy (OMS)
- Hexagon (Intergraph)
- CGI Inc.
- Advanced Control Systems (Indra/Minsait ACS)
- Futura Systems Inc.
- ETAP Automation
- Survalent Technology
- Landis+Gyr Group
- Milsoft Utility Solutions
- Trimble Utilities
- OSIsoft (AVEVA)
- IBM Corp.
- Cisco Systems Inc.
- Fujitsu Ltd.
- S&C Electric Co.
- Itron Inc.

Market Opportunities and Future Outlook
Utility modernization programs are moving OMS from a restoration back-office tool toward an operational intelligence layer that connects ADMS, DERMS, AMI, GIS, and mobile workforce systems. This shift creates whitespace in integration services, data quality remediation, and cyber-hardening for hybrid architectures. Evidence from utility programs also points to measurable outcomes that procurement teams can connect to reliability filings: in Pennsylvania, PPL Electric reported in a June 2026 readiness filing that as of March 2026 it had avoided about 3.3 million permanent outages through deployments spanning smart grid devices, ADMS, and fault isolation and service restoration (FISR). An operational ROI focus increases demand for OMS capabilities that generate auditable event timelines, crew performance metrics, and customer communication logs aligned to SAIDI/SAIFI reporting.
Policy and technical bodies are reinforcing spend areas adjacent to OMS and lifting attach rates for advanced modules. The US Department of Energy Office of Electricity issued its Strategic Plan in March 2026 emphasizing reliability, resilience, and integration of self-healing devices, supporting OMS upgrades that can coordinate automated switching and validate restoration steps using near-real-time telemetry. NERC's 2026 State of Reliability overview highlighted a 2025 increase in conventional generation forced outage rates to 9.2%, adding urgency around improved modeling and operational visibility across transmission and distribution interfaces. Within this context, OMS-ADMS convergence and transmission-capacity awareness tools, including unified intelligence layers from major vendors, are being adopted to reduce cascading impacts during major events.
Recent Industry Developments in Outage Management Systems Market
- June 2026: GE Vernova introduced GridOS for Transmission, positioning a unified intelligence layer for operating transmission networks with improved capacity awareness and real-time decision-making. The launch broadens the software stack that utilities can pair with OMS and ADMS to improve situational awareness during large-area events, supporting faster operator actions across interconnected grids.
- December 2025: ABB entered into an agreement to acquire UK-based IPEC, adding electrical diagnostics and partial discharge monitoring capabilities aimed at predicting asset failures that can trigger outages. This move strengthens ABB's ability to link asset-health sensing with outage prevention and restoration workflows, expanding its end-to-end value proposition for utilities modernizing resilience programs.
- November 2024: Sunrun reported aggregating 80 MW of residential solar-plus-storage capacity through virtual power plant programs, demonstrating scalable DER coordination at the grid edge. As utilities increase reliance on flexible, distributed resources during peak and emergency conditions, OMS architectures that interoperate with DERMS and grid-edge telemetry gain importance for accurate outage prediction, customer communications, and restoration prioritization.


Outage Management Systems Market Report Scope and Research Methodology
Market Definition and Coverage
For this study, the outage management systems market includes software platforms and related services that help utilities detect outages, assess their impact, and coordinate restoration activities across the distribution network and customers.
Scope exclusions: We exclude general grid analytics tools and broader utility IT suites unless they are purchased and deployed specifically as outage management functionality.
Segments Covered in This Report
- By Type
- Stand-alone
- Integrated
- By Component
- Software
- Services
- By Deployment Mode
- On-premise
- Cloud
- By Application
- Fault Location and Isolation
- Restoration and Crew Management
- Customer Information and Call Handling
- By Geography
- North America
- United States
- Canada
- Mexico
- Europe
- Germany
- United Kingdom
- France
- Italy
- NORDIC Countries
- Russia
- Rest of Europe
- Asia-Pacific
- China
- India
- Japan
- South Korea
- ASEAN Countries
- Rest of Asia-Pacific
- South America
- Brazil
- Argentina
- Rest of South America
- Middle East and Africa
- Saudi Arabia
- United Arab Emirates
- South Africa
- Rest of Middle East and Africa
- North America
Data Sources, Market Sizing, and Validation
Desk Research
Desk research starts with building a clean view of the utility landscape and the grid modernization context. OMS spending tends to track reliability pressure and distribution automation rollouts, so we focused on those drivers in the public record. We reviewed public sources such as U.S. Energy Information Administration reliability and outage statistics, U.S. Department of Energy grid modernization updates, International Energy Agency power sector outlooks, and World Bank electricity access and network indicators to keep the demand-side logic realistic.
We also used utilities and solution providers public filings, annual reports, investor presentations, and press releases to map typical OMS program scope and buying cycles. Where available, we cross-checked timelines using utility regulator dockets and major project tenders. Patent databases were referenced to see where product focus is moving, for example automation around fault location and restoration workflows. The desk research inputs help set regional adoption ranges and pricing logic, and we then test the assumptions through interviews. The sources listed here are illustrative, and many other public documents were reviewed for data collection, validation, and clarification.
Primary Interviews and Surveys
Primary work focused on validating what utilities actually buy and deploy, and how spending splits between software, services, and deployment mode. We spoke with a mix of utility operations and IT stakeholders, implementation partners, and product specialists across APAC, EMEA, and the Americas so the model could reflect regional rollout realities such as storm exposure, grid upgrades, and procurement cycles.
Distribution of primary research fieldwork respondents
| Company type | Respondent position | Region |
|---|---|---|
| Top tier: 31% | CXOs: 12% | APAC: 42% |
| Mid tier: 50% | Functional/Unit leaders: 34% | EMEA: 32% |
| Smaller Players: 19% | Managers: 54% | Americas: 26% |
Market-Sizing & Forecasting
The core sizing starts with a top-down build that reconstructs the addressable OMS spend pool by region, using utility count, distribution network scale, and the practical pace of digital grid upgrades, then applies OMS adoption and replacement cycles. To keep this grounded, we corroborate totals with selective bottom-up checks, where sampled deal sizes and deployment patterns are rolled up into a sanity range and adjusted when the two views do not align.
Inputs that matter in this market include the mix of stand-alone versus integrated OMS deployments, the split of software versus services, cloud versus on-premises adoption, and the level of functionality implemented, for example fault location and isolation, restoration and crew management, and customer information and call handling. These signals are further filtered through regional utility investment cycles and reliability focus, since storm-driven events and regulatory pressure can shift budgets quickly. For forecasting, scenario analysis is used to reflect different rollout speeds for cloud migration and distribution automation, and the scenarios are stress-tested with interview feedback before finalizing the annual path.
Where bottom-up evidence is incomplete, gaps are handled by using peer benchmarks from similar utility types and applying conservative price bands. We revisit these bands if interviews indicate different service intensity or implementation scope.
Data Validation & Update Cycle
Validation is done by triangulating the model output against independent signals such as utility digitization programs, public procurement activity, and the expected split between software and services for OMS projects. Outliers are flagged when regional values imply adoption levels that do not match the observed deployment mix or when pricing assumptions drift outside the interview-supported ranges, and then the assumptions are revisited.
Before sign-off, a second analyst reviews the calculations, key assumptions, and year-by-year movements so that sudden jumps have a clear reason. Reports are refreshed annually, with interim updates triggered by material events such as major regulatory changes, large utility program announcements, or notable shifts in cloud adoption. Before delivery, we run a final update pass so clients receive the most current view available at that time.
Mordor Intelligence's Outage Management Systems Market Size Compared Against Other Published Estimates
Published market sizes for outage management systems can differ even when they look similar on the surface, because firms do not always count the same product scope, services intensity, or deployment coverage. Differences also show up when base years vary, when currency timing is handled differently, and when growth is pushed by a more aggressive modernization scenario.
In this study, the biggest gap drivers usually come from whether adjacent utility software is bundled into the OMS number, how implementation and ongoing support services are treated, and whether the model reflects integrated OMS deployments versus only stand-alone tools. Some estimates also lean heavily on a single starting year and then extend forward without re-checking adoption speed by region, which can overstate near-term spending in markets with longer procurement cycles. By keeping the scope tied to OMS use cases, fault location and isolation, restoration and crew management, and customer information and call handling, and refreshing the deployment mix assumptions, the spread in results becomes easier to explain, including in the approach used by Mordor Intelligence.
Benchmark comparison
| Source | Market Size | Gaps in Research Methodology |
|---|---|---|
| Mordor Intelligence | USD 2.98 B (2025) | |
| Industry Publisher A | USD 1.99 B (2025) | Uses a narrower spend view that can undercount integration and services work, and often anchors sizing to a single base-year snapshot that may not fully reflect integrated OMS deployments. |
| Market Platform B | USD 2.21 B (2025) | Starts from a different 2025 estimate and may apply faster near-term adoption assumptions for cloud migration, with less transparency on how application scope and services intensity are separated. |
The table shows that most of the variation sits in what gets counted beyond core OMS software, and how quickly adoption is assumed to expand across regions. When scope is kept consistent and cross-checked with deployment mode, component split, and utility buying patterns, the final value stays traceable to practical inputs and repeatable steps.


Key Questions Answered in the Report
What is the forecasted CAGR for the Outage Management System market from 2026 to 2031?
The market is projected to grow at a 16.72% CAGR, reaching USD 7.53 billion by 2031.
Which region is growing fastest in the Outage Management System market?
Asia-Pacific is expanding at 19.18% CAGR, supported by large-scale grid modernization in China, Japan, and India.
Why are integrated OMS platforms preferred over standalone solutions?
Integrated suites cut vendor-management overhead, unify data streams, and have demonstrated 30-40% reductions in outage duration versus fragmented toolsets.
How significant is cloud deployment in the Outage Management System industry?
While on-premise still holds 63.10% share, cloud-hosted OMS is expanding at 20.05% CAGR as utilities adopt hybrid architectures for AI-driven analytics.
What is driving demand for services within the Outage Management System market?
Utilities require expertise in AI model development, cyber-resilience, and complex legacy-system integration, pushing services growth to an 18.02% CAGR.
Which application segment is advancing fastest?
Restoration and crew management solutions lead with an 18.35% CAGR as utilities prioritize rapid resource allocation to minimize customer-minute interruptions.
Page last updated on:


 Your data is secure and never sold or shared.


