
Otoscope Market Size and Share
Market Overview
| Study Period | 2022 - 2031 |
|---|---|
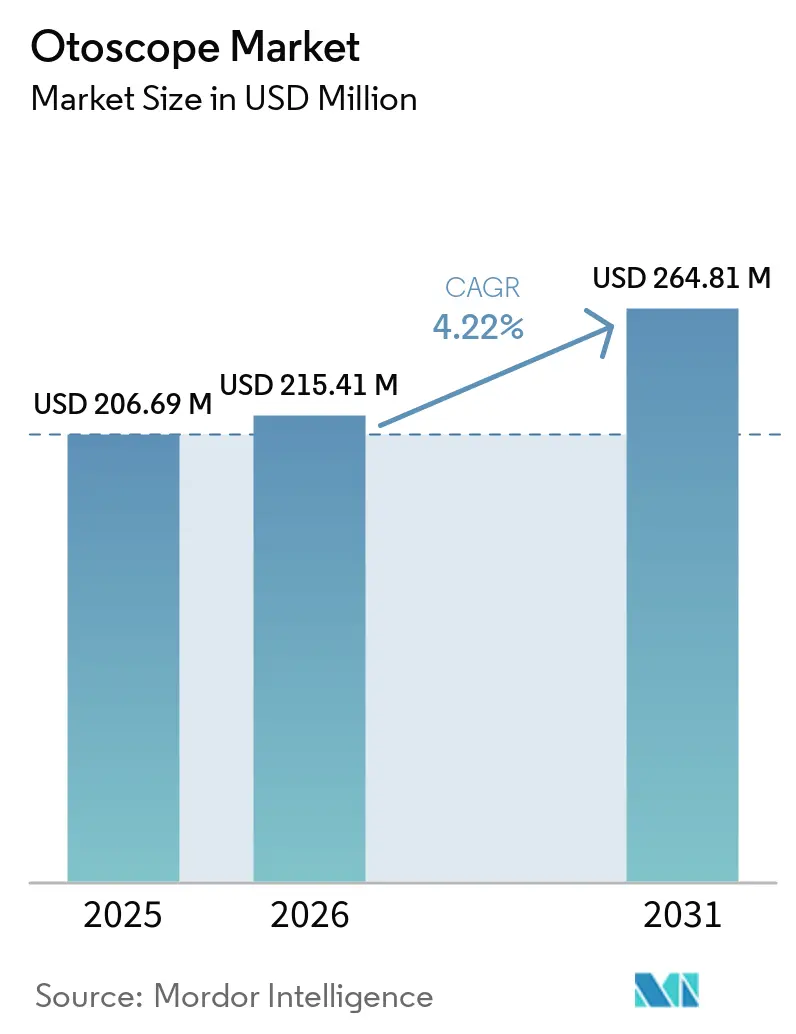
| Market Size (2026) | USD 215.41 Million |
| Market Size (2031) | USD 264.81 Million |
| Growth Rate (2026 - 2031) | 4.22 % |
| Fastest Growing Market | Asia-Pacific |
| Largest Market | North America |
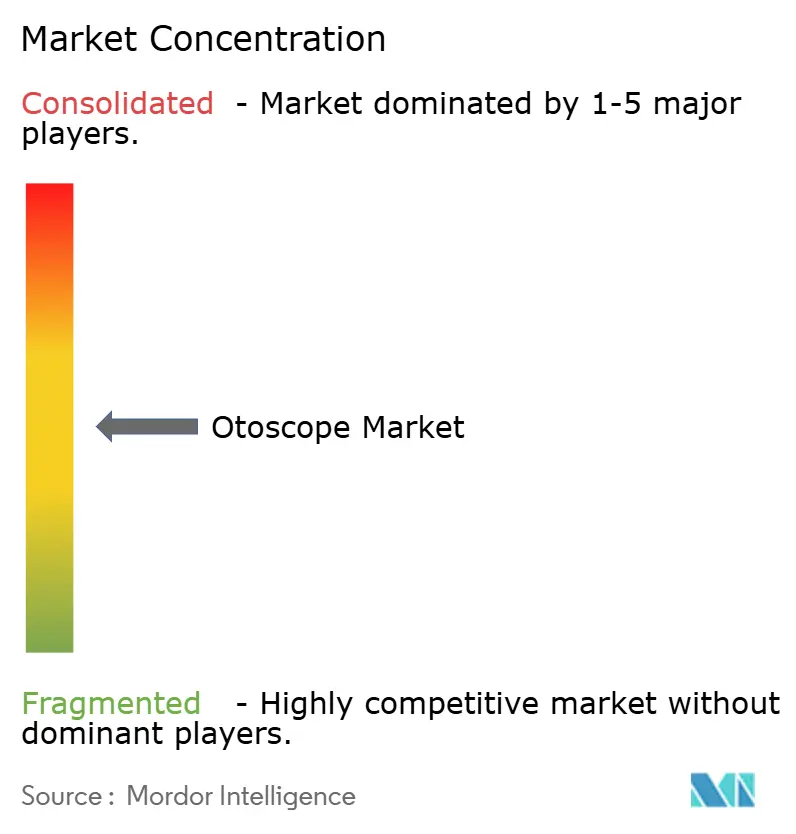
| Market Concentration | Medium |
Major Players *Disclaimer: Major Players sorted in no particular order Image © Mordor Intelligence. Reuse requires attribution under CC BY 4.0. | |
Otoscope Market Analysis by Mordor Intelligence
The otoscope market size was valued at USD 206.69 million in 2025 and estimated to grow from USD 215.41 million in 2026 to reach USD 264.81 million by 2031, at a CAGR of 4.22% during the forecast period (2026-2031). Expansion is supported by digital imaging upgrades, smartphone connectivity, and artificial intelligence (AI) algorithms that boost acute otitis media detection sensitivity to 93.8% and specificity to 93.5%. Product innovation remains brisk, as shown by OtoNexus Medical Technologies’ ultrasound otoscope entering the United States Food and Drug Administration (FDA) Safer Technologies Program (STeP) in 2024-2025, a step that validates non-invasive differentiation of bacterial from viral middle-ear infections.[1] Consumer demand follows suit: the Anykit digital otoscope with a 4.5-inch high-definition screen and gyroscope adds professional-grade imaging to at-home monitoring, reinforcing a shift toward self-managed ear health. Macro fundamentals amplify the opportunity. India’s medical-device sector, valued at USD 11 billion in 2025, is projected to quintuple by the decade’s close, fueled by a USD 400 million production-linked-incentive plan and state-level medical-device parks. Meanwhile, an aging global population increases the prevalence of hearing disorders, placing sustained diagnostic demand on the otoscope market.
Key Report Takeaways
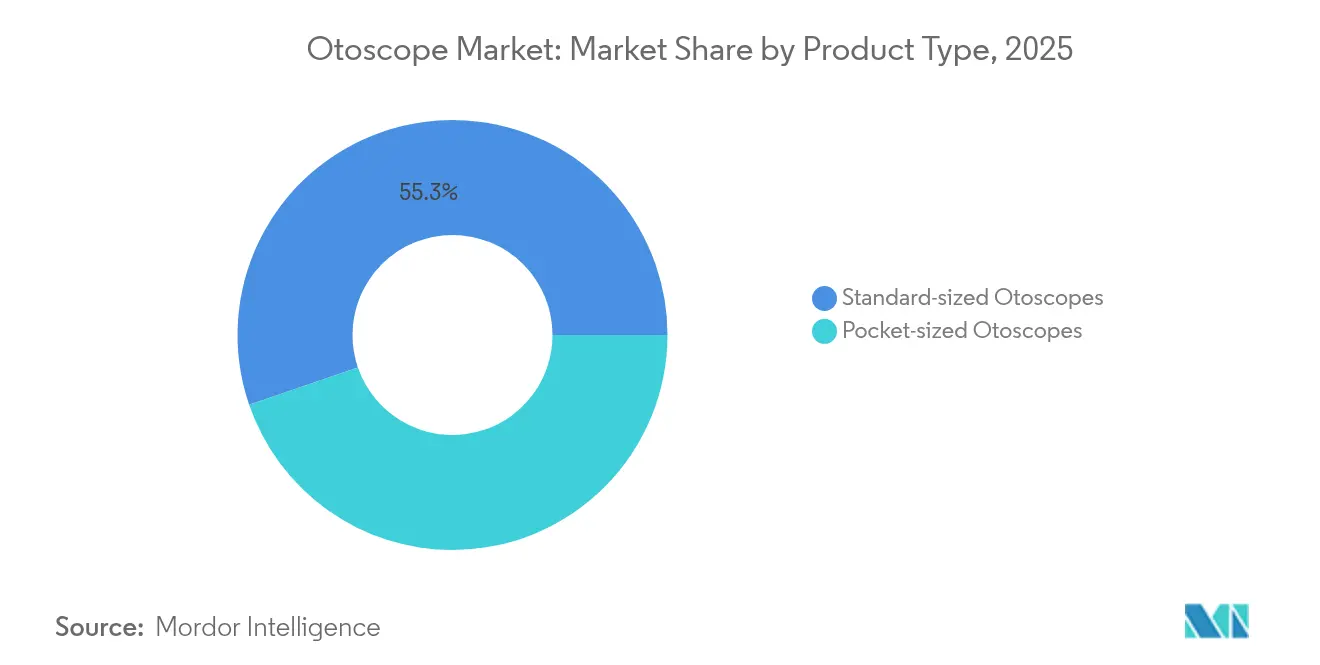
- By product type, standard-sized devices led with a 55.26% otoscope market share in 2025, while pocket variants are projected to expand at a 5.09% CAGR to 2031.
- By portability, portable units controlled 72.12% of the otoscope market size in 2025 and will grow fastest at 5.36% through 2031.
- By power source, mains-powered models held 52.88% of the otoscope market share in 2025; battery units post the quickest 4.98% CAGR over 2026-2031.
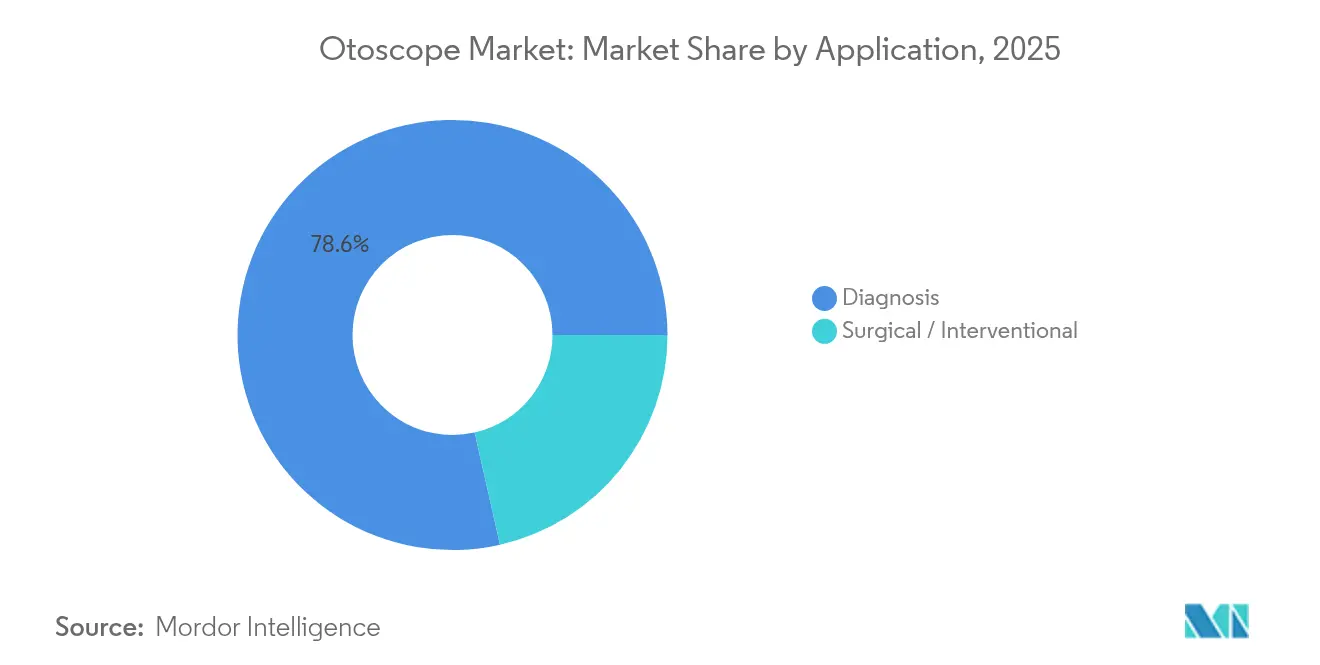
- By application, diagnostic use accounted for 78.55% of the otoscope market size in 2025, whereas the surgical segment will register a 5.49% CAGR to 2031.
- By end user, hospitals captured 62.08% of the otoscope market share in 2025, yet ENT clinics are forecast to advance at 4.72% CAGR.
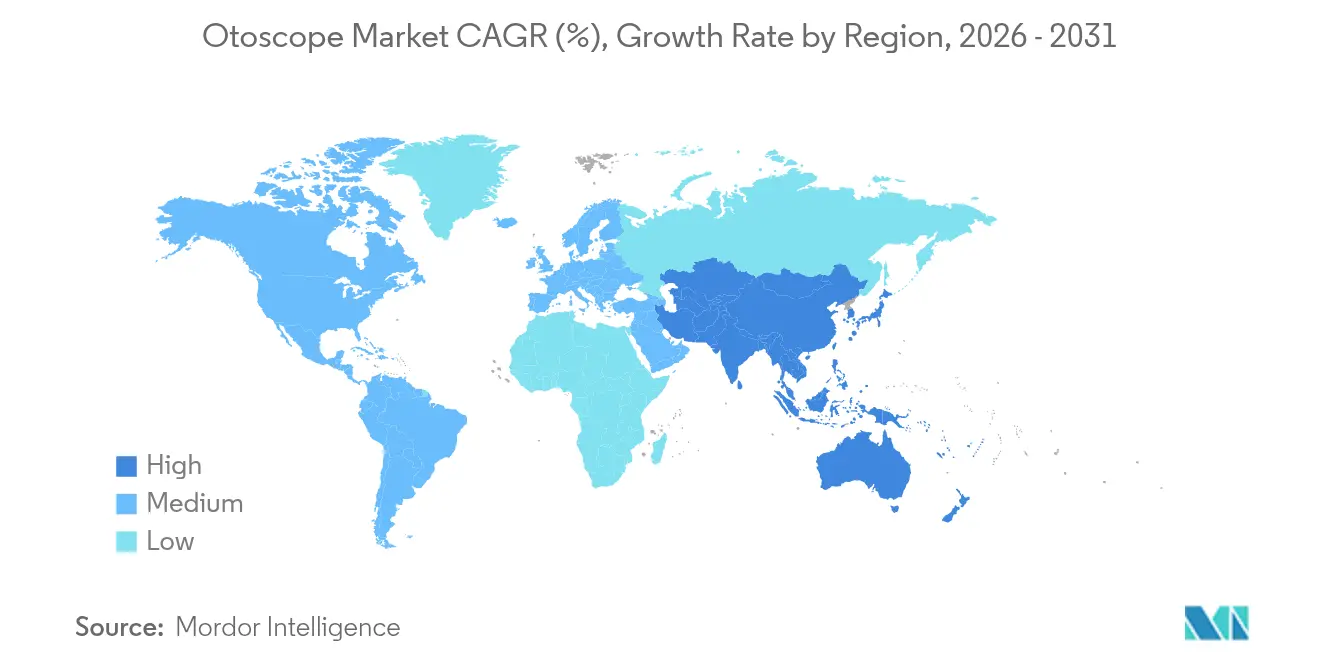
- By geography, North America dominated with 37.15% revenue share in 2025; Asia-Pacific exhibits a 5.92% CAGR from 2026-2031.
Note: Market size and forecast figures in this report are generated using Mordor Intelligence’s proprietary estimation framework, updated with the latest available data and insights as of 2026.
Global Otoscope Market Trends and Insights
Drivers Impact Analysis*
| Driver | (~) % Impact on CAGR Forecast | Geographic Relevance | Impact Timeline |
|---|---|---|---|
| Growing burden of ENT-related diseases | +1.2% | Global, higher in Asia-Pacific and Sub-Saharan Africa | Medium term (2-4 years) |
| Technological advancement in digital & video otoscopes | +1.5% | North America and Europe lead; Asia-Pacific rapid adoption | Short term (≤ 2 years) |
| Rising geriatric population-linked hearing disorders | +0.8% | Worldwide, with emphasis on North America, Europe, developed Asia-Pacific | Long term (≥ 4 years) |
| Expanding healthcare expenditure in emerging economies | +1.1% | Core in Asia-Pacific; spill-over to Middle East & Africa and Latin America | Medium term (2-4 years) |
| Tele-otoscopy adoption in primary care & remote triage | +0.9% | North America and Europe, expanding to rural Asia-Pacific | Short term (≤ 2 years) |
| School-based ear-health screening initiatives | +0.6% | Global, strongest in developing regions | Medium term (2-4 years) |
| Source: Mordor Intelligence | |||
Growing burden of ENT-related diseases
More precise otologic imaging reduces unnecessary antibiotic use by 50%, as shown with PhotoniCare’s OtoSight platform.[2] Despite pneumococcal conjugate vaccines, otitis media prevalence remains stubborn, spotlighting unmet diagnostic needs. High-definition OTO Endoscopes introduced in 2024 deliver superior visuals for chronic otitis media assessment, enhancing diagnostic accuracy at clinics such as Mallige Hospital. Healthcare authorities now link preventable childhood hearing loss to educational performance, strengthening procurement budgets for advanced otoscopes in underserved districts.
Technological advancement in digital & video otoscopes
Optical coherence tomography (OCT) enables cross-sectional tympanic-membrane imaging via the University of Southern California’s handheld device, revealing pathologies such as myringitis previously hidden from traditional scopes. Deep residual-recurrent neural networks achieve clinician-level classification of acute otitis media, underpinning AI-enhanced otoscope market growth. On the research horizon, terahertz endoscopes under development at Waseda University promise non-invasive cochlear visualization, suggesting a future leap in ear-disease management.
Rising geriatric population-linked hearing disorders
Age-related hearing loss already affects 1.5 billion individuals worldwide. Automated classifiers employing bidirectional long-short-term-memory networks reach 99.33% diagnostic accuracy, offsetting shortages of audiology professionals. Over-the-counter hearing-aid rules that took effect in 2022 have democratized assistive-device access, spurring older adults to seek professional confirmation through otoscopy, directly boosting the otoscope market.
Tele-otoscopy adoption in primary care & remote triage
Telehealth visits in the United States jumped from 1% of encounters pre-pandemic to 17% by 2023. Smartphone-based hearing tests attain 94.3% accuracy for normal hearing detection, validating mobile screening in sparsely staffed environments. Remote patient monitoring reimbursements under the U.S. Centers for Medicare & Medicaid Services (CMS) encourage clinics to fold tele-otoscopy into chronic-care programs, positioning the otoscope market for distributed growth.
Restraints Impact Analysis*
| Restraint | (~)% Impact on CAGR Forecast | Geographic Relevance | Impact Timeline |
|---|---|---|---|
| Social stigma associated with ENT disorders | –0.4% | Global, stronger in parts of Asia-Pacific and Middle East & Africa | Long term (≥ 4 years) |
| Shortage of skilled ENT professionals in low- and middle-income countries | –0.7% | Sub-Saharan Africa, rural Asia-Pacific, Latin America | Long term (≥ 4 years) |
| Regulatory delays for smartphone-connected devices | –0.3% | Worldwide, varies by regulator | Short term (≤ 2 years) |
| Supply-chain dependence on high-precision optics | –0.5% | Global, cost-sensitive economies most affected | Medium term (2-4 years) |
| Source: Mordor Intelligence | |||
Social stigma associated with ENT disorders
Cosmetic concerns slow adoption of hearing assistance in traditional societies, despite United States regulatory moves to widen over-the-counter access. Innovative designs like Nuance Audio glasses embed hearing aids into stylish frames, but uptake hinges on public‐awareness campaigns and discreet diagnostic options.
Shortage of skilled ENT professionals in LMICs
Uganda’s recent residency analysis confirmed 76% graduate employment yet highlighted urban concentration.[3] In India, doctor-to-population ratios trail World Health Organization recommendations, forcing rural clinics to rely on AI-assisted otoscopy. Telehealth eases consultant access but requires digital-literacy training and stable internet infrastructure.
*Our forecasts treat driver/restraint impacts as directional, not additive. The impact forecasts reflect baseline growth, mix effects, and variable interactions.
Segment Analysis
By Product Type: Pocket-Sized Innovation Drives Market Evolution
Standard-sized instruments controlled 55.26% of the otoscope market in 2025, reflecting clinical preference for high-end optics and durable construction. Procurement departments favor these units for high-volume environments, particularly where accessory compatibility and long-term service contracts matter. Nonetheless, pocket designs will outpace at a 5.09% CAGR, supported by primary-care mobility and community health outreach. Pocket-sized devices are gaining use in primary care and community outreach, supporting the pocket otoscope market. Portable OCT scopes from the University of Southern California bridge premium imaging with handheld convenience. Smart-phone-linked sub-segments integrate AI to deliver 93.8% diagnostic sensitivity, cutting training curves and broadening access. Supply-chain savings during a period when production costs have risen to about 20% of revenue favor compact material-efficient builds, reinforcing pocket uptake.

By Portability: Mobile Healthcare Transformation Accelerates Growth
Portable models contributed 72.12% of the otoscope market size in 2025 and will also log the fastest 5.36% CAGR. Their twin leadership position signals a structural shift toward distributed care rather than early-cycle penetration. Adoption surged when video-enabled scopes such as OtoSpec allowed real-time patient education. Battery advances narrow performance gaps with wall-mounted systems and trim installation overhead, making portable units the default choice for tele-medicine networks and school screenings.
By Power Source: Battery Technology Drives Independence
Mains-powered devices held 52.88% of the otoscope market share in 2025, reflecting established hospital workflows. Battery-operated variants, however, will widen penetration via a 4.98% CAGR through 2031. Design upgrades featuring lithium-ion packs sustain extended use while minimizing weight, critical for rural outreach vans and emergency departments during grid outages. Cybersecurity concerns also ease with self-contained battery designs that limit network exposure.
By Application: Surgical Applications Emerge as Growth Driver
Diagnostic usage comprised 78.55% of the 2025 otoscope market size, owing to routine ear examinations across care levels. The surgical category, though smaller, leads growth at 5.49% CAGR, propelled by minimally invasive procedures and high-resolution imaging. PhotoniCare’s OtoSight platform cut antibiotic scripts in half by improving intra-operative visualization, demonstrating downstream cost savings. OtoNexus’ ultrasound system, recognized by the FDA’s STeP, illustrates how new modalities expand procedural indications.
By End User: ENT Clinics Gain Momentum Through Specialization
Hospitals amassed 62.08% of otoscope market share in 2025 based on sizable capital budgets and comprehensive ENT services. Nonetheless, ENT clinics exhibit a higher 4.72% CAGR through 2031. Specialist centers leverage agility and tele-otoscopy to reach remote patients, while ambulatory surgery centers use cost-controlled settings to attract outpatient procedures. Integra LifeSciences’ USD 1 billion ENT acquisition underscores the commercial value of clinic-based networks.
Geography Analysis
North America accounted for 37.15% of 2025 revenue, buoyed by insurance coverage, standardized ENT protocols, and expedited U.S. FDA approval pathways that now include a clearer De Novo route for novel otoscopes. Canadian universal coverage embeds otoscopy in primary-care check-ups, whereas Mexico expands device import quotas to modernize public hospitals.
Asia-Pacific posts the swiftest 5.92% CAGR during 2026-2031. China is projected to spend USD 210 billion on medical devices by 2025, spurred by healthy-aging priorities and favorable reimbursement rules. India’s National Medical Devices Policy 2023 and its single-window approval system streamline licensing, though delays noted by a 2025 Parliamentary panel have driven some manufacturers to weigh relocation to Vietnam or Malaysia. Japan’s advanced physician networks, Australia’s universal system, and South Korea’s digital-health incentives round out regional momentum.
Europe sustains mid-single-digit growth despite the stricter Medical Device Regulation (MDR) EU 2017/745, which raises clinical-evidence demands and post-market scrutiny. Germany, United Kingdom, and France lead adoption, while Italy and Spain upgrade ENT suites under health-modernization grants. The European Parliament’s 2025 call for MDR revisions seeks to avoid supply shortages by setting binding conformity-assessment timelines.
Regulatory Landscape
Regulation for otoscopes continues to split between traditional optical devices and emerging software-enabled ENT analyzers. In the United States, standard/manual otoscopes are classified under 21 CFR 874.4770 (product code ERA) and are generally Class I and 510(k)-exempt, which supports broad availability across care settings while still requiring manufacturers to meet general controls. FDA activity in 2026 also highlighted tighter oversight for AI-enabled interpretation: TytoCare received a De Novo classification for an AI-enabled ENT image analyzer, creating a new Class II category under 21 CFR 874.4775 (product code SHL) with special controls that subsequent entrants can reference.
In Europe, compliance continues under Regulation (EU) 2017/745 (MDR), with 2026 actions tightening operational requirements for market access. The European Commission issued Implementing Regulation (EU) 2026/977 to set more uniform quality management and procedural requirements for notified bodies, and published updates to harmonized standards in the Official Journal during 2026. These steps reinforce the need for up-to-date technical documentation and standards mapping, while mandatory adoption steps for EUDAMED modules increase the importance of structured UDI, actor/device registration, and post-market data flows for manufacturers selling into the EU.
Value Chain Analysis
The otoscope value chain begins with upstream components and materials, then moves through precision manufacturing, regulatory-quality systems, and multi-channel distribution to hospitals, ENT clinics, and other outpatient providers. For optical and fiber-optic devices, suppliers of optical glass, LED illumination modules, and mechanical housings (brass, stainless steel, polycarbonate) remain central. For digital/video otoscopes, the bill of materials expands to include CMOS image sensors and image processing components, alongside medical-grade thermoplastic elastomers used for soft-touch grips and seals.
This mix keeps unit economics sensitive to optics labor content in traditional devices and to semiconductor availability and pricing for digital models. Manufacturing and assembly typically require high-precision alignment and inspection steps, including tight concentricity tolerances, plus validated cleaning, packaging, and traceability practices aligned to medical-device quality systems. Downstream, global brands and specialist firms rely on distributor networks, group purchasing and tender channels, and direct-to-clinic sales for connected devices that integrate with apps or IT systems. Consolidation and capacity shaping can occur at the manufacturing layer, illustrated by Spengler Group acquiring Luxamed in June 2024, which strengthened a European supply and production footprint across otoscopes and adjacent diagnostic instruments.
Competitive Landscape
The otoscope market remains moderately fragmented. Legacy manufacturers such as Heine Optotechnik, Welch Allyn, and Rudolf Riester defend share via service contracts and global distribution. Digital entrants emphasize AI, smartphone compatibility, and cloud analytics. OtoSpec’s iPhone-ready scope illustrates direct-to-provider sales that bypass hospital tenders. Olympus expanded Latin America distribution in 2024 to capture emerging-market growth, while C2Dx’s acquisition of Cook Medical ENT assets signals niche consolidation.
Academic-industry collaboration represents a pipeline accelerant. The University of Southern California’s OCT partnership and Waseda University’s terahertz research portend new visual modalities. AI developers deploy algorithms with 93.5% specificity, democratizing expert-level assessments without specialist oversight.
Supply-chain resilience shapes strategy. Firms with diversified optics suppliers and regional assembly plants mitigate geopolitical disruptions that drove component costs to 20% of revenue in 2024. This environment favors vertically integrated producers or those using modular designs that accept multiple component vendors.
Otoscope Industry Leaders
-
Wellch Allyn
-
American Diagnostic Corporation
-
Heine Optotechnik GmbH
-
Rudolf Reister GmbH
-
Sync Vision
- *Disclaimer: Major Players sorted in no particular order
Market Opportunities and Future Outlook
Clearer regulatory pathways and dedicated funding for AI-enabled ear imaging are opening whitespace beyond conventional optical upgrades. In the United States, the FDA De Novo classification for TytoCare's Tyto Insights for ENT Suite established a defined category for ENT image analyzers under 21 CFR 874.4775, creating a practical on-ramp for follow-on 510(k) submissions that build to the same special controls. This shift supports platform strategies where digital otoscopy is bundled with automated image-quality checks and decision support, while basic Class I otoscopes under 21 CFR 874.4770 continue to serve as the volume backbone for routine examinations.
Opportunities also extend into scalable primary-care and community screening workflows that reduce dependence on scarce ENT specialists. In the United Kingdom, TympaHealth secured a GBP 2 million Innovate UK loan in June 2026 to scale its AI-powered Otoscopy Assist platform for use by non-specialist practitioners, reinforcing demand for solutions that standardize image capture and triage. On the technology side, published work demonstrating on-device AI screening on microcontroller-class hardware points to lower-cost edge inference designs suited to outreach, school screening initiatives, and remote triage programs where bandwidth and IT integration constraints limit cloud-first deployments.
Recent Industry Developments
- July 2026: American Diagnostic Corporation launched the ADC at Home app to support integration with connected diagnostic devices for home monitoring. While not limited to ear examination, the update strengthens the company’s software layer and can support multi-parameter workflows that complement connected otoscopy in home and hybrid care models.
- September 2025: Baxter launched the Welch Allyn Connex 360 Vital Signs Monitor in the United States following FDA 510(k) clearance. The release reinforces connected point-of-care ecosystems where otoscope images and other measurements can be consolidated into clinical documentation and monitoring workflows.
- January 2024: Hillrom launched the Welch Allyn MacroView Plus Otoscope with wide-view optics and connectivity via the iExaminer Pro app. This product update advanced smartphone-assisted digital imaging in routine ear exams and supported patient education and tele-otoscopy workflows in primary care.
Research Methodology Framework and Report Scope
Market Definition and Coverage
This market covers the revenues generated from otoscopes used for ear examination in human healthcare settings, counted as device sales value. We include standard and pocket models as well as video-enabled otoscopes that are sold through medical distribution channels.
Scope exclusions (for clarity): We exclude large integrated ENT diagnostic towers, general endoscopy systems, and low-value smartphone clip-on accessories sold mainly as consumer gadgets.
Segmentation Overview
- By Product Type
- Standard-sized Otoscopes
- Pocket-sized Otoscopes
- By Portability
- Portable
- Wall-mounted
- By Power Source
- Battery-operated
- Mains-powered
- By Application
- Diagnosis
- Surgical / Interventional
- By End-User
- Hospitals
- ENT Clinics
- Ambulatory Surgery Centers
- Others
- Geography
- North America
- United States
- Canada
- Mexico
- Europe
- Germany
- United Kingdom
- France
- Italy
- Spain
- Rest of Europe
- Asia-Pacific
- China
- Japan
- India
- Australia
- South Korea
- Rest of Asia-Pacific
- Middle East and Africa
- GCC
- South Africa
- Rest of Middle East and Africa
- South America
- Brazil
- Argentina
- Rest of South America
- North America
Data Sources, Market Sizing, and Validation
Desk Research
Desk research was used to anchor the model in observable demand signals and realistic pricing ranges before assumptions were taken into interviews. We referred to public sources such as the World Health Organization for ear disease and hearing loss context, the US CDC for related infection burden signals, and the US FDA product classification and safety communications to understand device categories and replacement behavior.
We also reviewed sources such as the US International Trade Commission and UN Comtrade for trade flows that help sanity-check whether regional consumption trends align with import patterns, and peer-reviewed clinical journals for adoption of video otoscopy in routine diagnosis. Company annual reports, investor presentations, and reputable medical association websites were used to understand channel mixes and typical buying cycles. In addition, a paid subscription for company financials and patent databases supported targeted checks on manufacturer revenue exposure and product innovation intensity. These desk research sources are illustrative, and many additional public materials were also used for data collection, validation, and clarification.
Primary Interviews and Surveys
Primary work was done through expert interviews and structured surveys with manufacturers, distributors, and clinical users (including procurement and ENT focused practitioners) so we could validate price bands, replacement cycles, and the share split between conventional and video otoscopes. Since this is a global market, inputs were checked across key demand regions so local reimbursement behavior, clinic density, and public procurement patterns could be reflected in the final assumptions.
Distribution of primary research fieldwork respondents
| Company type | Respondent position | Region |
|---|---|---|
| Top tier: 39% | CXOs: 12% | APAC: 45% |
| Mid tier: 47% | Functional/Unit leaders: 43% | EMEA: 34% |
| Smaller Players: 14% | Managers: 45% | Americas: 21% |
Market-Sizing & Forecasting
Sizing starts with a top-down demand pool build that uses healthcare delivery signals and then converts that pool into device value through realistic usage and refresh assumptions. We reconstructed demand by linking outpatient and primary care visit intensity, ENT clinic density, pediatric population mix, and ear infection related consultation frequency to the likely number of examinations requiring an otoscope, which is then translated into unit needs and value using price bands.
To keep the totals grounded, results were corroborated with selective bottom-up approximations, including sampled average selling price by product class (conventional versus video) and a roll-up of supplier and channel checks in priority countries. Where direct unit visibility was limited, gaps were handled by using proxy indicators such as device replacement cycles, facility counts, and trade flow directionality, followed by an adjustment step based on what interviewees reported as practical purchasing behavior.
For forecasting, scenario analysis was used, with a base case that reflects expected growth in clinical visits, gradual mix shift toward video otoscopy, and normal price progression rather than aggressive discounting. The forward curve was stress-tested by varying two or three drivers at a time, and then the final outlook was aligned to expert consensus on adoption pace and replacement timing.
Data Validation & Update Cycle
Before finalizing, our estimates are cross-checked against independent signals like trade movement direction, reasonable per-facility device counts, and implied spend per provider, so outliers can be flagged early. When a variance shows up, the assumptions behind it are rechecked, and the interview loop is reopened when the gap looks material.
A multi-step analyst review is followed so arithmetic, scope rules, and growth logic are consistent across regions and time periods. Reports are refreshed annually, and interim updates are triggered when meaningful events occur, such as policy changes, major product shifts, or sudden price movements. Right before delivery, a fresh pass is completed to ensure the numbers reflect the latest available public information and validated assumptions.
Mordor Intelligence's Otoscope Market Size Measured Against Other Published Estimates
Published market sizes for otoscopes can look far apart even when everyone is trying to measure the same thing, because the product boundary and the valuation point are not always treated the same way. Differences in base year, currency conversion timing, and how video otoscopes are blended with conventional models also tend to widen the spread.
In practice, the biggest gaps usually come from scope additions like bundled ENT diagnostic systems, counting consumer smartphone attachments as devices, or using retail pricing instead of manufacturer level revenue, and those choices can move the total up quickly. The table also reflects timing differences, since some sources anchor on 2024 or 2025, while this study uses 2026 as the current size year, and the model keeps the otoscope-only invoice value consistent, a treatment applied by Mordor Intelligence.
Benchmark comparison
| Source | Market Size | Gaps in Research Methodology |
|---|---|---|
| Mordor Intelligence | USD 215.41 M (2026) | |
| Global Consultancy A | USD 189.03 M (2024) | Uses an earlier base year and can mix in broader device groupings around ear exam workflows, which affects comparability when price progression and mix shift are applied from a different starting point. |
| Industry Publisher B | USD 179.00 M (2024) | Applies a lower growth curve and may rely more on reported sales summaries without fully validating replacement cycles and the conventional versus video mix by region, which can compress the implied spend level. |
Taken together, the spread is mainly explained by year selection, what is counted as an otoscope product, and whether pricing is treated at invoice level or closer to retail. By keeping the inputs traceable to clinical use signals, price bands, and replacement behavior, the estimate stays repeatable and easier for decision-makers to adjust for their own scope choices.
Key Questions Answered in the Report
What is the current size of the otoscope market?
The otoscope market is valued at USD 215.41 million in 2026 and is projected to reach USD 264.81 million by 2031.
Which region holds the largest otoscope market share?
North America leads with 37.15% revenue share in 2025, driven by advanced healthcare infrastructure and early-phase regulatory approvals.
Which segment is growing fastest within the otoscope market?
Portable, battery-operated otoscopes are expanding at a 5.36% CAGR due to telehealth expansion and point-of-care needs.
How are AI tools influencing otoscope diagnostics?
Deep-learning models boost diagnostic sensitivity to 93.8% and specificity to 93.5% for acute otitis media, enabling accurate assessments without specialist oversight.
What regulatory changes are impacting new otoscope launches?
The FDA’s streamlined 510(k) pathway and De Novo classifications shorten approval cycles, while Europe’s MDR has lengthened conformity-assessment timelines for novel devices.