
Osmometers Market Size and Share
Market Overview
| Study Period | 2020 - 2031 |
|---|---|
| Market Size (2026) | USD 159.28 Million |
| Market Size (2031) | USD 192.79 Million |
| Growth Rate (2026 - 2031) | 3.89 % |
| Fastest Growing Market | Asia-Pacific |
| Largest Market | North America |
| Market Concentration | Medium |
Major Players *Disclaimer: Major Players sorted in no particular order Image © Mordor Intelligence. Reuse requires attribution under CC BY 4.0. | |
Osmometers Market Analysis by Mordor Intelligence
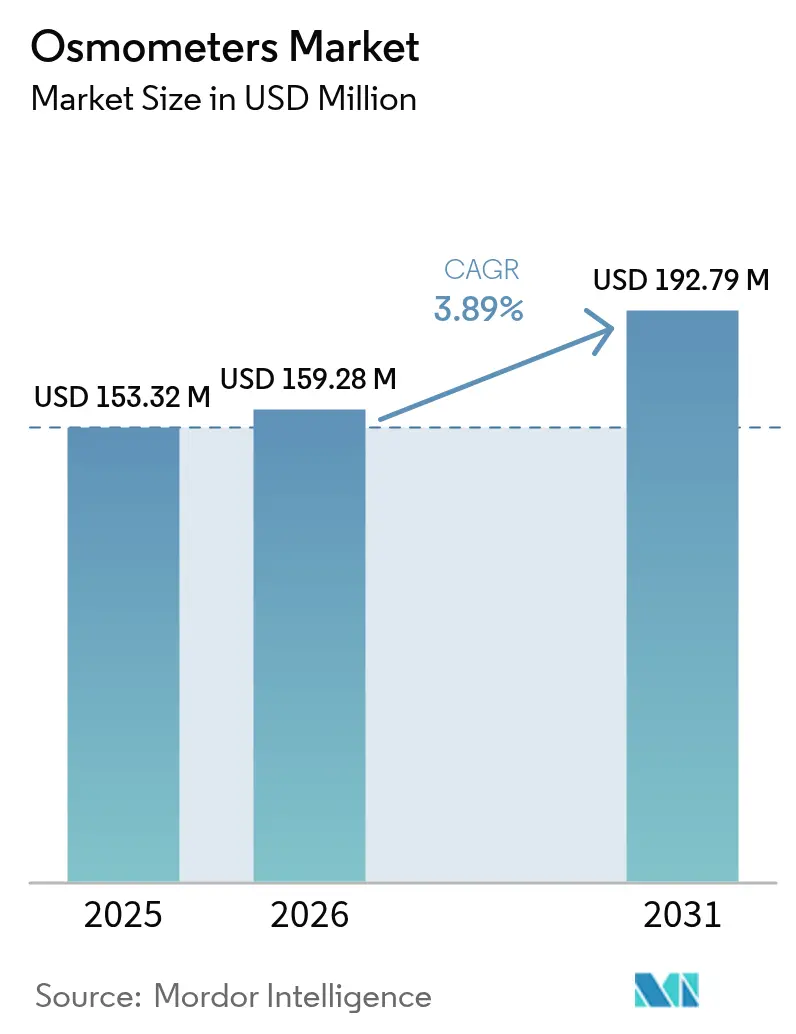
The osmometers market size is expected to grow from USD 153.32 million in 2025 to USD 159.28 million in 2026 and is forecast to reach USD 192.79 million by 2031 at 3.89% CAGR over 2026-2031. Demand is buoyed by laboratory automation, stricter compliance rules and biopharma’s tilt toward high-concentration biologics, even as device approvals take longer under the European Union Medical Device Regulation (EU MDR). Strategic combinations—such as Advanced Instruments’ pending USD 2.2 billion purchase of Nova Biomedical—underline an industry pivot toward integrated analytical platforms able to navigate complex global regulations. Meanwhile, the new EU rule that forces manufacturers to pre-alert regulators six months before supply interruptions is reshaping risk-management playbooks for every major supplier. In North America, continued clinical infrastructure investment supports stable replacement demand, while Asia-Pacific’s modernization push drives above-trend unit growth and fuels competition from impedance-based, point-of-care (POC) newcomers.
Key Report Takeaways
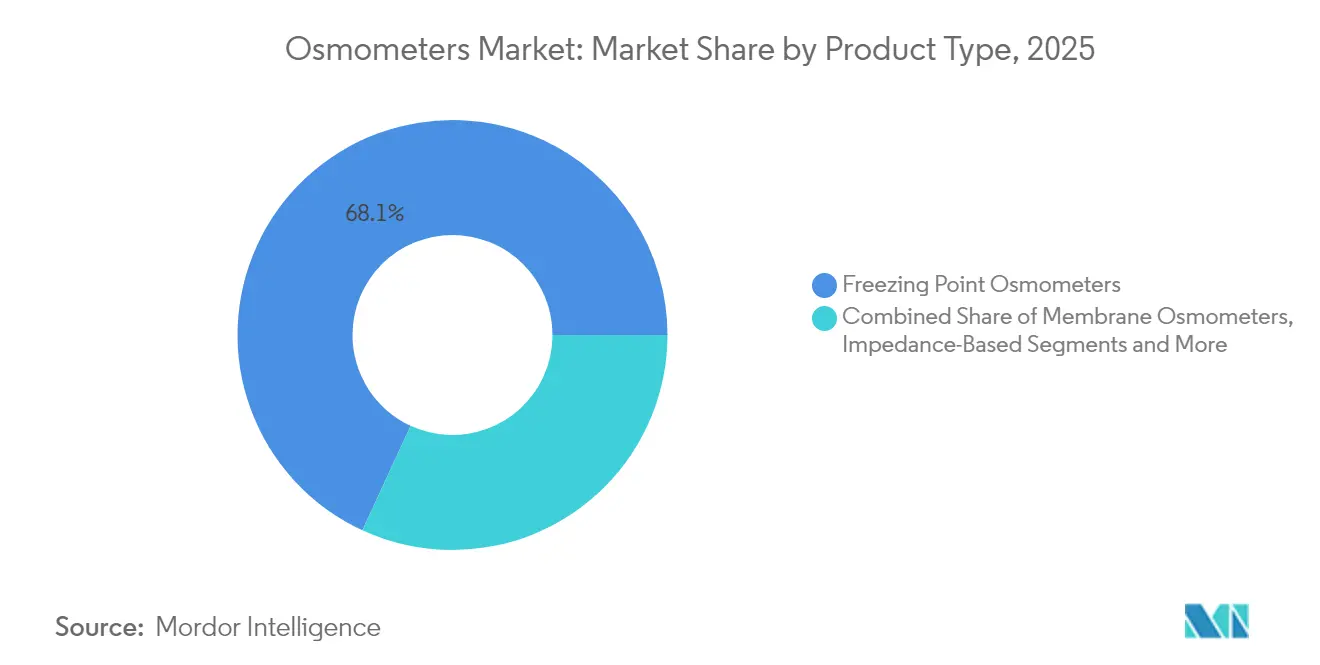
- By product type, freezing point instruments led with 68.12% of the osmometers market share in 2025; impedance-based systems are on course to expand at a 7.29% CAGR to 2031.
- By sampling capacity, single-sample units commanded 59.74% of the osmometers market size in 2025, whereas multi-sample models are projected to post an 7.64% CAGR through 2031.
- By application, clinical testing retained 52.88% share of the osmometers market in 2025, but pharmaceutical and biotech use-cases are forecast to rise at an 7.92% CAGR through 2031.
- By end user, hospitals accounted for 46.08% share in 2025; biopharma manufacturers are expected to record a 6.39% CAGR to 2031.
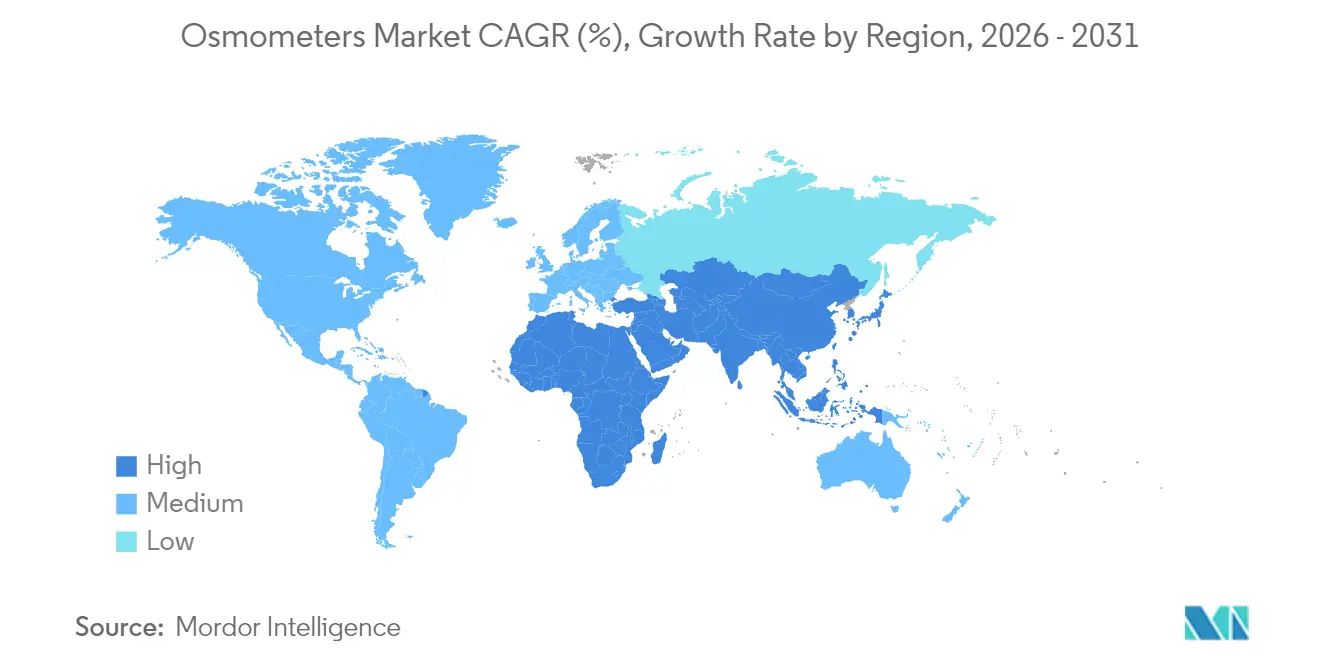
- By geography, North America captured 37.35% of the osmometers market size in 2025, while Asia-Pacific is advancing at a 7.41% CAGR to 2031.
Note: Market size and forecast figures in this report are generated using Mordor Intelligence’s proprietary estimation framework, updated with the latest available data and insights as of 2026.
Market Trends and Insights
Drivers Impact Analysis of Osmometers Market*
| Driver | (~) % Impact on CAGR Forecast | Geographic Relevance | Impact Timeline |
|---|---|---|---|
| Technological advancements & automation | +1.2% | Global (early North America & EU) | Medium term (2-4 years) |
| Growing R&D spend & disease burden | +0.8% | Global (developed markets) | Long term (≥ 4 years) |
| Biopharma shift to high-concentration biologics | +1.1% | North America & EU, spreading to APAC | Medium term (2-4 years) |
| Portable impedance-based devices for home renal care | +0.7% | APAC core, spill-over to MEA | Long term (≥ 4 years) |
| Regulatory push for in-process osmolality testing | +0.9% | EU & North America, with APAC following | Short term (≤ 2 years) |
| LIS-integrated QA in food & beverage plants | +0.5% | EU & North America | Medium term (2-4 years) |
| Source: Mordor Intelligence | |||
Technological Advancements & Automation
European laboratories are adopting fully automated osmometry workcells that link directly with analytical LC-MS, chemistry analyzers and laboratory information systems, shrinking manual steps and minimizing cross-contamination risks. A province-wide CoreLIMS roll-out in Northern Ireland has shown how seamless integration allows real-time osmolality data to flow into blood-bank and microbiology modules, improving traceability across 1,200 sample points per day. Vendors now position “connected” osmometers that generate HL7-formatted results in under 60 seconds, a capability that resonates with hospitals chasing zero-waste, high-throughput operations. The osmometers market is thus witnessing higher average selling prices tied to software, cyber-security updates and remote diagnostics bundles. Adoption is sharpest in North America’s core reference labs, but EU-based networks are narrowing the gap through region-funded digital health programs.
Growing R&D Spend & Disease Burden
Global R&D outlays in advanced therapies push osmolality to the front line of process analytics, with recent trials showing adeno-associated virus titers jump 22% when producers orchestrate timed osmolality shifts mid-culture. Chronic kidney disease prevalence, now topping 9% of the EU adult population, heightens need for decentralized kidney-function screens that depend on rapid urine osmometry. Nova Biomedical’s CE-marked creatinine/eGFR meter pairs osmolarity and kidney markers in a two-minute test, enabling rural physicians to triage patients without central lab support. High disease burden therefore amplifies the osmometers market’s clinical installed base and shifts procurement criteria toward devices that blend speed, analytical depth and ergonomic design.
Biopharma Shift To High-Concentration Biologics
As mAb concentrations approach 250 mg/mL, freezing-point instruments suffer “failure-to-freeze” artifacts, triggering longer cycle times and reruns that squeeze batch release schedules.[1] Vapor-pressure and dual-method platforms now achieve coefficient of variation under 1.5% at viscosities beyond 30 cP, helping formulation chemists meet subcutaneous delivery targets without diluting actives. European contract development and manufacturing organizations are standardizing on in-line osmometry inside continuous bioreactors, turning osmolality into a release-by-exception parameter and spurring upgrades that lift unit sales across mid-capacity lines.
Portable Impedance-Based Devices For Home Renal Care
Wearable bioimpedance patches that read extracellular resistance in 30-second bursts have correlated within ±2% of dialysate ultrafiltration volumes in multicenter hemodialysis trials.[2] Because sensors use microliter sample volumes, they dovetail with tele-nephrology apps, permitting continuous hydration alerts that address fluid overload risk between clinic visits. Prototype urine-dipstick add-ons have registered 89.9% accuracy versus standard freezing-point osmometers, signalling readiness for over-the-counter expansion.[3] Asia-Pacific innovators, backed by digital-health grants, are first movers, but EU MedTech sandbox schemes are accelerating cross-border CE marking.
Restraints Impact Analysis of Osmometers Market*
| Restraint | (~) % Impact on CAGR Forecast | Geographic Relevance | Impact Timeline |
|---|---|---|---|
| Intrinsic accuracy/throughput limits | -0.6% | Global (high-volume labs) | Medium term (2-4 years) |
| Shortage of skilled operators | -0.4% | EU & North America | Long term (≥ 4 years) |
| Cryoscopic sensor supply-chain risks | -0.5% | Global (EU regulatory burden) | Short term (≤ 2 years) |
| Emerging non-contact T-measurement alternatives | -0.3% | North America & EU | Long term (≥ 4 years) |
| Source: Mordor Intelligence | |||
Intrinsic Accuracy/Throughput Limits
Freezing-point cycles surpass three minutes when protein loads exceed 150 mg/mL, throttling daily capacity inside mega-labs that already run 800 million tests annually. Vapor-pressure devices improve accuracy but require long equilibration; thus they seldom slot into STAT benches where 15-minute turnaround is non-negotiable. This trade-off steers some buyers to non-contact refractive sensors, eroding addressable share in rapid-response niches.
Shortage Of Skilled Operators
Vacancy rates for certified chemistry technologists in EU reference labs climbed to 18% in 2025, a gap worsened by curriculum lag on instrument automation. Training a new technician on calibration, error codes and probe maintenance for a multi-sample osmometer takes 160 hours, an investment many mid-sized hospitals find hard to spare.
*Our forecasts treat driver/restraint impacts as directional, not additive. The impact forecasts reflect baseline growth, mix effects, and variable interactions.
Osmometers Market Segment Analysis
By Product Type:
Freezing Point Dominance Faces Impedance InnovationFreezing point instruments retained 68.12% of 2025 osmometers market share, underpinned by decades of clinical trust and clear regulatory acceptance. Impedance systems, though only a fraction of today’s osmometers market size, are growing at 7.29% CAGR thanks to portable designs that suit critical care, dialysis and veterinary applications. Vapor-pressure units occupy a narrow high-concentration biologics niche where their performance premium offsets slower cycle times. Manufacturers now bundle maintenance contracts, remote firmware pushes and auto-calibration features to keep compliance costs predictable.
Technology updates echo industry moves toward connectivity and service. Impedance devices achieve 95.5% accuracy with sub-20 µL samples—critical for newborn screening and animal health—and plug directly into Bluetooth-enabled patient apps, expanding the osmometers industry footprint in decentralized setting. Freezing-point leaders respond by embedding barcode scanners, reagent-lot traceability and AI-based quality control alerts that slash out-of-spec reruns. Vapor-pressure suppliers focus on stainless-steel wetted paths and 21 CFR Part 11 audit trails that attract gene-therapy CDMOs.

By Sampling Capacity:
Multi-Sample Automation Drives EfficiencySingle-sample analyzers held 59.74% of the osmometers market in 2025 as clinics and emergency rooms favored lower purchase prices and easy workflows. Yet multi-sample versions, climbing at 7.64% CAGR, now ship with robotic load drawers and LIS hubs that process up to 90 tubes per hour—features North American mega-labs deem essential for value-based reimbursement targets. The osmometers market size for high-throughput units should therefore outpace historical averages over the forecast as hospitals redesign core labs around modular automation.
European sites adopt 24-place racks with smartphone-style touchscreens, allowing one technologist to oversee parallel electrolyte, glucose and osmolality tests. In rural health centers, compact single-sample devices persist, but vendors refresh them with cloud logging, simplified QC and one-button maintenance. This balanced demand keeps both categories relevant yet sharply differentiated on throughput and connectivity.
By Application:
Pharmaceutical Growth Outpaces Clinical StabilityClinical diagnostics anchored 52.88% of the osmometers market share in 2025, a base likely to grow modestly as population aging and chronic-disease screening expand test menus. Pharmaceutical and biotech labs, however, will deliver an 7.92% CAGR, lifting their slice of osmometers market size because continuous manufacturing and high-concentration formulations require in-line osmolality monitoring to preserve product integrity. Industrial food testing gains momentum under stricter EU isotonic beverage rules, while academic labs propel exploratory work on hybrid sensing.
The pharmaceutical surge concentrates in gene therapy and next-generation antibodies where precise osmolality control correlates with yield and potency. Hospitals expand POC menus, integrating creatinine-plus-osmolality meters that trim discharge times after contrast imaging. Together these trends diversify revenue streams and cushion cyclical swings in capital budgets.

By End User:
Biopharma Manufacturers Accelerate AdoptionHospitals preserved a 46.08% stake in 2025, reflecting entrenched lab infrastructure and broad chemistry panels that include osmolality. Biopharma plants, expanding at 6.39% CAGR, upgrade to hygienic, in-line probes as regulators intensify scrutiny of critical quality attributes, keeping osmolality front and center. Diagnostic service chains buy mid-tier benchtop units to service satellite clinics, while universities pilot impedance wearables, ensuring innovation flow.
FDA rules on laboratory-developed tests broaden the validation burden, steering drug makers toward turnkey platforms with cradle-to-grave data integrity. Hospitals, facing staffing shortages, lean on auto-QC and e-learning modules to shorten technologist onboarding, shaping future purchase criteria.
Geography Analysis
North America, APAC and EMEA Osmometers Market
North America kept 37.35% of global osmometers market share in 2025 as reimbursement stability and high test volumes underpinned steady upgrades. The region benefits from the deepest base of CLIA-certified labs and a dense biopharma corridor that values process analytical technology. Asia-Pacific, compounding at 7.41% CAGR, benefits from national health insurance expansions, aggressive biologics capacity build-outs and rising adoption of bedside testing in China, India and South Korea. Europe, while hampered by regulatory bottlenecks, leverages automation uptake and strong vaccine pipelines to maintain competitive parity. Middle East and Africa remain nascent but secure double-digit unit growth where hospital build programs pair with local device assembly incentives.
APAC and Europe Osmometers Market
Government subsidies in Singapore, Korea and China tilt capex toward high-throughput, 21 CFR Part 11-ready osmometers that future-proof regulatory filings. EU MDR’s protracted certification cycles delay some product launches, but also create white-space for nimble suppliers with pre-notified-body strategies. Across all regions, demand gravitates toward platforms that compress workflow, integrate data streams and reduce total cost of ownership.
Regulatory Landscape
Clinical osmometers fall under established in-vitro diagnostic general-controls frameworks, with ongoing oversight concentrated on post-market performance and traceability. In the United States, clinical-use osmometers are classified under FDA 21 CFR 862.2730 (Product Code JJM) as Class I devices and are generally 510(k)-exempt, while related osmolality test systems fall under 21 CFR 862.1540, which reduces premarket friction but keeps manufacturers accountable to quality systems, labeling, and adverse-event reporting expectations.
Across major jurisdictions, enforcement activity continues to shape supplier risk-management and field-action readiness. Examples include a March 2024 Class 2 recall involving Advanced Instruments OsmoPRO MAX and Health Canada recall activity affecting the same platform, alongside other Class 2 recall actions spanning calibration materials (Nipro Technical Services, initiated December 2025) and broader clinical chemistry consumables (Siemens Healthineers epoc BGEM BUN test cards, initiated April 2026). In Europe and Switzerland, field safety corrective action (FSCA) mechanisms (for example, Swissmedic safety notice workflows) reinforce similar expectations around vigilance, corrective actions, and supply continuity planning, consistent with the report context of EU MDR-driven certification and compliance pressure.
Value Chain Analysis
The osmometer value chain begins with upstream precision components and calibration inputs, then moves through instrument design and manufacturing, software integration, distribution, and lifecycle service. Key inputs include high-precision sensing elements (for freezing-point systems, cryoscopic measurement modules such as thermistors and cooling elements), fluidics and consumables, and NIST-traceable calibration standards that support defensible results in clinical and regulated biopharma environments. Manufacturers increasingly differentiate at the system-integration layer by packaging LIS connectivity (for example, HL7-formatted outputs), audit trails, and remote diagnostics, which shifts value capture toward software and service contracts rather than hardware alone.
Downstream, the primary buyers are hospitals, diagnostic and laboratory centers, and biopharma manufacturers, with purchasing influenced by compliance needs, including data integrity and validation expectations, as well as staffing constraints that favor automation. Distributors and regional service partners remain important for installation qualification, preventive maintenance, and uptime commitments, particularly as multi-sample workcells and higher-throughput labs expand. Standards and professional bodies influence operating practices and method harmonization, while regulatory classification (such as US FDA Class I controls for clinical osmometers under 21 CFR 862.2730 and osmolality test systems under 21 CFR 862.1540) anchors quality, documentation, and post-market surveillance requirements that then carry through supplier qualification and service workflows.
Competitive Landscape
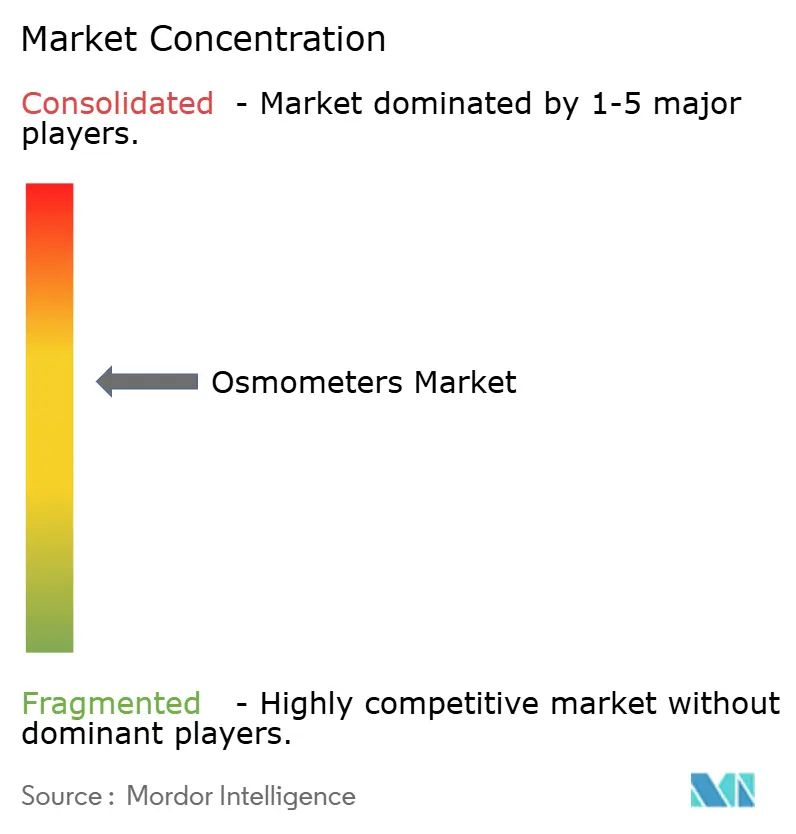
The osmometers market is moderately fragmented but consolidating fast as players pursue integrated analytics portfolios. Advanced Instruments’ USD 2.2 billion takeover of Nova Biomedical unlocks a combined installed base exceeding 35,000 analyzers across 100 countries, pooling freezing-point pedigree with rapid POC technology. Bruker’s USD 942 million move for ELITechGroup adds clinical chemistry and molecular testing breadth that complements osmometry workflows. Thermo Fisher’s USD 4.1 billion purchase of Solventum’s filtration arm signals a tilt toward full upstream-to-downstream process analytic suites, embedding osmolality within PAT toolboxes.
Market leaders differentiate through automation expertise, SaaS-style service contracts and regulatory consultancy that demystifies EU MDR and US FDA filings. Anton Paar courts beverage and pharma users with Ultratap 500 Series tap-density aids that share common UI and calibration protocols with its PBA osmometer line. Niche entrants target impedance sensors for home renal care, banking on consumer-grade electronics to unseat legacy benchtop incumbents. Competitive intensity thus hinges on speed of portfolio integration, strength of digital ecosystems and agility in meeting evolving regional compliance timelines.
Osmometers Industry Leaders
-
Advanced Instruments LLC
-
Precision Systems Inc.
-
ELITechGroup
-
ARKRAY, Inc.
-
Nova Biomedical
- *Disclaimer: Major Players sorted in no particular order
Osmometers Market Companies Covered in this Report
- Advanced Instrumentations
- Precision Systems
- ELITech Group
- Arkray
- ASTORI TECNICA
- KNAUER Wissenschaftliche Geräte GmbH
- Löser Messtechnik
- SanoTec GmbH
- TearLab Corporation
- Mechatronics Instruments BV
- Gonotec GmbH
- Shanghai Medical Instruments Co.
- Labnics Equipment
- Thermo Fisher Scientific
- Beijing Hiyi Technology Co., Ltd.
- Merck
- Bio-Techne
- Anton Paar
- Precision Systems Science Co. Ltd.
Market Opportunities and Future Outlook
Opportunity concentrates where osmometry becomes more embedded in automated and regulated workflows rather than functioning as a standalone benchtop measurement. Hospitals and large laboratory networks are actively linking instruments to LIS and broader automation lines to reduce manual steps and strengthen traceability, supporting demand for connected osmometers with rapid turnaround, barcode-driven workflow, and cybersecurity and remote-service bundles. The Northern Ireland CoreLIMS rollout referenced in the report context provides a concrete example of how broader digital lab infrastructure can pull osmolality data into enterprise workflows, creating space for vendors that offer validated connectivity, middleware compatibility, and service models that address technician shortages.
Biopharma process analytics is another whitespace area, especially in high-concentration biologics where traditional freezing-point methods can produce operational artifacts at very high protein loads, driving interest in alternative methods and dual-method platforms tied to in-process testing and data-integrity expectations. Consolidation and portfolio integration also support near-term commercialization, following Advanced Instruments' acquisition of Nova Biomedical in July 2025, which expands its platform across clinical diagnostics and biopharma analytics and enables cross-selling of osmometry alongside adjacent analyzers and consumables. This environment favors suppliers that can document performance verification, streamline validation, and reduce fragmented procurement through integrated platforms spanning instruments, calibration standards, and compliant data outputs.
Recent Industry Developments in Osmometers Market
- May 2026: ELITechGroup (a Bruker company) inaugurated an Operations Excellence Center in Turin, Italy. The site strengthens manufacturing and operational capabilities that support ELITechGroup's diagnostics portfolio, including freezing-point osmometry offerings and associated service delivery. Expanded operational infrastructure helps shorten lead times and improve quality management responsiveness as customers intensify requirements around uptime and traceability.
- January 2025: Advanced Instruments launched the OsmoPRO MAX automated freezing-point osmometer, designed to enhance clinical laboratory productivity. Features such as flow-through technology for direct sampling from primary tubes align with lab automation priorities and reduce manual handling steps. The launch supports vendors competing on workflow integration and throughput in hospital and reference lab environments.
- February 2024: Bruker completed the acquisition of ELITechGroup, expanding Bruker’s clinical diagnostics footprint. The transaction broadened Bruker’s access to routine diagnostics workflows where osmometry is used, and added a platform with established channels in clinical labs. This consolidation increased competitive pressure on standalone instrument suppliers by combining broader diagnostic portfolios under a larger corporate ecosystem.
Osmometers Market Report Scope and Research Methodology
Market Definition and Coverage
This market covers instruments and related system sales used to measure osmolality or osmotic pressure of liquid samples for clinical testing, pharmaceutical and biotech quality checks, and lab research, across the full purchasing cycle from new installs to replacement buying.
Scope exclusions: Used or refurbished units sold in secondary channels, routine lab consumables, and standalone service contracts are excluded when they are priced separately from the instrument sale.
Segments Covered in This Report
- By Product Type
- Freezing Point Osmometers
- Vapor Pressure Osmometers
- Membrane Osmometers
- Impedance-Based (Others)
- By Sampling Capacity
- Single-sample Osmometers
- Multi-sample Osmometers
- By Application
- Clinical
- Pharmaceutical & Biotech
- Industrial & Food QC
- Research & Academic
- By End User
- Hospitals
- Diagnostic & Laboratory Centers
- Biopharma Manufacturers
- Research Institutes
- By Geography
- North America
- United States
- Canada
- Mexico
- Europe
- Germany
- United Kingdom
- France
- Italy
- Spain
- Rest of Europe
- Asia-Pacific
- China
- Japan
- India
- Australia
- South Korea
- Rest of Asia-Pacific
- Middle East and Africa
- GCC
- South Africa
- Rest of Middle East and Africa
- South America
- Brazil
- Argentina
- Rest of South America
- North America
Data Sources, Market Sizing, and Validation
Desk Research
Desk work starts with mapping where osmolality testing happens, then linking those use cases to instrument buying behavior across clinical labs and life sciences manufacturing. We rely on public sources such as US FDA device and safety communications, CDC laboratory guidance, OECD and World Bank macro indicators, WHO health system statistics, and trade and customs releases from agencies such as the USITC and UN Comtrade to capture equipment flow signals.
To keep the model practical, we review reported clinical lab volumes, pharma manufacturing activity indicators, and regulatory change notes alongside company annual reports, investor decks, and science journals that discuss osmolality methods and adoption. We also use paid subscriptions for company financials and intelligence, patent databases, and shipment level import and export datasets to cross-check supplier presence and regional movement. These examples are not exhaustive, and other public references were used for data collection, validation, and research clarification.
Primary Interviews and Surveys
Primary inputs come from structured interviews and surveys with hospital lab buyers, diagnostic lab operators, pharma and biotech quality teams, and distribution and service partners who can describe pricing and replacement cycles they see in practice. Because the market is global, we balance feedback across APAC, EMEA, and the Americas so regional utilization patterns and procurement constraints are reflected, and we re-contact select experts when a key assumption changes late in the build.
Distribution of primary research fieldwork respondents
| Company type | Respondent position | Region |
|---|---|---|
| Top tier: 25% | CXOs: 15% | APAC: 38% |
| Mid tier: 60% | Functional/Unit leaders: 34% | EMEA: 35% |
| Smaller Players: 15% | Managers: 51% | Americas: 27% |
Market-Sizing & Forecasting
Sizing is built using a top-down approach where healthcare and life science activity levels are translated into an instrument demand pool, then split into new purchases and replacements by region. The starting blocks include the installed base proxy in key end users, typical replacement timing, and procurement triggers, and these are aligned with observed adoption of automated testing in laboratories.
To keep the model grounded, we corroborate totals with selective bottom-up approximations, such as checking a set of supplier price bands and mapping likely unit volumes by end user, then adjusting for coverage gaps where public signals are thinner. Inputs that matter most include average selling price movement by configuration, mix shifts between freezing point and vapor pressure systems, lab testing throughput growth, pharma and biotech production expansion, and regulatory-driven quality control practices that increase osmolality checks.
For forecasting, scenario analysis is used because demand is sensitive to laboratory capex cycles and to how quickly automation spreads in routine workflows. Assumptions are stress-tested with primary feedback on procurement lead times and replacement deferment, then the final growth path is locked.
Data Validation & Update Cycle
Validation is done through repeated checks across independent signals, so model outputs are compared with trade flow direction, disclosed revenue cues, and the implied unit math from price bands and replacement cycles. When a region shows an abnormal spike or drop, we re-check the drivers and review the assumptions again by another analyst before sign-off.
Reports are refreshed annually, and interim updates are triggered when material events show up, such as a regulatory shift, a major product change, or an unusual pricing move. Right before delivery, we run a fresh scan of recent public updates and re-validate the key inputs so clients receive the latest updated view.
Mordor Intelligence's Osmometers Market Estimate Compared With Other Published Estimates
Published market values for osmometers can look far apart because sources do not always count the same revenue items, the same year, or the same buying settings. Differences also come from how pricing is handled for higher automation models, and how much replacement demand versus new installations is assumed.
Service contracts and calibration-only revenue sit outside Mordor Intelligence's scope for this market, which can keep the total lower than estimates that bundle instruments with ongoing service and accessories. Another gap driver is the base year and forecast window, since some publishers anchor on 2024 values and shorter horizons, while others use a later current year with a different pricing and mix assumption. Currency timing and how regional demand weights are set using hospital labs versus pharma QC can also move the final number in either direction.
Benchmark comparison
| Source | Market Size | Gaps in Research Methodology |
|---|---|---|
| Mordor Intelligence | USD 159.28 M (2026) | |
| Global Consultancy A | USD 99.80 M (2024) | Uses an earlier base year and a different forecast window, and the estimate can tilt lower when replacement timing and ASP uplift from automation are modeled more conservatively. |
| Market Publisher B | USD 98.82 M (2024) | Anchored on 2024 sizing with a long-range projection, and the total may reflect a narrower counted revenue set for instruments and a different end user mix weighting across regions. |
The comparison shows that the spread is mainly explained by what is counted as instrument revenue, which year is treated as current, and how price and replacement cycles are translated into units. Our process stays traceable because each step ties back to clear demand indicators, price bands, and cross-checks that can be repeated when new data points appear.
Key Questions Answered in the Report
How big is the Osmometers Market?
The Osmometers Market size is expected to reach USD 159.28 million in 2026 and grow at a CAGR of 3.89% to reach USD 192.79 million by 2031.
What is the current size of the osmometers market?
The osmometers market stands at USD 159.28 million in 2026 and is on track to reach USD 192.79 million by 2031.
Which product type dominates the osmometers market?
Freezing point instruments lead with 68.12% share in 2025, although impedance-based devices are the fastest-growing category at a 7.29% CAGR.
Why is Asia-Pacific the fastest-growing region for osmometers?
Healthcare modernization, expanding biopharmaceutical capacity and rapid adoption of point-of-care testing push Asia-Pacific to a 7.41% CAGR, outpacing other regions.
How is regulation affecting osmometry demand?
EU MDR certification delays and new FDA guidelines mandating in-process osmolality tests drive laboratories to upgrade to compliant, automated instruments.
What are the key growth applications for osmometers?
Beyond core clinical use, high-concentration biologics manufacturing, cell-gene therapy production and isotonic beverage quality control are major growth engines.