
Orthopedic Power Tools Market Size and Share
Market Overview
| Study Period | 2020 - 2031 |
|---|---|
| Market Size (2026) | USD 1.84 Billion |
| Market Size (2031) | USD 2.16 Billion |
| Growth Rate (2026 - 2031) | 4.09 % |
| Fastest Growing Market | Asia Pacific |
| Largest Market | North America |
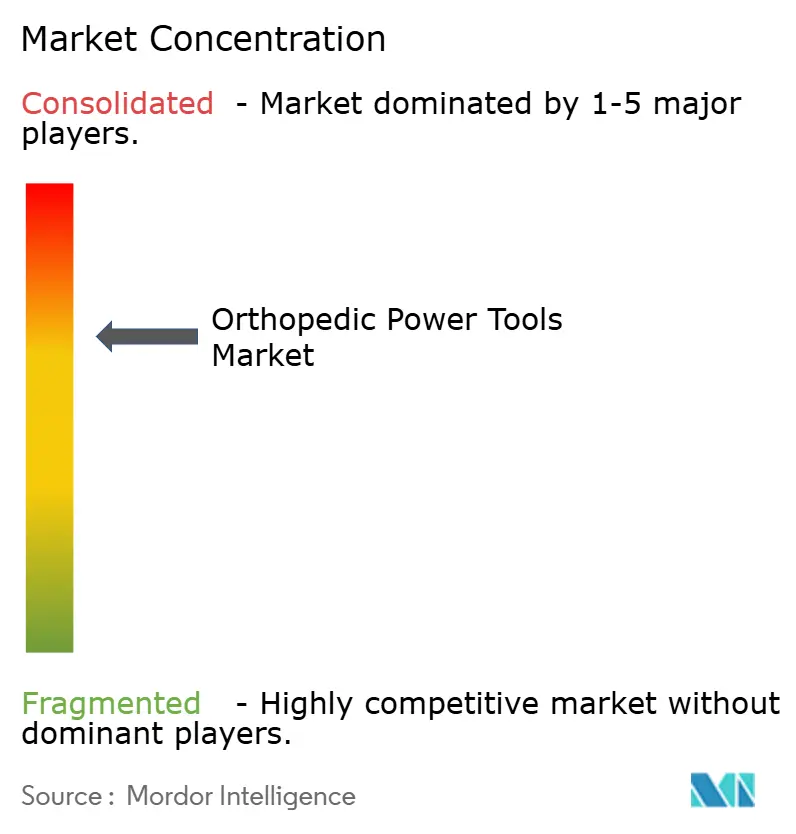
| Market Concentration | Medium |
Major Players *Disclaimer: Major Players sorted in no particular order Image © Mordor Intelligence. Reuse requires attribution under CC BY 4.0. | |
Orthopedic Power Tools Market Analysis by Mordor Intelligence
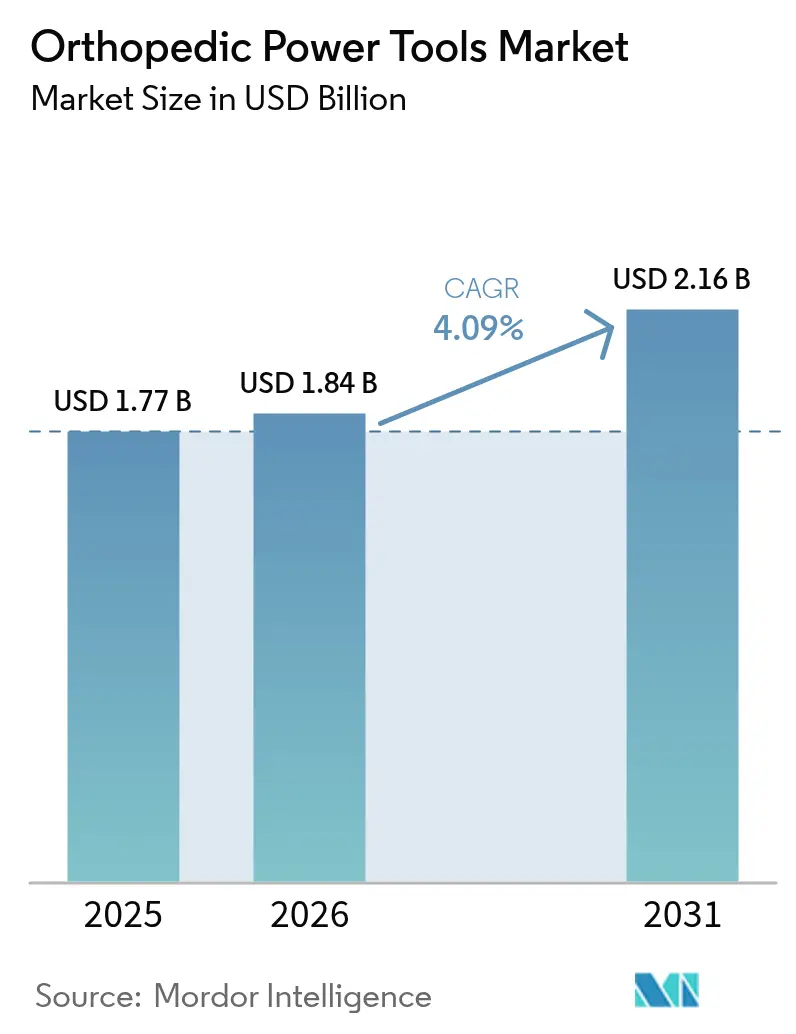
The Orthopedic Power Tools Market size was valued at USD 1.77 billion in 2025 and estimated to grow from USD 1.84 billion in 2026 to reach USD 2.16 billion by 2031, at a CAGR of 4.09% during the forecast period (2026-2031).
Growth is propelled by a significant and rising musculoskeletal disease burden alongside the steady shift toward battery-powered platforms that improve surgical efficiency. North America keeps its leadership on the back of high procedure volumes and rapid uptake of digital operating-room technologies, while Asia-Pacific is advancing fastest as health-care infrastructure scales to meet an aging population. Demand is further lifted by ambulatory surgical centers (ASCs) that favor compact, cordless devices tailored for short-stay orthopedic interventions. Competitive intensity centers on continuous upgrades that align handpieces with robotics and navigation, yet purchasing hesitancy persists where high capital outlays and sterilization validation costs strain budgets.
Key Report Takeaways
- By device type, large-bone power tools captured 31.25% orthopedic power tools market share in 2025, whereas high-speed tools are growing at a 5.52% CAGR through 2031.
- By technology, battery-powered systems held 40.10% share of the orthopedic power tools market size in 2025 and are expanding at 4.66% CAGR to 2031.
- By usage modality, reusable platforms dominated with 70.10% revenue share in 2025; single-use handpieces are advancing at 5.03% CAGR through 2031.
- By end-user, hospitals commanded 61.40% share of the orthopedic power tools market size in 2025, while ASCs are progressing at a 6.06% CAGR through 2031.
- By region, North America led with 52.60% revenue share in 2025; Asia-Pacific is forecast to post the highest 6.43% CAGR to 2031.
Note: Market size and forecast figures in this report are generated using Mordor Intelligence’s proprietary estimation framework, updated with the latest available data and insights as of 2026.
Market Trends and Insights
Drivers Impact Analysis of Orthopedic Power Tools Market*
| Driver | (~) % Impact on CAGR Forecast | Geographic Relevance | Impact Timeline |
|---|---|---|---|
| Global musculoskeletal disease burden elevating surgical volumes | +1.4% | Global; highest in North America and Europe | Medium term (2-4 years) |
| Ambulatory & day-case orthopedics driving compact tool demand | +1.3% | North America, Europe, rising in Asia-Pacific | Short term (≤ 2 years) |
| Robotics and navigation convergence accelerating power-tool upgrades | +1.1% | North America, Europe, high-income Asian markets | Medium term (2-4 years) |
| Rise in aging population across the world | +0.8% | Global; strongest in Japan, Western Europe, North America | Long term (≥ 4 years) |
| Preference for single-use sterile handpieces to curb SSIs | +0.6% | Global; pronounced in outpatient centers | Short term (≤2 years) |
| E-bike & road-traffic trauma surge boosting large-bone volumes | +0.5% | Urban Asia-Pacific, Europe | Medium term (2-4 years) |
| Source: Mordor Intelligence | |||
Global Musculoskeletal Disease Burden Elevating Surgical Volumes
Growing prevalence of osteoarthritis and trauma injuries is widening the addressable pool of joint replacement candidates. Annual hip and knee arthroplasty volumes are projected to reach 2.25 million by 2050, requiring surgeons to double caseload capacity to keep pace.[1]World Health Organization, “Musculoskeletal Conditions,” who.int The orthopedic power tools market demand intensifies because powered saws and drills are indispensable for every replacement procedure. The trend is particularly visible in the United States, where procedure throughput is supported by expansive reimbursement coverage and widespread adoption of enhanced-recovery pathways. Similar momentum is building in Western Europe as clinical guidelines lower age thresholds for elective joint reconstruction.
Ambulatory & Day-Case Orthopedics Driving Compact Tool Demand
Shifting volumes toward ASCs unlocks fresh requirements for lightweight, cordless instruments that can turn over rooms quickly. Medicare now reimburses total shoulder arthroplasty in ASCs, reinforcing the business case for same-day discharge.[2]American Academy of Orthopaedic Surgeons, “2025 Medicare ASC Final Rule,” aaos.org Cost benchmarking shows 35% lower total episode spend in ASCs compared with hospital outpatient departments, incentivizing payers and surgeons alike. The Orthopedic power tools market benefits through heightened sales of battery systems that do not rely on central air lines. Device makers are augmenting propositions with AI-enabled case management to shave minutes off setup and sterilization cycles.
Robotics + Navigation Convergence Accelerating Power-Tool Upgrades
Robotic platforms for knee and hip reconstruction now demand handpieces capable of sub-millimeter accuracy and digital hand-shake with console software. This alignment is spurring replacement purchases as surgeons switch from legacy pneumatic drills to smart, sensor-equipped motors. The orthopedic power tools market sees cross-selling pull-through when hospitals invest in robots and then standardize on tool ecosystems from the same vendor. Early adopters report shorter learning curves and improved component alignment, solidifying retention rates for integrated hardware-software suites.
Rise in Aging Population Across the World
By 2030, one in six people will be 60 years or older, raising prevalence of degenerative joint disease that progresses to surgical indication. Demand peaks in Japan, Western Europe, and North America where life expectancy is longest. The orthopedic power tools market gains additional lift because elderly patients often have comorbidities that favor minimally invasive options, a setting in which precise, low-vibration drills improve operative safety. Device makers allocate R&D toward ergonomic grips and noise reduction to accommodate longer case times in this demographic.
Restraints Impact Analysis of Orthopedic Power Tools Market*
| Restraint | (~) % Impact on CAGR Forecast | Geographic Relevance | Impact Timeline |
|---|---|---|---|
| High capital and service costs versus manual alternatives | −0.6% | Global; strongest in emerging markets | Medium term (2-4 years) |
| Stringent sterilization / reprocessing validation requirements | −0.4% | Global; pronounced in North America and Europe | Short term (≤ 2 years) |
| Lithium-ion battery disposal regulations raising lifecycle costs | −0.3% | Europe, North America | Medium term (2-4 years) |
| Reprocessing validation standards slowing approvals | −0.2% | Global; device regulators | Short term (≤2 years) |
| Source: Mordor Intelligence | |||
High Capital & Service Costs Versus Manual Alternatives
Premium electric and battery sets carry acquisition prices that can challenge budgets of smaller facilities, especially in lower-income regions. Annual maintenance outlays run 15–20% of initial spend, adding life-cycle pressure. The orthopedic power tools market therefore faces elongated replacement cycles where buyers weigh payback time against rapid feature obsolescence. Surveys of spine practices indicate 77% cite purchase expense as the leading barrier to adopting powered or robotic adjuncts. Emerging financing models such as leasing and per-click usage fees attempt to mitigate sticker shock yet remain nascent.
Stringent Sterilization / Reprocessing Validation Requirements
Global regulators have tightened protocols for cleaning complex lumened handpieces after multiple outbreaks linked to retained bioburden. The 2024 CDC guideline mandates validated cycles for each device and mandates traceable documentation.[3]Centers for Disease Control and Prevention, “2024 Guideline for Disinfection and Sterilization in Healthcare Facilities,” cdc.gov Compliance drives investment in automated washers and dedicated staff, elevating per-procedure overhead. The Orthopedic power tools market feels the friction most acutely in centers without central sterile departments, resulting in delayed turnovers or preference for single-use variants. Manufacturers respond with sealed motor housings and autoclavable batteries to simplify workflows yet validation audits remain resource-heavy.
*Our forecasts treat driver/restraint impacts as directional, not additive. The impact forecasts reflect baseline growth, mix effects, and variable interactions.
Orthopedic Power Tools Market Segment Analysis
By Device Type:
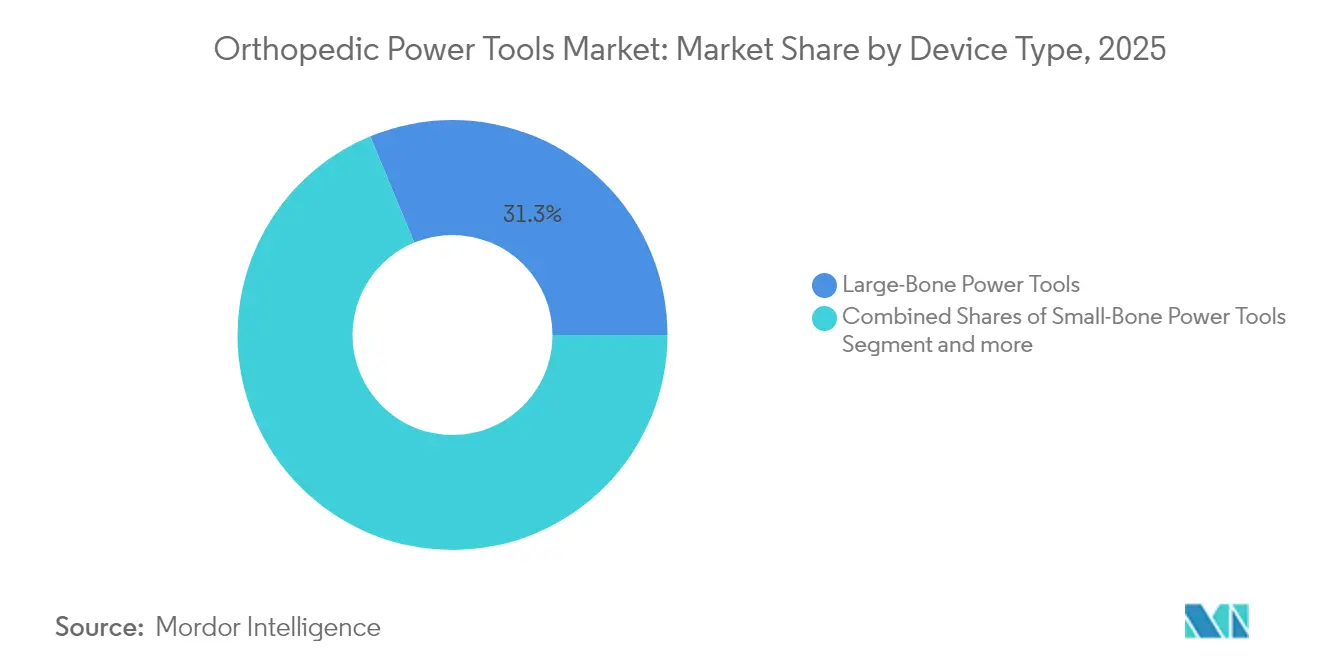
High-Speed Innovations Propel Precision SurgeryLarge-bone instruments accounted for 31.25% of the orthopedic power tools market in 2025, supported by hip and knee arthroplasty demand. High-speed devices, however, register the quickest 5.52% CAGR because minimally invasive decompressions and arthroscopic techniques rely on finely balanced, high-RPM handpieces. Revenue acceleration is reinforced by rising sports injury reconstructions that favor burrs capable of bone removal without thermal necrosis. Manufacturers embed torque-feedback sensors that auto-adjust revolutions per minute to safeguard cortical bone integrity.
Surgeons performing delicate hand and foot repairs continue to rely on small-bone drills that deliver micro-torque at low vibration. The orthopedic power tools market sees stable volumes here as outpatient centers schedule multiple cases daily. Orthopedic reamers also contribute sizable sales because every hip replacement demands medullary preparation. Product design prioritizes chip-evacuation flutes that reduce intramedullary pressure, thereby lowering fat embolism risk during press-fit femoral implantations.


By Technology:
Battery Systems Redefine Operating-Room MobilityBattery platforms held 40.10% orthopedic power tools market share in 2025 and are projected to remain the largest growth engine with 4.66% CAGR from 2026-2031. Freedom from hoses simplifies room layout and shortens setup time by several minutes, a meaningful efficiency in high-throughput ASCs. Current lithium-ion packs support full-day case lists, and new wireless charging trays keep batteries topped between procedures without breaking sterility.
Electric corded units still occupy a firm niche in complex revision surgeries that can exceed three hours, where unwavering power is critical. Pneumatic models, once dominant, now contract as air infrastructure dwindles and hospitals target noise reduction mandates. Hybrid modular systems appear in high-acuity centers that value redundancy, allowing transition between power sources if line voltage fluctuates. Continuous improvement in pack energy density is a pivotal theme guiding the Orthopedic power tools market through 2031.
By Usage Modality:
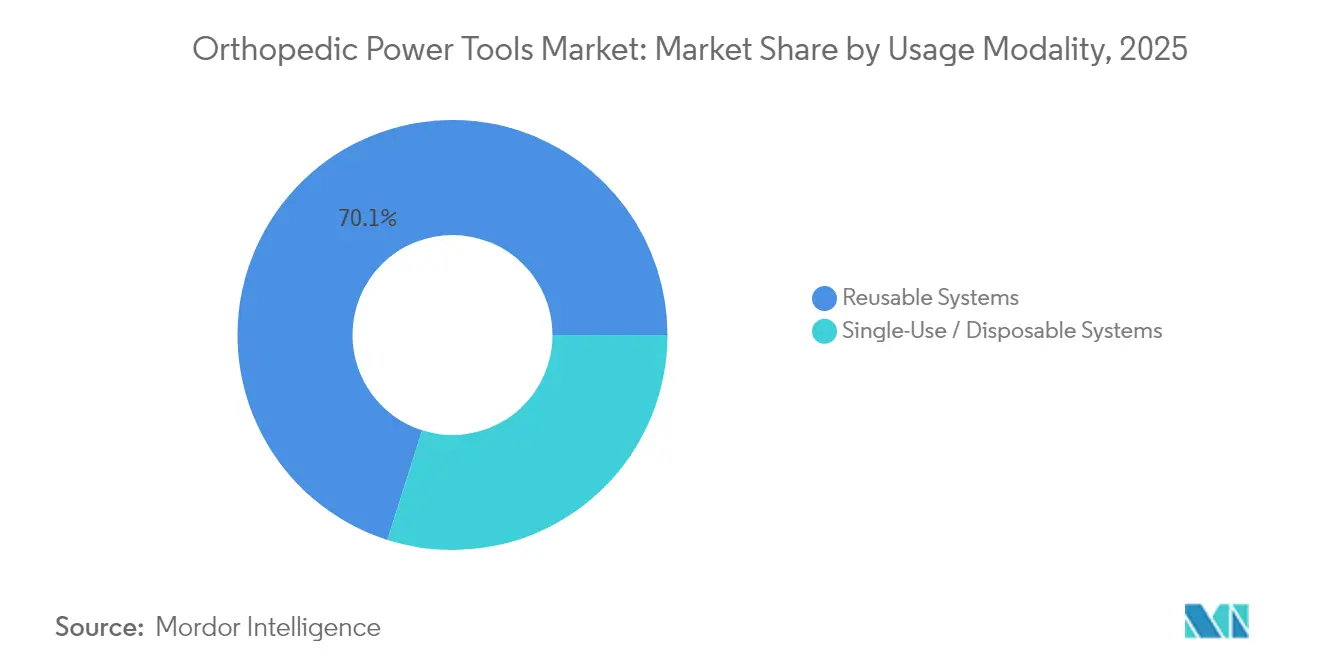
Reusable Dominance Meets Single-Use MomentumReusable handpieces represented 70.10% revenue in 2025 due to long-standing procurement norms and perceived cost amortization over multiple cycles. Their future, however, hinges on resolving sterility-assurance hurdles that intensify under new regulatory scrutiny. Hospitals investing in robotic suites often favor reusable drills that integrate with digital planning software, reinforcing installed-base entrenchment.
Single-use motors expand at 5.03% CAGR driven by infection-control priorities and the absence of reprocessing expenses. Health-economic analyses reveal that disposable sets can undercut reusable total cost when factoring in labor and sterilizer depreciation. The orthopedic power tools market responds with polymer-shelled, pre-sterilized units whose performance now approaches that of conventional metal equivalents. Adoption accelerates in rural centers lacking sophisticated sterile departments and in humanitarian missions where portability and assured sterility are paramount.
By End-User:
ASCs Shape Compact-Tool EngineeringHospitals retained 61.40% of the orthopedic power tools market in 2025 because tertiary centers handle complex trauma and revision cases that demand comprehensive equipment carts. Integrated supply agreements with major vendors ensure rapid access to upgrades and service coverage. Product lines aimed at teaching hospitals now include RFID asset tracking, which feeds analytics on tool-use patterns to inform capital planning.
Ambulatory surgical centers record a 6.06% CAGR as insurers and patients embrace outpatient total joints. The Orthopedic power tools market sees higher turnover frequency in ASCs, prompting vendors to design lightweight casings and quick-swap battery locks, enabling room-to-room mobility without downtime. Specialty orthopedic clinics, while smaller in spend, often pilot novel handpieces such as noise-dampened drills targeted at pediatric populations, creating valuable feedback loops for iterative R&D.
Geography Analysis
North America Orthopedic Power Tools Market
North America generated 52.60% of the orthopedic power tools market revenue in 2025, anchored by high implant volumes and early rollouts of digital operating rooms. United States procedural counts of 790,000 knees and 544,000 hips underscore a stable baseline demand. Favorable reimbursement, including the 2025 CMS ASC final rule that broadens device pass-through payments, further sustains uptake of premium battery drills.
Europe Orthopedic Power Tools Market
Europe follows with a strong share supported by universal health coverage and rigorous device safety standards. Policy makers emphasize green procurement, steering buyers toward reusable casing systems whose life-cycle assessments show 85% lower carbon footprints than disposable packaging. The Orthopedic power tools market in Western Europe also benefits from joint registries that track revision rates, nudging hospitals toward precision machines paired with navigation to minimize alignment errors.
APAC Orthopedic Power Tools Market
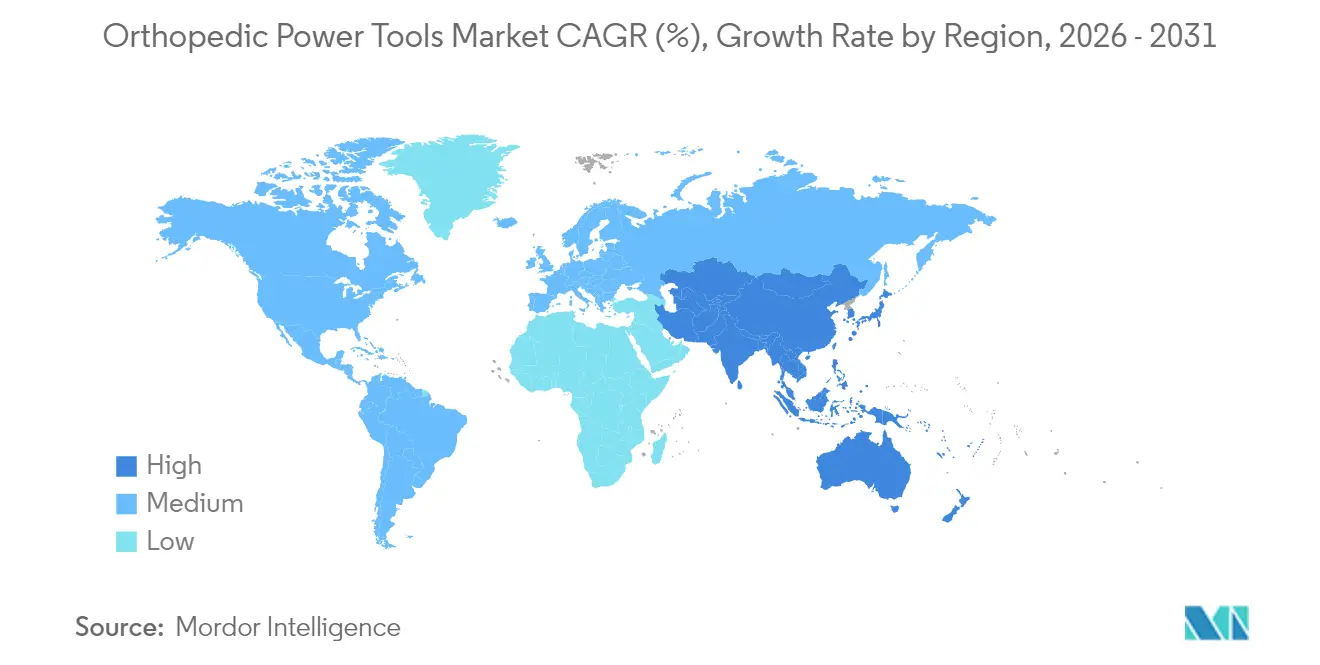
Asia-Pacific stands out as the fastest-growing region at 6.43% CAGR through 2031. Japan’s super-aged society drives volume, while China’s tier-2 cities add capacity as musculoskeletal disorders rise with urban living. Battery adoption gains momentum in metropolitan hospitals; in contrast, pneumatic prevalence stays high in secondary facilities where capital budgets remain tight. The Orthopedic power tools market also captures opportunity in India and Southeast Asia, where private orthopedic chains invest in ASC models patterned on North American practices.
MEA and South America Orthopedic Power Tools Market
A smaller yet strategic opportunity exists in the Middle East & Africa, where Gulf states modernize surgical suites within new medical cities. Governmental funding drives large bulk tenders that favor vendors offering robust after-sales service. South America sees incremental gains as public insurers stretch budgets for trauma care; local assembly partnerships can offset import tariffs, improving price competitiveness for battery platforms.

Regulatory Landscape
Orthopedic power tools are regulated as medical devices under mature but tightening quality and post-market requirements in the two largest compliance reference markets, the United States and the European Union. In the EU, the Medical Device Regulation (MDR) 2017/745 applies, requiring manufacturers to maintain a quality management system, conduct clinical evaluation, and meet safety and performance requirements across the device lifecycle. For powered handpieces and their accessories, this tends to increase documentation and evidence burdens throughout product maintenance and updates.
In the United States, orthopedic power tools fall under FDA medical device controls, including 21 CFR Part 888 for orthopedic devices, and many products are commonly routed through Class II pathways such as 510(k) where applicable. A key 2026 compliance milestone is the FDA Quality Management System Regulation (QMSR), effective February 2, 2026, which brings US quality-system expectations more closely in line with ISO 13485, affecting design controls, supplier management, and complaint handling for global tool platforms. In parallel, EU implementation activity continues through updates to harmonized standards references, including an Implementing Decision published in June 2026, which shapes how manufacturers demonstrate conformity for electromedical and related standards used in powered surgical systems.
Competitive Landscape
The orthopedic power tools market is moderately concentrated, with Stryker, Johnson & Johnson (DePuy Synthes), and Zimmer Biomet collectively holding a substantial revenue share. Stryker’s Orthopaedics division posted USD 9.01 billion in 2024 sales and continues to leverage its Mako robotic ecosystem to create pull-through for System 9 wireless-charging drills. Johnson & Johnson advances an integrated approach, aligning VELYS robotics and AI-guided workflow software to capture hospital capital budgets and ASC contracts simultaneously.
Strategic roadmaps reveal a pivot from pure hardware toward data-connected platforms. Vendors embed telemetry in handpieces to log usage metrics, enabling predictive maintenance and asset optimization dashboards for supply-chain managers. Partnerships with cloud analytics firms further differentiate offerings by promising evidence-based insights on surgical efficiency and implant survivorship. Disruptive entrants attack niche sub-segments such as single-use motors, deploying subscription bundles that include disposal logistics, thereby easing waste-handling burdens for smaller facilities.
Mergers and acquisitions remain a central expansion lever. Stryker’s announced purchases of Inari Medical and Vertos Medical illustrate appetite for portfolio broadening into minimally invasive spine and vascular access tools. Zimmer Biomet invests in automation for implant preparation, exemplified by its HAMMR automated hip impaction system that shortens operating time. Across the orthopedic power tools market, competitive advantage tilts toward players that can integrate hardware, robotics, and analytic services into coherent value propositions that address surgeon efficiency, payer cost goals, and patient outcomes.
Orthopedic Power Tools Industry Leaders
ConMed Corporation
Stryker Corporation
Zimmer Biomet
B Braun Melsungen AG
Medtronic
- *Disclaimer: Major Players sorted in no particular order
Orthopedic Power Tools Market Companies Covered in this Report
- Stryker
- Johnson & Johnson
- Zimmer Biomet
- Medtronic
- Conmed
- B. Braun
- Arthrex
- Smiths Group
- De Soutter Medical Ltd.
- MicroAire
- Ortho Life Systems Pvt. Ltd.
- Brasseler USA
- NSK Nakanishi Inc.
- Acumed LLC (OsteoMed)
- Adeor Medical
- Peter Brehm GmbH
- Medicon eG
- Shanghai Bojin Medical
- IndoSurgicals Private Limited
- Zimmer Surgical (Exactech)

Market Opportunities and Future Outlook
The convergence of powered instrumentation and robotics continues to create a practical white-space for vendors that can offer a single ecosystem covering console software, handheld power, and procedure-specific attachments. Stryker demonstrated this direction in 2026 with a limited market release of the Mako RPS handheld robotic power system for total knee and a subsequent launch of TPX HD for small bone procedures, pairing higher-performance drilling with software-enabled customization through its CORE 2 console. For buyers, these releases feed procurement discussions around standardizing tool fleets that connect to digital workflows (asset tracking, torque profiling, and service analytics) rather than purchasing stand-alone handpieces.
Ambulatory surgical centers (ASCs) remain a commercial expansion lane because their operating model favors compact, cordless systems that simplify room turnover and reduce reliance on central air infrastructure. In 2025, battery-powered systems already represented 40.10% share, while reusable systems accounted for 70.10% revenue, leaving room for differentiated offerings that lower reprocessing burden without forcing a complete move to disposables. Manufacturers that package batteries, attachments, and data-enabled consoles together with service and sterilization workflow support are targeting adoption in both hospital standardization efforts and ASC-led preferences for lightweight, portable platforms.
Recent Industry Developments in Orthopedic Power Tools Market
- June 2026: Stryker launched TPX HD, a premium small bone power tool positioned for demanding orthopedic use cases such as revisions and trauma. The system added software-linked customization via I.D. Touch on the CORE 2 console, supporting differentiated performance and workflow integration as facilities standardize on connected platforms.
- July 2025: Zimmer Biomet announced a definitive agreement to acquire Monogram Technologies for about USD 177 million to expand its robotics portfolio. The move strengthens the strategic pull-through between robotic platforms and the powered instrumentation used alongside them, influencing bundled capital decisions in orthopedics.
- June 2025: CONMED implemented upgrades to its Hall Titan Large Bone System under a Hall Power Advancement Initiative, focusing on design and manufacturing process enhancements. The update targets durability and performance expectations in high-volume large-bone procedures, supporting competitive positioning in reusable large-bone tool fleets.


Orthopedic Power Tools Market Report Scope and Research Methodology
Market Definition and Coverage
For this study, the orthopedic power tools market covers powered surgical instruments used mainly in orthopedic procedures to cut, drill, ream, saw, or drive fixation, along with tool-specific attachments and consumable accessories that are sold with these systems.
Scope exclusions: Refurbished units, short-term rentals, and veterinary-only power tools are excluded from the market totals.
Segments Covered in This Report
- By Device Type
- Large-Bone Power Tools
- Small-Bone Power Tools
- High-Speed Power Tools
- Orthopedic Reamers
- Surgical Drills
- Surgical Saws
- Accessories (Blades, Burs, Batteries)
- By Technology
- Electric-Powered Systems
- Battery-Powered Systems
- Pneumatic-Powered Systems
- Hybrid Modular Systems
- By Usage Modality
- Reusable Systems
- Single-Use / Disposable Systems
- By End-User
- Hospitals
- Ambulatory Surgical Centers
- Specialty Orthopedic Clinics
- By Geography
- North America
- United States
- Canada
- Mexico
- Europe
- Germany
- United Kingdom
- France
- Italy
- Spain
- Rest of Europe
- Asia-Pacific
- China
- Japan
- India
- Australia
- South Korea
- Rest of Asia-Pacific
- Middle East & Africa
- GCC
- South Africa
- Rest of Middle East & Africa
- South America
- Brazil
- Argentina
- Rest of South America
- North America
Data Sources, Market Sizing, and Validation
Desk Research
Desk research was used to build the starting structure of the market, and then to set realistic boundaries for what is inside the scope. We mainly screened public sources such as CDC procedure statistics, OECD health data, World Bank demographics, UN Comtrade trade flows for relevant instrument categories, and peer-reviewed orthopedic surgery journals for trends in procedure mix and clinical adoption.
After that, we reviewed company filings, investor presentations, product literature, regulator and hospital procurement notices, and reputable medical press coverage to understand typical system pricing logic and replacement cycles. When needed, we also used a paid subscription for company financials and intelligence, plus patent databases to check technology direction and timing. These desk sources are not exhaustive, and many other public references were used for cross-checks, clarification, and validation.
Primary Interviews and Surveys
Primary work focused on interviews and structured surveys with stakeholders across the value chain, including manufacturers, distributors, orthopedic surgeons, OR managers, and hospital procurement teams. For a global market like this, inputs were gathered across APAC, EMEA, and the Americas, so we could check assumptions on adoption patterns, typical selling prices, and replacement timing across different care settings.
Respondent input also helped clarify how often attachments and dedicated consumables are purchased alongside handpieces and consoles, and which procurement cycle drivers matter most in hospital capital budgeting.
Distribution of primary research fieldwork respondents
| Company type | Respondent position | Region |
|---|---|---|
| Top tier: 36% | CXOs: 12% | APAC: 44% |
| Mid tier: 48% | Functional/Unit leaders: 36% | EMEA: 31% |
| Smaller Players: 16% | Managers: 52% | Americas: 25% |
Market-Sizing & Forecasting
Market sizing was built using a top-down approach where procedure volumes and care-site activity are translated into tool demand, then converted into value using typical system and accessory price points. Because different procedures use tools differently, we adjusted the demand pool using practical inputs such as the mix of trauma versus elective cases, the share of powered versus manual usage for key steps, battery versus pneumatic installation patterns, and typical replacement and service-life cycles for handpieces and consoles.
To keep the totals grounded, we ran selective bottom-up checks through supplier revenue signals, channel feedback on average selling prices, and volume-to-value sampling for high-usage applications. Forecasting used scenario analysis anchored to expected surgery growth, aging population trends, elective procedure normalization, and purchasing cycle timing, then refined using what experts expect for pricing movement and hospital capital budgets. Where direct accessory splits were not available, we used conservative attachment-rate assumptions, then re-tested those assumptions in interviews before finalizing the model.
Data Validation & Update Cycle
Validation was done in several steps so the numbers do not rely on one single input. We compared model outputs against independent signals such as procedure growth, installed base direction, and import and export movement for relevant instrument groups, and then reviewed any large variances before sign-off.
If an outlier was found, the driver assumptions were revisited and we re-contacted relevant experts to confirm what changed in pricing, adoption, or purchasing behavior. Reports are refreshed annually, and interim updates are made when material events occur that can shift demand or pricing. Before delivery, we do a final pass to make sure the market view reflects the most recent updates available.
Mordor Intelligence's Orthopedic Power Tools Market Size Compared Against Other Published Estimates
Published estimates for orthopedic power tools often vary because the market boundary is not defined the same way, and because different teams choose different base years and pricing points. In practice, the biggest splits come from whether accessories are counted, how refurbished and rental activity is treated, and whether values are measured at manufacturer level or at later points in the supply chain.
By checking procedure-linked demand pools and refreshing ASP and accessory attachment assumptions through interviews, Mordor Intelligence keeps the count focused on new, in-scope systems and dedicated accessories while avoiding value inflation from downstream resales or off-scope refurb activity.
Benchmark comparison
| Source | Market Size | Gaps in Research Methodology |
|---|---|---|
| Mordor Intelligence | USD 1.77 B (2025) | |
| Global Market Publisher A | USD 1.47 B (2025) | Uses factory gate values and may apply a narrower interpretation of included tool-specific accessories and related services, which can reduce the addressable total for the same calendar year. |
| Industry Research Publisher B | USD 1.80 B (2025) | Often blends a broader scope and different pricing basis, which can pull in adjacent powered surgical instruments or apply higher average prices that are not consistently tied back to procedure-driven utilization. |
Across the three values, the spread mainly comes from scope edges and pricing points, not from disagreement that the market is steadily growing. When the demand pool is anchored to orthopedic procedure activity and then stress-tested with channel pricing and replacement timing, the final number stays traceable to inputs that a reader can follow and repeat.


Key Questions Answered in the Report
What is the current valuation of the Orthopedic power tools market?
The Orthopedic power tools market size stands at USD 1.84 billion in 2026 and is expected to rise to USD 2.16 billion by 2031.
Which technology segment is growing fastest?
Battery-powered platforms expand at a 4.66% CAGR, driven by their cordless convenience and suitability for ambulatory surgical centers.
Why are ambulatory surgical centers important to market growth?
ASCs post a 6.06% CAGR because their cost-saving outpatient model accelerates demand for compact, portable power tools designed for rapid case turnover.
Which region shows the strongest future growth?
Asia-Pacific leads with a 6.43% CAGR as healthcare spending climbs and aging demographics widen the surgical candidate pool.
How are leading vendors differentiating their offerings?
Market leaders integrate drills with robotics, navigation, and data analytics platforms that improve precision, enable predictive maintenance, and strengthen procurement value propositions.
Page last updated on:


 Your data is secure and never sold or shared.


