
Orthopedic Navigation Systems Market Size and Share
Market Overview
| Study Period | 2020 - 2031 |
|---|---|
| Market Size (2026) | USD 3.55 Billion |
| Market Size (2031) | USD 6.55 Billion |
| Growth Rate (2026 - 2031) | 13.06 % |
| Fastest Growing Market | Asia-Pacific |
| Largest Market | North America |
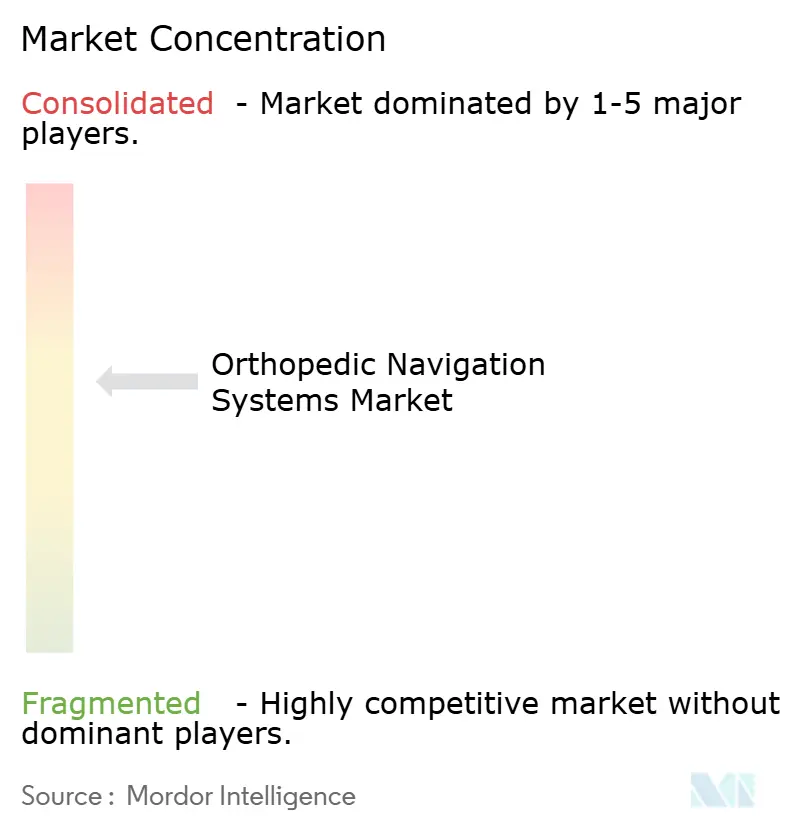
| Market Concentration | Medium |
Major Players *Disclaimer: Major Players sorted in no particular order Image © Mordor Intelligence. Reuse requires attribution under CC BY 4.0. | |
Orthopedic Navigation Systems Market Analysis by Mordor Intelligence
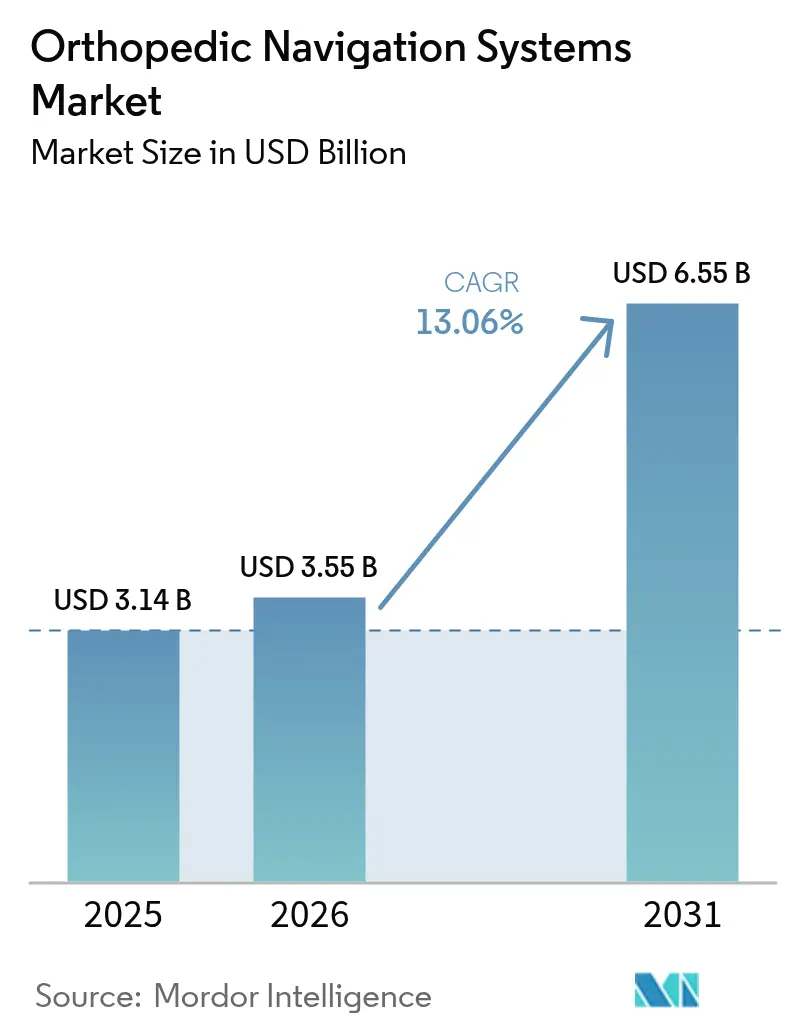
The orthopedic navigation systems market size in 2026 is estimated at USD 3.55 billion, growing from 2025 value of USD 3.14 billion with 2031 projections showing USD 6.55 billion, growing at 13.06% CAGR over 2026-2031. Growth stems from a convergence of aging populations, rising minimally invasive procedure volumes, and continuous imaging and software innovations that allow precise implant placement even in constrained anatomies. Health-system cost-containment initiatives now favor first-time surgical accuracy, encouraging hospitals and ambulatory surgical centers (ASCs) to invest in guidance platforms that reduce revision risk. Technology vendors are responding with integrated optical, electromagnetic, and augmented-reality (AR) solutions that shorten setup times and improve intra-operative workflow. At the same time, value-based purchasing in North America and Europe rewards lower complication rates, while emerging markets in Asia Pacific are scaling orthopedic capacity and demanding the same precision standards. Together, these factors underpin the current momentum of the orthopedic navigation systems market.
Key Report Takeaways
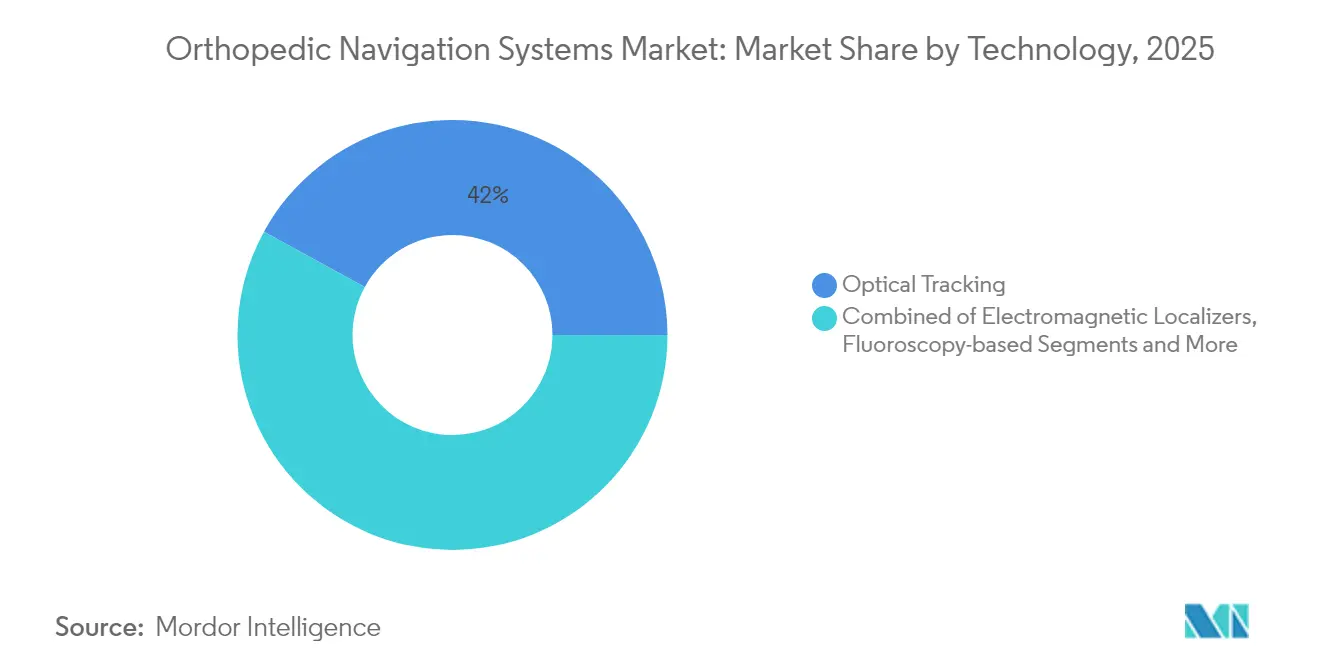
- By technology, optical tracking led with 42.02% of the orthopedic navigation systems market share in 2025, while AR/mixed-reality is forecast to expand at 17.85% CAGR through 2031.
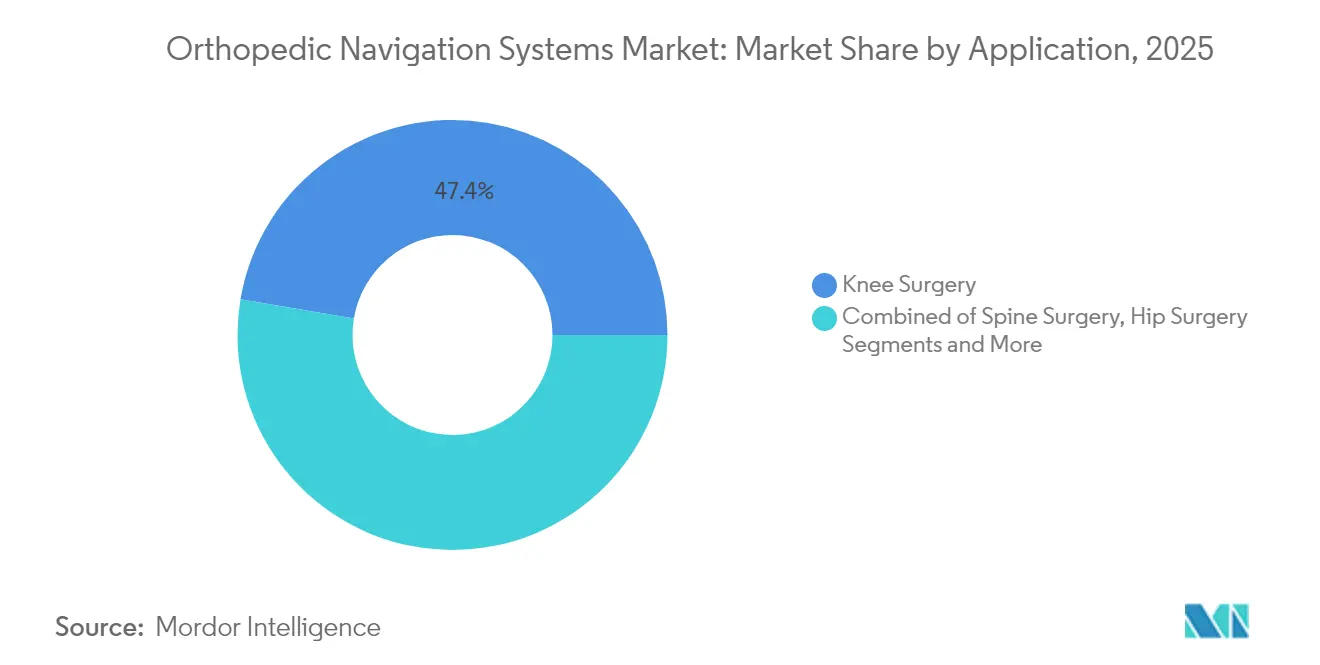
- By application, knee surgery accounted for 47.35% of the orthopedic navigation systems market size in 2025; shoulder and upper-extremity procedures are advancing at 13.95% CAGR to 2031.
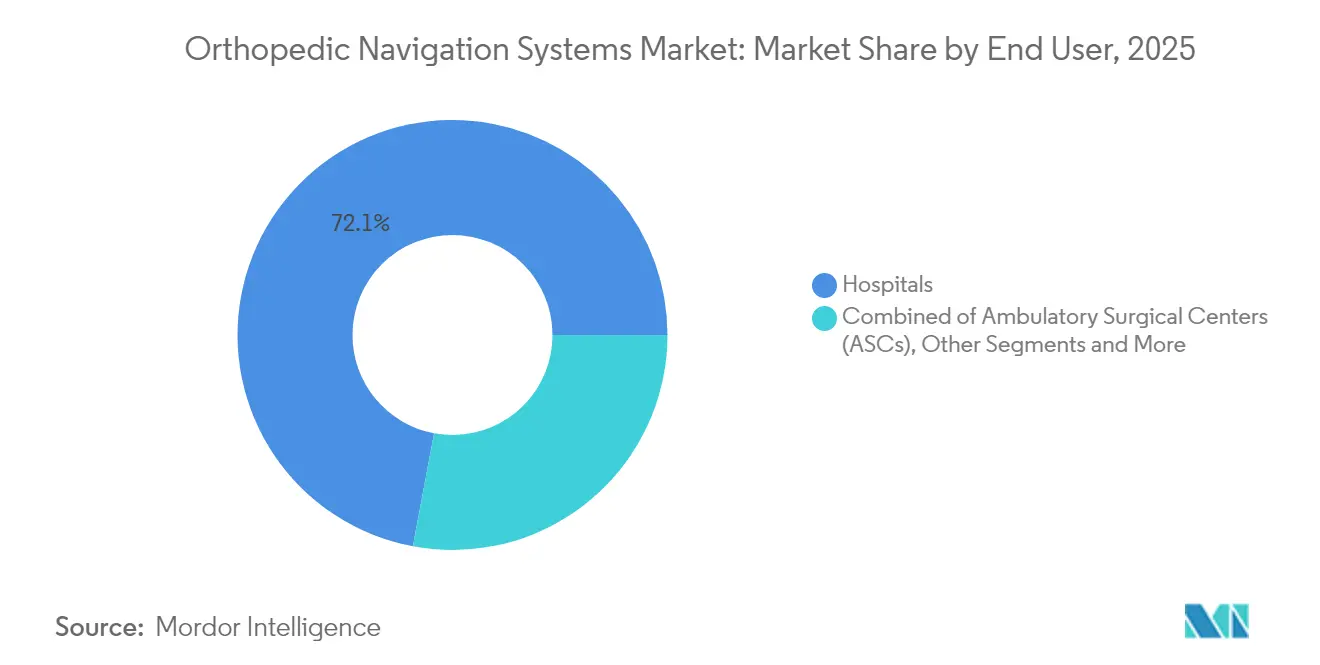
- By end user, hospitals retained 72.05% revenue share of the orthopedic navigation systems market in 2025, whereas ASCs are growing fastest at 11.55% CAGR through 2031.
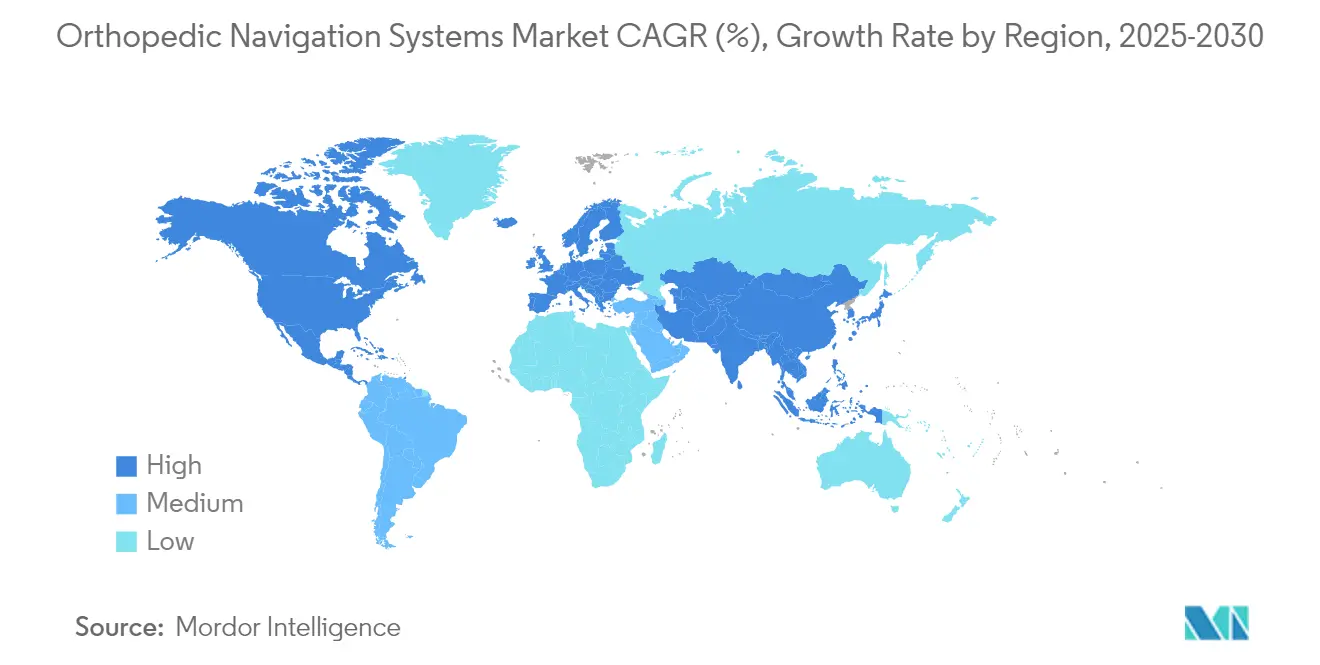
- By geography, North America held 40.74% share of the orthopedic navigation systems market in 2025, while Asia Pacific is the fastest-growing region at 9.24% CAGR.
Note: Market size and forecast figures in this report are generated using Mordor Intelligence’s proprietary estimation framework, updated with the latest available data and insights as of 2026.
Market Trends and Insights
Drivers Impact Analysis of Orthopedic Navigation Systems Market*
| Driver | (~) % Impact on CAGR Forecast | Geographic Relevance | Impact Timeline |
|---|---|---|---|
| Rising adoption of minimally invasive orthopedic procedures | +2.80% | Global; early gains in North America & EU | Medium term (2-4 years) |
| Expanding installed base of robotic-assisted surgery platforms | +2.10% | North America core; spill-over to APAC | Long term (≥4 years) |
| Advances in real-time imaging & sensor fusion for intra-op guidance | +1.90% | Global; high-volume centers | Short term (≤2 years) |
| Growing burden of musculoskeletal disorders in ageing populations | +2.30% | Global; developed markets | Long term (≥4 years) |
| Hand-held & pin-less low-cost devices targeting ASC settings | +1.70% | North America & EU; expanding to APAC | Medium term (2-4 years) |
| FDA Real-World Evidence programs accelerating post-market data use | +1.20% | US-centric; global spillover | Short term (≤2 years) |
| Source: Mordor Intelligence | |||
Rising Adoption of Minimally Invasive Orthopedic Procedures
Surgeons increasingly favor smaller incisions that minimize tissue trauma yet still demand sub-millimeter implant accuracy. Navigation assists by guiding instruments in three-dimensional space, enabling 93% alignment within ±2° during total knee arthroplasty.[1]W. Hee, “Computer-Assisted Total Knee Arthroplasty Accuracy,” Hindawi, hindawi.comEconomic benefits accrue when shorter inpatient stays and quicker rehabilitation reduce payer spend. Fluoroscopy-integrated systems further cut radiation exposure by 91.8% compared with conventional methods.
Expanding Installed Base of Robotic-Assisted Surgery Platforms
Hospitals that already rely on robotics are layering navigation software on existing arms to form comprehensive ecosystems. Stryker’s forthcoming Mako 4 release extends its footprint from hips and knees to spine and shoulders, embedding the Q Guidance module for seamless imaging–robot synchronization. Peer-reviewed research shows robotic navigation flattens the learning curve in hip arthroplasty for early-career surgeons, achieving veteran-level accuracy sooner.[3]N. Kayani et al., “Robotic Hip Arthroplasty Learning Curve,” Bone & Joint Open, boneandjointopen.boneandjoint.org.uk
Advances in Real-Time Imaging & Sensor Fusion for Intra-Op Guidance
Machine-vision cameras, optical trackers, and electromagnetic coils now merge data streams to produce live anatomic maps. In pediatric scoliosis corrections, such fusion cut fluoroscopy time 68% and radiation 66%. AR overlays place holographic anatomical landmarks directly on the field of view, reducing cognitive load, while AI algorithms predict drill trajectories that avert cortical breaches before they happen.
Growing Burden of Musculoskeletal Disorders in Ageing Populations
The growing burden of musculoskeletal diseases is likely to increase demand for orthopedic navigation systems is anticipated to boost the segment growth. For instance, according to the study published in the Journal of Indian Rheumatology Association, the overall prevalence of primary knee in big cities of India was 33.2%, 19.3% in small cities, 18.3% in towns, and 29.2% in villages. The study also demonstrated that the prevalence of symptomatic primary osteoarthritis knee in urban areas is much higher than reported in rural regions in India. Older bone often presents atypical anatomy, making precision crucial to avoid early loosening. Navigation reduces revision rates and delivers quality-adjusted life-year gains at USD 45,554 per QALY in knee replacement.[2]M. Kalra, “Radiation Dose Reduction in Knee Replacement,” AJR, ajronline.org
Restraints Impact Analysis of Orthopedic Navigation Systems Market*
| Restraint | (~) % Impact on CAGR Forecast | Geographic Relevance | Impact Timeline |
|---|---|---|---|
| High capital & per-procedure costs of navigation platforms | -2.40% | Global; acute in emerging markets | Medium term (2-4 years) |
| Steep learning curve & workflow disruption for surgical teams | -1.80% | Global; varies by institution | Short term (≤2 years) |
| Stringent multi-region regulatory approval & device-recall risk | -1.60% | US & EU zones | Medium term (2-4 years) |
| Competitive cannibalization by fully integrated orthopedic robots | -1.40% | North America & EU; expanding to APAC | Long term (≥4 years) |
| Source: Mordor Intelligence | |||
High Capital & Per-Procedure Costs of Navigation Platforms
Systems list from USD 475,000 to more than USD 1 million, while disposables can add USD 442–1,500 each case. Reimbursement gaps often push facilities to self-fund upgrades. Some evidence shows neutrality is achieved when navigation averts 17 spine revisions per center. Lower-cost handheld models are gradually easing the financial barrier for mid-size hospitals and ASCs.
Steep Learning Curve & Workflow Disruption for Surgical Teams
Surgeons may need 20–30 cases before operative times normalize; early cases lengthen by 6–15 minutes. OR staff must adjust positioning, cable management, and sterile technique, adding friction. Surveys indicate 63.5% of spine surgeons cite longer times as a drawback, yet AI-guided interfaces that automate registration are driving faster mastery.
*Our forecasts treat driver/restraint impacts as directional, not additive. The impact forecasts reflect baseline growth, mix effects, and variable interactions.
Orthopedic Navigation Systems Market Segment Analysis
By Technology:
Optical Leadership, AR/MR MomentumOptical systems controlled 42.02% of the orthopedic navigation systems market in 2025, thanks to well-validated camera arrays that deliver sub-millimeter accuracy during high-volume knee replacements. Augmented- and mixed-reality solutions now post the segment’s fastest 17.85% CAGR, propelled by head-mounted displays that place holographic guides inside the surgeon’s field of view and remove line-of-sight constraints common to fixed cameras. Electromagnetic trackers are gaining ground for spine work where metallic instruments obscure optical markers, whereas fluoroscopy-based guidance remains a staple in trauma rooms needing instant imaging. MRI-specific platforms hold a niche for soft-tissue-driven tumor resections that depend on detailed contrast.
Competition is intensifying as incumbents meld sensors, GPUs, and cloud analytics into single packages. Smith+Nephew’s TESSA Spatial Surgery System runs in real-time on NVIDIA chips to guide ACL reconstruction without external cameras, illustrating the shift toward compact hybrid devices. Proprietary AI modules now auto-segment bone on intra-op scans and fine-tune instrument paths, trimming manual steps. With optical reliability already proven, companies seek differentiation by shrinking footprints, cutting cables, and integrating AR. As price points drop, the orthopedic navigation systems market will likely see technology overlap rather than a single-modality winner.


By Application:
Knee Dominance, Shoulder SurgeKnee procedures generated 47.35% of 2025 revenue share as decades of randomized evidence show axis alignment within ±2° in over 90% of navigated knees, compelling payers to reimburse guidance for complex deformities. Spine surgeries capture an expanding share because misplaced pedicle screws risk neurologic harm, prompting adoption even in lower-resource settings that cannot afford full robotics. Hip arthroplasty is also benefiting from direct-anterior approaches, which demand precise cup inclination and version.
Shoulder and upper-extremity operations are poised for 13.95% CAGR, the fastest within the orthopedic navigation systems industry, as athletes and aging populations pursue motion-preserving implants. Stryker’s Tornier portfolio now couples 3D planning with intra-op trackers that confirm glenoid axis, pushing adoption in centers of excellence. Trauma and sports medicine groups favor handheld devices that enable quick deployment at odd hours. Emerging subspecialties, such as foot-and-ankle reconstruction, will further diversify demand once disposable pricing aligns with ambulatory margins.
By End User:
Hospitals Hold Sway as ASCs AccelerateHospitals retained 72.05% of the orthopedic navigation systems market share in 2025 by leveraging capital budgets and multi-specialty case volumes that amortize equipment quickly. Academic centers prioritize navigation for resident training and as live-data generators feeding registries that benchmark implant longevity. Integration with electronic health records lets hospitals mine outcomes and negotiate bundled-payment premiums from insurers keen on predictable results.
ASCs are the fastest riser at 11.55% CAGR, encouraged by policy shifts that reimburse more joint replacements outside hospital walls. Portable, pin-less devices weighing under 3 kg fit tight operating suites and avoid lengthy turnover. Sg2 projects double-digit orthopedic case migration to ASCs, and navigation helps these centers defend quality metrics needed for payer contracts. Specialty clinics and global charity hospitals represent smaller segments but illustrate how stripped-down guidance platforms can thrive in varied economic contexts.
Geography Analysis
North America Orthopedic Navigation Systems Market
North America accounted for 40.74% of sales in 2025, reflecting early adoption, clear CPT codes that reimburse navigation in complex joints, and the presence of vendors able to provide 24/7 field support. Migration of hip and knee replacements to ASCs intensifies demand for compact platforms that replicate hospital-level precision. A 26% cost reduction versus hospital outpatient departments has been documented when ASCs deploy navigated protocols for joint work. Canada mirrors this path with provincial funding programs that incentivize data-verified outcomes, while Mexico gains from cross-border device trade and private hospital growth.
Europe Orthopedic Navigation Systems Market
Europe forms the next largest block, with Germany, the United Kingdom, and France adopting stringent evidence-based guidelines favoring navigation when alignment accuracy predicts longevity of high-priced implants. Diverse reimbursement regimes mean uptake varies, statutory payers in Germany cover navigation disposables, whereas southern markets rely on private insurers or self-pay models. Academic hubs such as Charité in Berlin and Oxford University Hospitals publish robust registries that validate technology, influencing continental standards. Emerging Central-Eastern nations now modernize orthopedic departments with EU recovery funds and see navigation as a path to curb expensive revisions.
APAC Orthopedic Navigation Systems Market
Asia Pacific is the fastest-growing region, posting a 9.24% CAGR to 2031 as demographic aging meets rising income levels. India’s arthroplasty implant sector is expanding near 25% CAGR, yet limited awareness of joint-replacement options caps immediate volumes. China’s penetration remains low, with only 8.31% of hip surgeons using navigation or robotics, but state 5-year plans targeting advanced healthcare are expected to lift utilization. Japan and South Korea already operate mature reimbursement schemes, while Australia’s national joint registry proves the link between navigation and lower revision risk, reinforcing adoption. Southeast Asian markets draw medical tourists seeking high-tech surgery, nudging private hospitals to invest in navigation as a competitive differentiator.

Regulatory Landscape
Orthopedic navigation systems are regulated as medical devices across major markets, with many US offerings falling under FDA Class II with Special Controls (21 CFR 882.4560). These products commonly use the 510(k) pathway for clearances and for incremental changes.
In May 2026, the FDA published final guidance on Patient-Matched Guides for Orthopedic Implants, sharpening expectations for design inputs, validation, and submission content for patient-specific workflows. Such workflows often interface with navigation software and intra-operative imaging. Manufacturers also align to global quality-system requirements, with ISO 13485:2016 remaining a widely adopted baseline for medical-device QMS. In April 2026, the FDA issued a final order classifying certain manual surgical instruments intended for appropriate patient selection for orthopedic implants into Class II (Special Controls), reinforcing clearer controls for tools and software that influence implant selection and placement. That direction increases the weight placed on documentation, post-market monitoring, and traceability for navigation-enabled workflows.
Competitive Landscape
The orthopedic navigation systems market is moderately fragmented. Global device majors bundle navigation into broad implant portfolios, giving them cross-selling leverage and multi-year service contracts. Stryker unifies its Mako robots with the Q Guidance camera platform, offering one interface across hips, knees, shoulders, and spine procedures. Zimmer Biomet’s acquisition of OrthoGrid brings AI-driven fluoroscopy analytics, rounding out its ROSA robot line. Smith & Nephew enters spatial surgery with TESSA, underscoring a shift from passive tracking to immersive AR guidance.
Specialists such as Brainlab, 7D Surgical, and OrthAlign carve niches through ultra-fast camera registration, flash imaging, or disposable-only business models that remove capital hurdles. New entrants exploit machine-learning algorithms licensed from academic labs to deliver tracker-less navigation that depends solely on intra-operative imaging, sidestepping bulky arrays. Partnerships flourish: Smith & Nephew collaborates with JointVue for ultrasound planning, while Zimmer Biomet distributes THINK Surgical’s wireless knee robot for ASCs. Vendors also mine data lakes created by connected robots to build predictive maintenance and derive implant-longevity insights, strengthening post-sale relationships.
Competitive cannibalization arises as fully integrated robots threaten stand-alone navigation sales. Yet hospitals still purchase camera systems where volume or budget cannot justify full robotics, keeping the addressable base wide. Handheld, pin-less products appeal in cost-sensitive geographies and among surgeons resistant to large consoles. Over the forecast, differentiation will center on AI-powered automation, reduced learning curves, and interoperability with operating-room integration platforms rather than on pure tracking accuracy, which is now table stakes.
Orthopedic Navigation Systems Industry Leaders
Stryker
Zimmer Biomet
Smith + Nephew
Medtronic
NuVasive
- *Disclaimer: Major Players sorted in no particular order
Orthopedic Navigation Systems Market Companies Covered in this Report
- Stryker
- Zimmer Biomet
- Smiths Group
- Medtronic
- Brain Lab
- NuVasive
- B. Braun
- Arthrex
- Siemens Healthineers
- MicroPort MedTech
- Exactech
- OrthAlign
- 7D Surgical
- Intellijoint Surgical
- Corin Group
- DePuy Synthes
- Joimax
- Globus Medical
- Karl Storz
- Scopis (Stryker)

Market Opportunities and Future Outlook
AI-assisted navigation and automated intra-operative interpretation are emerging as a central product development theme, and that creates room for systems that reduce manual landmarking and streamline registration time in high-volume arthroplasty. In June 2026, DePuy Synthes announced US commercial availability of VELYS Hip Navigation with AI Assistance, pointing to progress in automated image interpretation and landmark identification for total hip arthroplasty. The same capability set can be extended as vendors broaden their procedure libraries.
Ambulatory migration is also driving a shift toward purpose-built, portable navigation offerings aligned with ASC economics and footprint constraints, which supports demand beyond large hospital capital budgets. OrthAlign received FDA 510(k) clearance in June 2026 for the Lantern ASC system and reported first clinical cases in July 2026, indicating active commercialization of handheld navigation designed for outpatient sites of care. Tracking modality innovation is another opportunity area. In May 2026, DePuy Synthes entered a definitive agreement to acquire Gemtrack radiofrequency tracking technology from MinMaxMedical for use across its joint reconstruction portfolio, reflecting investment in alternatives to infrared line-of-sight tracking and efforts to simplify OR workflow while reducing reliance on fixed camera arrays.
Recent Industry Developments in Orthopedic Navigation Systems Market
- July 2026: Stryker announced the full US commercial launch of Mako RPS (Robotic Power System) for total knee replacement, introducing its Mako Handheld Robotics platform. The handheld approach targets workflow and footprint constraints, widening the addressable base beyond large robotic-arm installations. It also increases competitive pressure on stand-alone navigation vendors by tightening the link between powered instrumentation, guidance, and the broader Mako ecosystem.
- November 2025: Zimmer Biomet received US FDA 510(k) clearance for ROSA Knee with OptimiZe, adding customized intelligent surgical planning to the ROSA Knee system. The clearance strengthens Zimmer Biomet's software-led differentiation around planning and intra-operative guidance rather than hardware alone. It also supports commercialization of robotics and navigation as an integrated platform in hospital and outpatient knee programs.
- July 2024: Stryker received US FDA 510(k) clearance for the Q Guidance System with Spine Guidance 5 Software featuring Copilot. The update pairs navigation software with guidance features designed to improve intra-operative precision in spine procedures. It reinforces Stryker's approach of extending navigation capabilities across multiple anatomies while sustaining regulatory momentum for iterative software releases.


Orthopedic Navigation Systems Market Report Scope and Research Methodology
Market Definition and Coverage
This market covers revenue generated from orthopedic navigation systems used to guide bone cuts and implant placement during orthopedic procedures, along with the core software, trackers, and procedure-linked accessories sold with these systems across hospitals and surgical centers.
Scope exclusions: We exclude veterinary navigation use and stand-alone diagnostic imaging systems that are not sold for intraoperative navigation.
Segments Covered in This Report
- By Technology
- Electromagnetic Localizers
- Optical Tracking
- Fluoroscopy-based
- MRI-based
- Augmented / Mixed Reality Systems
- Other Emerging Technologies
- By Application
- Knee Surgery
- Spine Surgery
- Hip Surgery
- Shoulder & Upper-Extremity
- Trauma & Sports Injury
- Other Applications
- By End User
- Hospitals
- Ambulatory Surgical Centers (ASCs)
- Others
- By Geography
- North America
- United States
- Canada
- Mexico
- Europe
- Germany
- United Kingdom
- France
- Italy
- Spain
- Rest of Europe
- Asia Pacific
- China
- Japan
- India
- South Korea
- Australia
- Rest of Asia Pacific
- Middle East and Africa
- GCC
- South Africa
- Rest of Middle East and Africa
- South America
- Brazil
- Argentina
- Rest of South America
- North America
Data Sources, Market Sizing, and Validation
Desk Research
Desk work starts by mapping what is sold as an orthopedic navigation system and how it is typically purchased (capital console, software modules, and add-on items used per case). We review public sources such as US FDA device databases, European regulatory listings where applicable, procedure statistics from sources such as the OECD and CDC, and methods and adoption evidence from peer-reviewed orthopedic journals.
We also use company annual reports, investor presentations, and earnings call notes to understand how navigation revenues are discussed and where they sit inside broader orthopedic portfolios. Import and export statistics, such as UN Comtrade series for relevant device categories, are checked to sanity-test shipment direction by region. Patent databases help track technology intensity and likely product change timing. Some analyst work is supported by paid subscriptions for company financial intelligence, news and financials, and patent lookups, but the final market model is built from traceable assumptions. The desk source list above is illustrative only, and many other public documents were reviewed to validate and clarify inputs.
Primary Interviews and Surveys
Primary conversations are used to pressure-test adoption rates, pricing ranges, and replacement cycles for navigation platforms across high volume joint reconstruction sites and spine-focused centers. Interviews also clarify what portion of procedure volumes realistically touch navigation, especially where surgeons use a mix of guidance options. We interview a mix of manufacturers, distributors, surgeons, operating room managers, and biomedical engineering teams across major regions so the assumptions reflect how purchasing and utilization vary by country and care setting.
Distribution of primary research fieldwork respondents
| Company type | Respondent position | Region |
|---|---|---|
| Top tier: 29% | CXOs: 13% | APAC: 41% |
| Mid tier: 49% | Functional/Unit leaders: 37% | EMEA: 37% |
| Smaller Players: 22% | Managers: 50% | Americas: 22% |
Market-Sizing & Forecasting
Sizing starts with a top-down build where orthopedic procedure volumes and the addressable installed base are reconstructed by region, and then filtered through navigation penetration, average system pricing, and typical accessory attach rates. Once that demand pool is built, we corroborate it with selective bottom-up checks, such as sampled average selling price times estimated unit shipments for major geographies, plus channel checks on system placements and replacement timing.
Inputs that matter in this market include joint replacement and spine procedure volumes, navigation utilization by procedure type, capital system replacement cycles, average selling price movement for consoles and software, and the share of cases that use disposable or reusable trackers and arrays. Where direct unit data is patchy, gaps are handled by using proxy indicators like procedure growth, facility count, and observed adoption curves from interviews, then adjusted during review.
For forecasting, scenario analysis is used so we can reflect different adoption speeds tied to surgeon training, operating room workflow impact, and capital budget cycles. The scenarios are then reconciled with consensus expectations from primary experts.
Data Validation & Update Cycle
Outputs are checked in several passes, starting with variance checks against independent signals such as procedure growth, installed base logic, and plausible revenue per active system by region. If a number looks off, we revisit the input drivers, re-check the source trail, and selectively re-contact interviewees to confirm whether the issue is pricing, utilization, or scope.
Before sign-off, another analyst reviews calculations, assumptions, and year-to-year movements so the model remains consistent across regions and time. Reports are refreshed annually, with interim updates when major regulatory, technology, or demand events materially shift adoption or pricing. A final pre-delivery review is completed to reflect the latest public information.
Mordor Intelligence's Orthopedic Navigation Systems Market Size Compared With Other Published Estimates
Published numbers for orthopedic navigation systems often do not match, because the included product boundary is not the same and the year used as the reference point can also vary. In practice, differences usually come from whether adjacent robotics revenues are bundled in, whether service and software are counted as recurring revenue, and how fast pricing is assumed to decline as more systems get installed.
The table shows a wide spread mainly because of scope and pricing logic, and in Mordor Intelligence's model only orthopedic navigation systems revenue is counted (including procedure-linked accessories), while adjacent robotic platforms and stand-alone diagnostic imaging are kept out even when they are used in the same operating room.
Benchmark comparison
| Source | Market Size | Gaps in Research Methodology |
|---|---|---|
| Mordor Intelligence | USD 3.55 B (2026) | |
| Industry Research Publisher A | USD 2.25 B (2026) | Uses a narrower device definition that appears to undercount software and per-procedure accessories, and it likely applies conservative adoption assumptions across joint replacement sites. |
| Industry Blog B | USD 2.20 B (2022) | Anchors the estimate to an older year and may blend different pricing and currency timing, which can pull the value down when later adoption and system ASP changes are not re-validated. |
Taken together, the gap is not only about growth rate, it is about what gets counted and how each component is priced over time. By keeping the model tied to procedure volumes, realistic utilization, and a clear treatment of capital systems versus case-linked items, the final number stays explainable and repeatable when assumptions are revisited.


Key Questions Answered in the Report
What is the current Orthopedic Navigation Systems Market size?
The Orthopedic Navigation Systems Market size is USD 3.55 billion in 2026 and is projected to grow at a CAGR of 13.06% during the forecast period (2026-2031).
Who are the key players in Orthopedic Navigation Systems Market?
Stryker, Zimmer Biomet, Smith + Nephew, Medtronic and NuVasive are the major companies operating in the Orthopedic Navigation Systems Market.
Which is the fastest growing region in Orthopedic Navigation Systems Market?
Asia-Pacific is estimated to grow at the highest CAGR over the forecast period (2026-2031), at 9.24%.
Which region has the biggest share in Orthopedic Navigation Systems Market?
In 2025, the North America accounts for the largest market share in Orthopedic Navigation Systems Market, at 40.74%.
What years does this Orthopedic Navigation Systems Market cover?
The report covers the Orthopedic Navigation Systems Market historical market size for years: 2019, 2020, 2021, 2022, 2023 and 2024. The report also forecasts the Orthopedic Navigation Systems Market size for years: 2026, 2027, 2028, 2029, 2030 and 2031.
Page last updated on:


 Your data is secure and never sold or shared.


