
Orthopedic Braces And Supports Market Size and Share
Market Overview
| Study Period | 2020 - 2031 |
|---|---|
| Market Size (2026) | USD 4.99 Billion |
| Market Size (2031) | USD 6.12 Billion |
| Growth Rate (2026 - 2031) | 4.18 % |
| Fastest Growing Market | Asia Pacific |
| Largest Market | North America |
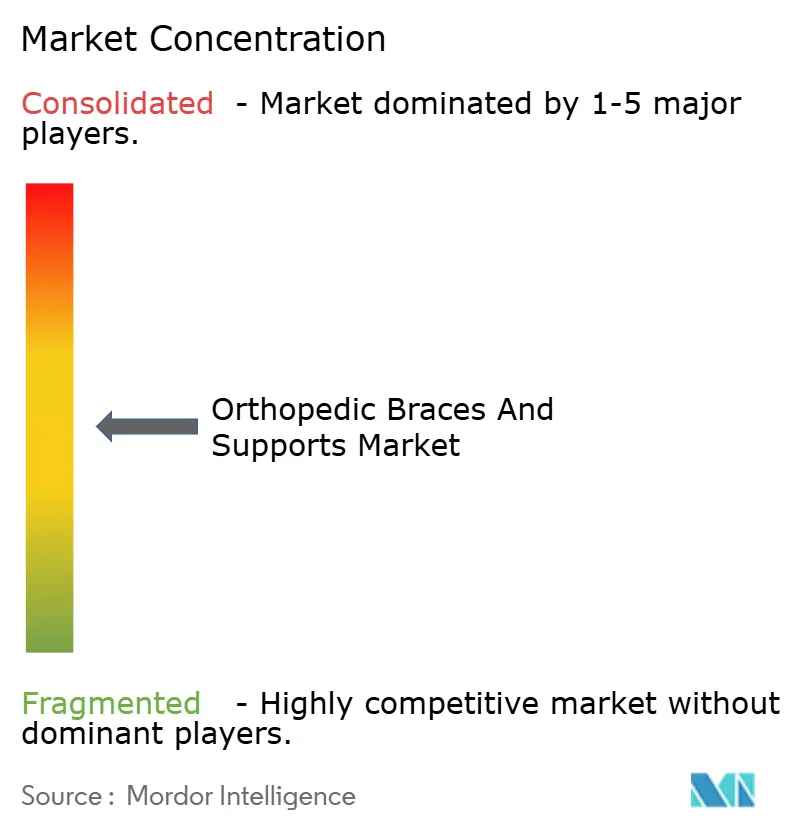
| Market Concentration | Medium |
Major Players *Disclaimer: Major Players sorted in no particular order Image © Mordor Intelligence. Reuse requires attribution under CC BY 4.0. | |
Orthopedic Braces And Supports Market Analysis by Mordor Intelligence
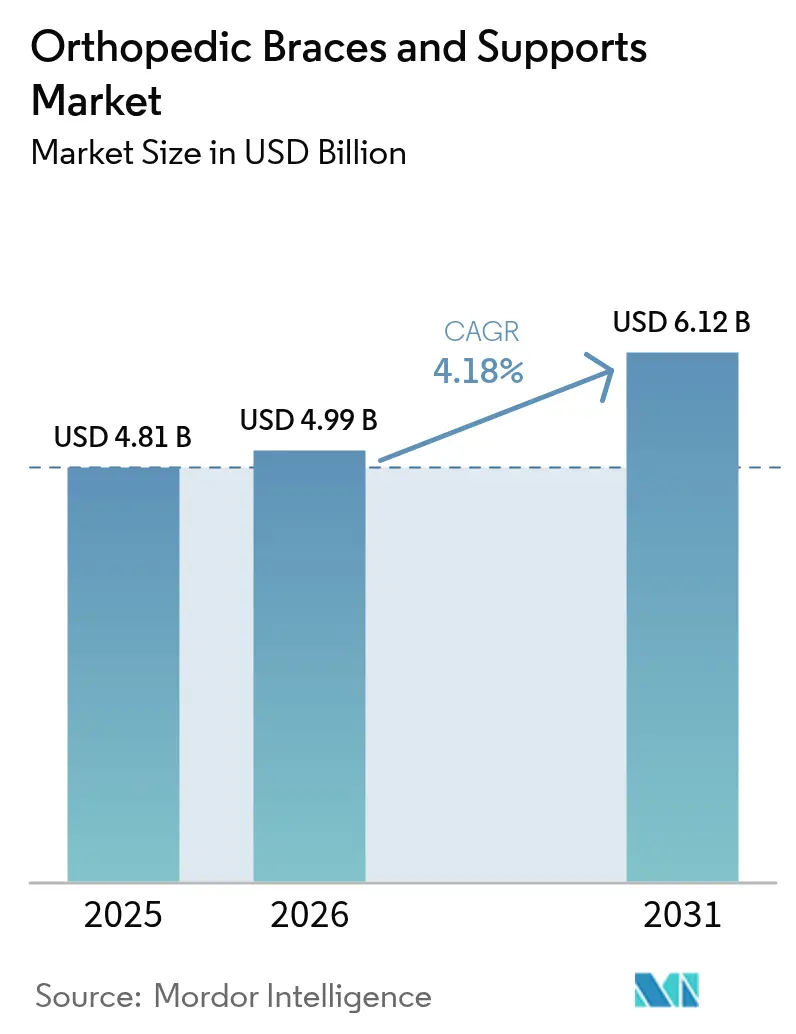
The Orthopedic Braces And Supports Market size was valued at USD 4.81 billion in 2025 and is estimated to grow from USD 4.99 billion in 2026 to reach USD 6.12 billion by 2031, at a CAGR of 4.18% during the forecast period (2026-2031).
Growing musculoskeletal disease prevalence, demographic aging, and rapid materials innovation are steering the orthopedic braces and supports market away from commodity neoprene sleeves toward engineered, sensor-enabled devices that slot into post-acute care pathways. Nearly 595 million people worldwide were living with osteoarthritis in 2020, and the absolute case count is on course to approach 1 billion by 2050. Parallelly, the global population aged 60 and above reached 1.4 billion in 2025, concentrating demand in health-system-ready regions that reimburse durable medical equipment. Lighter carbon-fiber and PEEK constructions improve patient compliance by trimming brace mass 30-40% while retaining load dispersal, and early movers already embed inertial sensors that feed range-of-motion data into remote-therapy dashboards.
Key Report Takeaways
- By product type, knee braces and supports led with 36.11% of orthopedic braces and supports market share in 2025, and upper-extremity braces are forecast to post the fastest 6.06% CAGR through 2031.
- By application, ligament injury accounted for 39.27% revenue in 2025, and post-operative rehabilitation is projected to expand at an 8.63% CAGR to 2031.
- By end user, hospitals and surgical centers accounted for 41.32% of the orthopedic braces and supports market in 2025, and orthopedic clinics posted the highest 8.18% CAGR through 2031.
- By geography, North America commanded 39.78% of the revenue share in 2025, and Asia-Pacific is expected to grow at a 7.27% CAGR between 2026 and 2031.
Note: Market size and forecast figures in this report are generated using Mordor Intelligence’s proprietary estimation framework, updated with the latest available data and insights as of 2026.
Market Trends and Insights
Drivers Impact Analysis of Orthopedic Braces And Supports Market*
| Driver | (~) % Impact on CAGR Forecast | Geographic Relevance | Impact Timeline |
|---|---|---|---|
| Rising Prevalence of Osteoarthritis & MSDs | +1.2% | Global, with concentration in North America & EU | Long term (≥ 4 years) |
| Growing Geriatric Population | +1.0% | Global, peak impact in Japan, EU, North America | Long term (≥ 4 years) |
| Increasing Sports-Related Injuries | +0.6% | North America, EU, APAC urban centers | Medium term (2-4 years) |
| Advancements in Lightweight Materials | +0.8% | Global, early adoption in North America & EU | Medium term (2-4 years) |
| IoT-Enabled Smart Braces Adoption | +0.5% | North America, EU, APAC tech hubs | Short term (≤ 2 years) |
| Direct-To-Consumer E-Commerce Channels | +0.4% | Global, led by North America & APAC | Short term (≤ 2 years) |
| Source: Mordor Intelligence | |||
Rising Prevalence of Osteoarthritis & MSDs
Global osteoarthritis prevalence climbed 113% between 1990 and 2020 and is projected to reach 1 billion cases by 2050, ensuring a large, recurring user base for knee and hip bracing. Middle-income Asia and Latin America will supply most net new cases, favoring low-cost sleeves, whereas mature payers in North America reimburse custom unloaders. In 2024 the CDC confirmed 58.5 million U.S. adults carried an arthritis diagnosis, underpinning a predictable brace replacement cycle.[1] Vendors that segment portfolios by price tier can capture both cash-pay demand and reimbursed premium demand. Disease-driven baseline turnover thus anchors the orthopedic braces and supports market.
Growing Geriatric Population
By 2025, 29% of Japan’s population was aged 65 and older, underscoring the need for lightweight ankle-foot orthoses compatible with robotic gait aids. Globally, the 60-plus cohort hit 1.4 billion in 2025 and will reach 2.1 billion by 2050. Older adults consume braces at higher per-capita rates, yet payers encourage preventive bracing that delays costly surgery. Europe’s dependency ratio, climbing from 34% in 2025 to 57% by 2050, heightens fiscal pressure, spurring policy support for home-based supports that maintain mobility.
Increasing Sports-Related Injuries
Eleven years of Olympic data show track and field athletes sustain 127 injuries per 1,000 athlete-days, with knee and ankle injuries dominating.[2] Youth baseball’s Pitch Smart rules, now adopted in 38 U.S. states, recommend elbow bracing for pitchers exceeding 80 innings. CrossFit’s 15,000 gyms worldwide contribute to overuse injuries of the wrist and lumbar spine, driving demand for quick-release braces. Athlete safety mandates thus funnel fresh volume into the orthopedic braces and supports market.
Advancements in Lightweight Materials
PEEK and braided carbon-fiber shells cut brace weight up to 40% without compromising rigidity.[3] Auxetic lattices under test for ankle supports absorb inversion energy better than neoprene while remaining breathable. Three-dimensional printing reduces custom-brace lead times from three weeks to five days. Material science is therefore widening the performance-price gap between premium and basic SKUs.
Restraints Impact Analysis of Orthopedic Braces And Supports Market*
| Restraint | (~) % Impact on CAGR Forecast | Geographic Relevance | Impact Timeline |
|---|---|---|---|
| High Cost of Sophisticated Braces | -0.7% | Global, acute in LMICs | Medium term (2-4 years) |
| Reimbursement Hurdles for OTC Products | -0.5% | North America, EU | Short term (≤2 years) |
| Proliferation of Counterfeit Products | -0.3% | Global, intense in APAC & online | Short term (≤2 years) |
| Patient Non-Compliance Due to Discomfort | -0.4% | Global | Medium term (2-4 years) |
| Source: Mordor Intelligence | |||
High Cost of Sophisticated Braces
Custom unloaders cost USD 600-800, while smart braces top USD 1,200, pricing out self-pay buyers in India, Indonesia, and Brazil. WHO data show out-of-pocket spending exceeds 50% of health expenditure in 35 LMICs, capping premium penetration. Tiered offerings, such as Össur’s polypropylene “Select” line, which trims bill-of-materials by 40%, aim to bridge the gap.
Reimbursement Hurdles for OTC Products
CMS excludes non-prescribed off-the-shelf braces from coverage and will roll nationwide competitive bidding to 2028, historically trimming payments 10-15%. 62% of U.S. commercial plans now require proof of failed conservative therapy before approving custom knee braces. Shrinking reimbursement threatens mid-tier innovation even as high-end devices secure new RTM codes.
*Our forecasts treat driver/restraint impacts as directional, not additive. The impact forecasts reflect baseline growth, mix effects, and variable interactions.
Orthopedic Braces And Supports Market Segment Analysis
By Product Type:
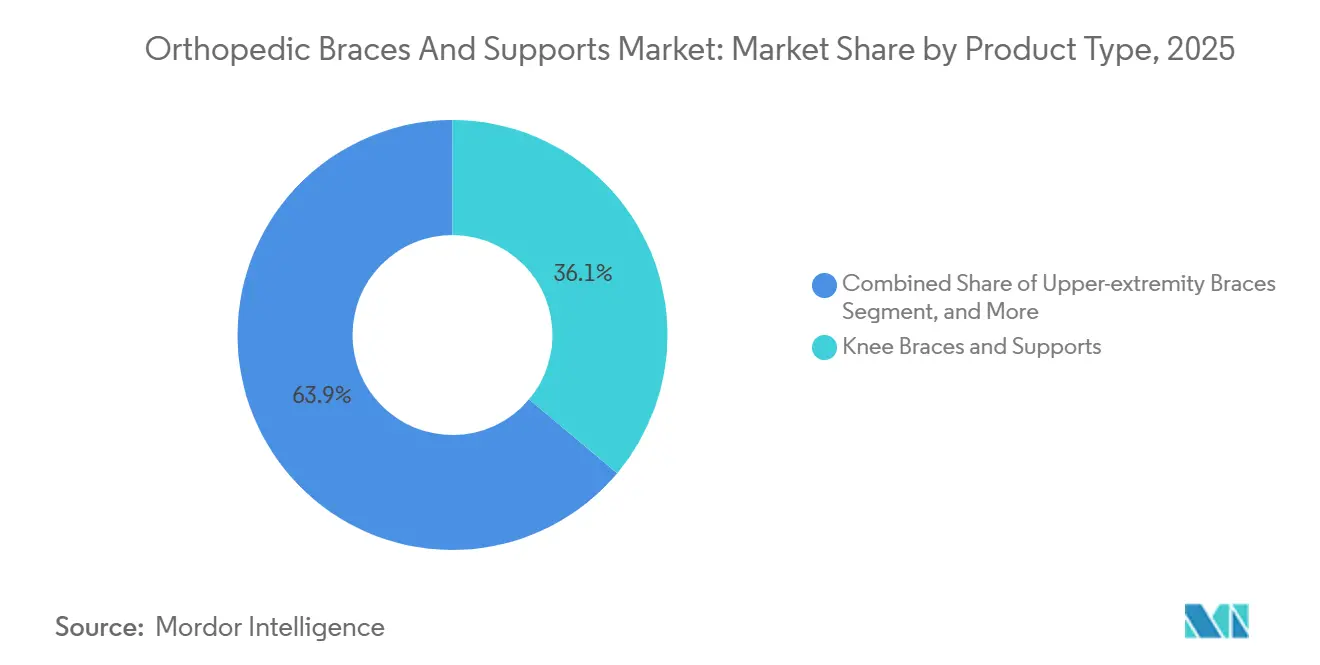
Upper-Extremity Gains Outpace Knee DominanceKnee braces retained a commanding 36.11% share of the orthopedic braces and supports market in 2025, buoyed by widespread ACL injuries and medial knee osteoarthritis. However, upper-extremity devices, led by shoulder and elbow supports, are forecast to grow at a 6.06% CAGR through 2031, outstripping all other categories. Rotator cuff repairs in the United States rose 8% year-on-year in 2024, driving sustained demand for abduction pillows and slings. Youth baseball guidelines further normalize prophylactic elbow bracing, extending replacement cycles.
Ankle and foot bracing is polarizing between low-cost elastic sleeves and custom ankle-foot orthoses for drop-foot. Zimmer Biomet’s 2025 acquisition of Paragon 28 underlines its bet on specialty extremity growth. Lumbar-sacral orthoses face tighter CMS coverage, lengthening approval timelines. Niche hip and pelvic solutions remain tethered to post-surgery protocols and have limited uptake for osteoarthritis.

By Application:
Post-Operative Rehabilitation Surges on ERAS AdoptionLigament injury applications captured 39.27% of 2025 revenue but are slowing as accelerated ACL protocols shorten immobilization windows. In contrast, post-operative rehabilitation braces are projected to climb at an 8.63% CAGR to 2031, supported by ERAS pathways that mandate early, brace-assisted mobilization. A 2024 meta-analysis found that hinged knee braces trimmed the total knee arthroplasty length of stay by 1.2 days, reinforcing their clinical utility.
Preventive-care bracing underperforms due to high abandonment among asymptomatic users, while unloader knee braces continue to delay arthroplasty 2-4 years in early osteoarthritis. Chronic-disease orthoses for conditions like cerebral palsy sustain stable demand but face incremental share erosion from advances in biologic therapies.
By End User:
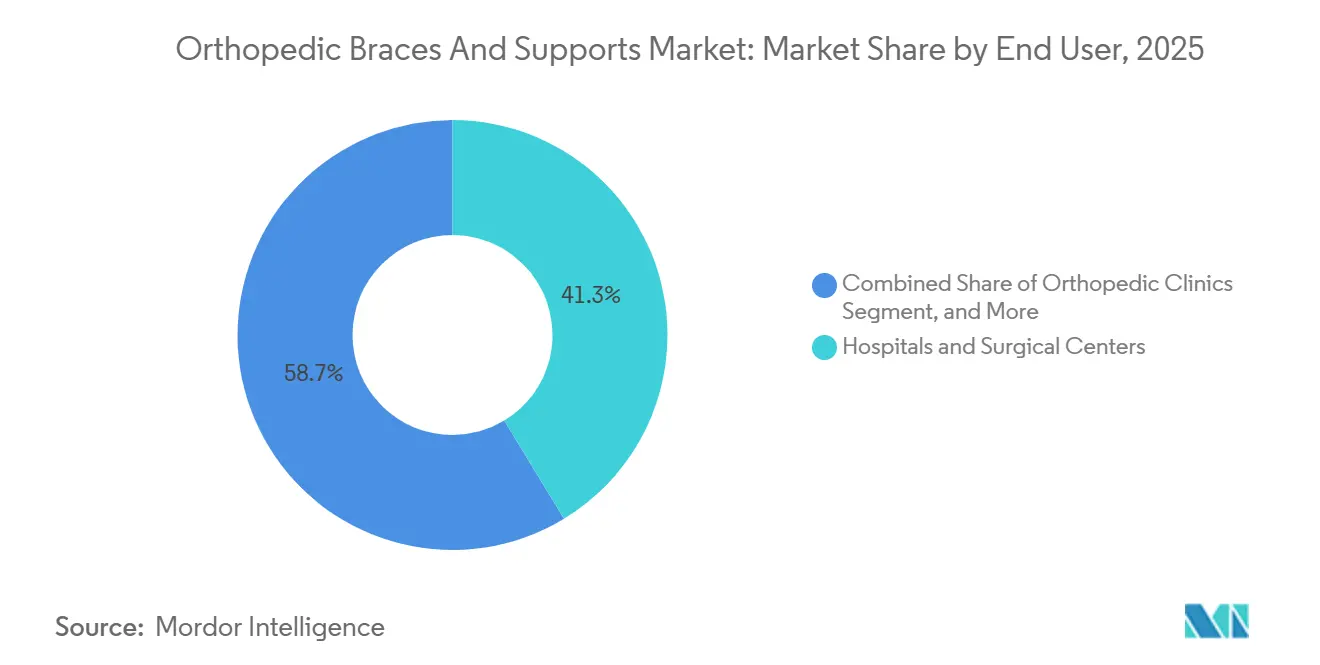
Orthopedic Clinics Capture Outpatient MigrationHospitals and surgical centers accounted for 41.32% of the orthopedic braces and supports market in 2025, driven by immediate post-surgical fitting. Nevertheless, orthopedic clinics are forecast to expand at an 8.18% CAGR through 2031 as payers migrate joint-preservation procedures to ambulatory settings. Outpatient orthopedic visits in the United States grew 11% in 2024, while inpatient volumes fell 3%. Almost half of private orthopedic groups now dispense braces on-site, capturing device margins and improving adherence.
Homecare settings gain momentum with CMS Remote Therapeutic Monitoring codes reimbursing clinicians for reviewing sensor data. Sports and rehab centers cater to a self-pay, performance-oriented clientele willing to invest in premium designs.
Geography Analysis
APAC Orthopedic Braces and Supports Market
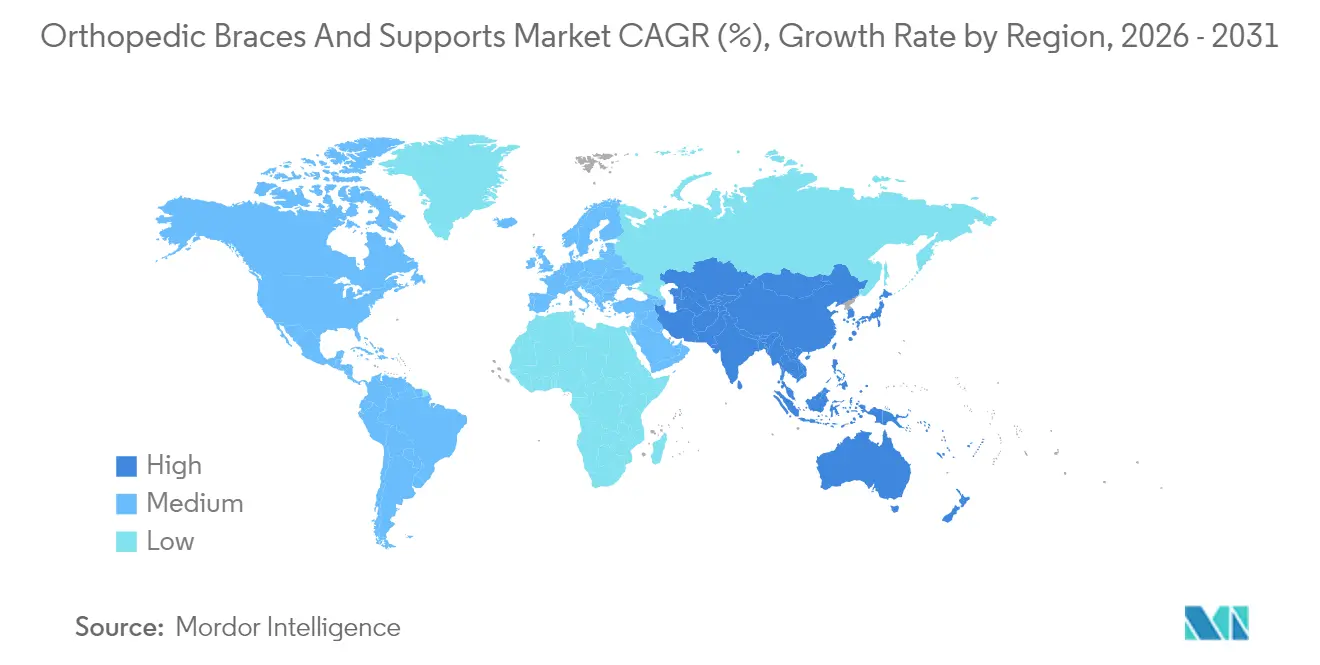
Asia-Pacific is projected to post a 7.27% CAGR from 2026-2031, outpacing every other region. China cut Class II orthotic review times to nine months in 2024, aligning documentation with ISO 13485 and lowering barriers for multinationals. India’s Production Linked Incentive scheme offers a 5% rebate on incremental domestic sales, encouraging global brands to set up local production lines. Japan’s super-aged society drives adoption of light, low-profile devices compatible with robotic exoskeletons, reinforcing the smart-brace frontier.
The Americas, Europe and Middle East Orthopedic Braces and Supports Market
North America, anchored by Medicare DMEPOS reimbursement, retained a 39.78% share in 2025 but faces future margin compression from nationwide competitive bidding starting in 2028. Europe fragments along reimbursement lines; Wales’ GBP 7.6 million framework in 2024 sliced procurement costs 12% while standardizing pathways. The Middle East invests in sports clinics ahead of major events, whereas South America charts divergent paths: Brazil expands SUS reimbursement, while Argentina prioritizes locally made elastic supports amid currency curbs.
Mordor Intelligence provides coverage of the orthopedic braces and supports market across other key regional markets, including Middle East, each with their regulatory frameworks and demand patterns. Detailed country-level analysis extends to India incorporating local coverage and market participation, as required.
Regulatory Landscape
Orthopedic braces and supports span prescription orthoses, post-operative rehabilitation devices, and increasingly sensor-enabled products, so manufacturers operate across multiple regulatory pathways. In the European Union, Regulation (EU) 2017/745 (EU MDR) remains the governing framework for CE marking, and Commission Delegated Regulation (EU) 2026/1359 (adopted in March 2026) updated technical documentation assessment requirements for specified class IIb implantable devices, reinforcing the broader trend toward tighter evidence and documentation expectations across orthopedic portfolios.
In the United States, the FDA device framework and classification rules continue to shape market access and labeling claims, with 2026 Federal Register actions clarifying orthopedic device classifications through codified pathways and special controls. Across major markets, ISO 13485:2016 remains a key quality management baseline used in audits and supplier qualification, supporting cross-border commercialization for companies that standardize design controls, risk management, and post-market processes.
Competitive Landscape
Top vendors Össur, Enovis (DJO), Bauerfeind, Zimmer Biomet, and 3M collectively accounted for a significant portion of global revenue in 2025, signaling moderate concentration. Zimmer Biomet’s USD 1.2 billion acquisition of Paragon 28 consolidated its foot-and-ankle franchise, while Johnson & Johnson will spin off the USD 9.2 billion DePuy Synthes unit by 2027 to sharpen its orthopedic focus. Smaller innovators exploit direct-to-consumer channels; Bauerfeind lifted online sales to 28% of European revenue in 2024 through instructional content.
Sensor integration is a pivotal battleground. Multiple smart braces cleared 510(k) loops in 2025, yet a lack of data-exchange standards fragments the ecosystem. Patent filings mentioning “negative Poisson’s ratio” or “thermoregulation” in brace designs jumped 34% year-over-year. Strategic investments such as Thuasne’s CAD 5 million stake in Bionic Power’s energy-harvesting Agilik knee orthosis blur lines between passive support and active exoskeletons.
Orthopedic Braces And Supports Industry Leaders
-
Zimmer Biomet
-
Ottobock SE & Co. KGaA
-
Össur
-
3M
-
Enovis (DJO)
- *Disclaimer: Major Players sorted in no particular order
Orthopedic Braces And Supports Market Companies Covered in this Report
- 3M
- Alcare Co., Ltd.
- Bauerfeind
- Bird & Cronin
- Breg
- BSN Medical
- DePuy Synthes (J&J)
- DeRoyal Industries
- Dynatronics Corp.
- Enovis (DJO)
- Lohmann & Rauscher
- medi
- Ossur
- Ottobock
- Reh4Mat
- Thuasne
- Trulife
- Tynor Orthotics
- United Ortho
- Zimmer Biomet
Market Opportunities and Future Outlook
A gap is forming between basic neoprene-style supports and products designed to integrate into clinical workflows, particularly in outpatient orthopedic clinics and home-based rehabilitation. Remote Therapeutic Monitoring reimbursement in the United States (codes introduced in 2024) creates a defined route for sensor-enabled braces when they generate reviewable therapy data, strengthening adoption of connected devices beyond early deployments and pushing vendors to pair hardware with software and clinician dashboards.
Product and technology development is expanding addressable use cases beyond traditional immobilization. Enovis introduced the DonJoy Spinamic Hybrid Scoliosis Brace in June 2026 for adolescent idiopathic scoliosis, indicating continued investment in higher-acuity, condition-specific designs that compete on wearability and corrective performance. In parallel, additive manufacturing and smart-material research, including 3D-printed immobilization concepts with integrated sensing and shape-memory textile composites for programmable stiffness, points to an innovation runway for faster customization, improved comfort, and data-enabled rehabilitation pathways that can differentiate premium offerings despite reimbursement and cost constraints.
Recent Industry Developments in Orthopedic Braces And Supports Market
- June 2026: Enovis launched the DonJoy Spinamic Hybrid Scoliosis Brace for adolescent idiopathic scoliosis, combining rigid corrective elements with a mesh vest design. The introduction expands Enovis bracing depth in spine indications while emphasizing wearability, a key lever for adherence in longer-duration bracing protocols.
- April 2025: Össur partnered with the Osteoarthritis Action Alliance (OAAA) as a Gold Sponsor to expand osteoarthritis education resources and promote OACareTools to clinicians and patients. The collaboration supports earlier non-surgical intervention adoption and improves Össur visibility in osteoarthritis care pathways that drive knee bracing utilization.
- May 2024: Thuasne acquired Corflex Global to deepen its US footprint and streamline orthopedic bracing sales coverage. The deal enhances channel access in a reimbursement-driven market and increases scale in a segment where distribution reach and clinician relationships influence conversion from OTC supports to prescribed braces.
Orthopedic Braces And Supports Market Report Scope and Research Methodology
Market Definition and Coverage
This market covers revenue generated from orthopedic braces and supports that are used to stabilize, protect, align, or reduce load on joints and the spine during injury care, post-operative recovery, and ongoing musculoskeletal conditions.
Scope exclusions: we exclude implants, surgical instruments, and prescription medicines. We also do not count physical therapy sessions or surgical procedures as part of this market value.
Segments Covered in This Report
- By Product Type
- Knee Braces & Supports
- Ankle & Foot Braces
- Back & Spine Braces
- Upper-extremity Braces
- Hip & Pelvic Braces
- Others
- By Application
- Ligament Injury
- Preventive Care
- Post-operative Rehabilitation
- Osteoarthritis
- Other Chronic Conditions
- By End User
- Hospitals & Surgical Centers
- Orthopedic Clinics
- Homecare Settings
- Sports & Rehabilitation Centers
- By Geography
- North America
- United States
- Canada
- Mexico
- Europe
- Germany
- United Kingdom
- France
- Italy
- Spain
- Rest of Europe
- Asia-Pacific
- China
- Japan
- India
- Australia
- South Korea
- Rest of Asia-Pacific
- Middle East & Africa
- GCC
- South Africa
- Rest of Middle East & Africa
- South America
- Brazil
- Argentina
- Rest of South America
- North America
Data Sources, Market Sizing, and Validation
Desk Research
Desk research is used to set the market boundaries, build the base demand picture, and confirm what changes year to year in orthopedic care and sports injury trends. We refer to public sources such as the US Centers for Disease Control and Prevention, the World Health Organization, OECD health statistics, and national health agencies that publish musculoskeletal burden and injury indicators.
To connect demand to actual buying behavior, we also review sources such as the US International Trade Commission trade data, UN Comtrade, and customs statistics for braces and similar orthopedic support items. Peer-reviewed orthopedic and sports medicine journals are used to understand procedure volumes and rehabilitation patterns. Company annual reports, investor presentations, and reputable press coverage help confirm pricing direction, channel shifts, and portfolio mix. Where needed, paid subscriptions are used for company financials and intelligence, patent databases, and shipment-level import-export checks. These sources are not exhaustive, and we also reviewed other public materials to collect data points, validate assumptions, and close open questions.
Primary Interviews and Surveys
Primary work focuses on converting desk inputs into realistic market shares and pricing curves, since braces are sold through multiple channels and price bands. We speak with manufacturers, distributors, orthopedic clinics, hospital procurement teams, and rehabilitation stakeholders across APAC, EMEA, and the Americas, so the coverage captures both mature reimbursement markets and faster-growing outpatient demand.
Distribution of primary research fieldwork respondents
| Company type | Respondent position | Region |
|---|---|---|
| Top tier: 28% | CXOs: 13% | APAC: 50% |
| Mid tier: 53% | Functional/Unit leaders: 31% | EMEA: 32% |
| Smaller Players: 19% | Managers: 56% | Americas: 18% |
Market-Sizing & Forecasting
Sizing starts with a top-down build where orthopedic burden and treated patient pools are translated into brace consumption. We then reconstruct value using typical usage rates and average selling prices across key product families. To keep totals realistic, we corroborate results with selective bottom-up approximations, including sampled supplier revenue roll-ups, distributor channel checks, and volume times ASP spot checks for high-use categories like knee, ankle, and spinal supports.
Several model inputs drive outcomes, including sports injury incidence, osteoarthritis and low back pain prevalence, outpatient orthopedic visit volumes, post-surgery rehabilitation trends, and the mix shift between retail, e-commerce, and institutional purchasing. Pricing is treated carefully because premium hinged and rigid products do not move the same way as soft supports, and currency timing can change the reported year value. For forecasting, we use scenario analysis, supported by expert views on procedure recovery, aging population effects, and adoption of preventive bracing. We then smooth annual growth so it remains consistent with the leading indicators we track. Where direct volume signals are weak for a country, we rely on proxy indicators, such as procedure intensity, import patterns, and channel structure, and we recheck the assumption during interviews before finalizing the number.
Data Validation & Update Cycle
Validation is done through triangulation across independent signals, where the modeled value is compared against trade flows, company revenue exposure to braces, and channel-level price ranges that were repeatedly discussed in interviews. Outliers are flagged early, and if a region shows a sharp jump without support from injury, procedure, or pricing indicators, we recheck the inputs and rerun the sensitivity until the variance can be explained.
Before sign-off, the model and narrative go through multi-step analyst reviews so assumptions remain consistent across regions and years. Reports are refreshed annually, and interim updates are triggered when material events occur, such as reimbursement changes or major channel disruptions. Right before delivery, we complete a final pass using the latest available public releases and recent primary feedback.
Mordor Intelligence's Orthopedic Braces and Supports Market Size Versus Other Published Estimates
Published market values for orthopedic braces and supports can vary, even when the topic name looks identical. The gaps usually come from how products are grouped, which channels are treated as in-scope, the year chosen for pricing and currency conversion, and how quickly the model is refreshed when procedure volumes or retail demand change.
Some published totals appear to fold in a wider set of orthotics or adjacent rehabilitation aids. A few also lean heavily on retail channel expansion assumptions without tying those shifts back to treated patient volumes. In the split contrast that matters most here, the broader estimates often count more product families. Mordor Intelligence limits the total to braces and supports that are explicitly orthopedic stabilization or support devices, and it keeps pricing progression tied to channel mix checks and annual refresh reviews.
Benchmark comparison
| Source | Market Size | Gaps in Research Methodology |
|---|---|---|
| Mordor Intelligence | USD 4.81 B (2025) | |
| Global Consultancy A | USD 4.93 B (2025) | Uses a faster growth profile and a shorter forecast window, and channel expansion appears to be weighted more than procedure-linked demand checks, which can lift near-term value. |
| Industry Research Publisher B | USD 3.21 B (2025) | Applies narrower pricing and mix assumptions across brace types and channels. The model structure emphasizes selected distribution paths, which can undercount institutional and specialty clinic demand. |
The comparison shows that small scope choices and pricing logic can move the total by a meaningful margin, even within the same year. By keeping the count tied to orthopedic-use devices, then checking growth against injury, procedure, and channel signals, the final number stays traceable to clear inputs and can be repeated consistently in future updates.
Key Questions Answered in the Report
What is the current value of the orthopedic braces and supports market?
The orthopedic braces and supports market size reached USD 4.99 billion in 2026 and is forecast to hit USD 6.12 billion by 2031.
Which product category is growing fastest?
Upper-extremity braces are projected to record the quickest 6.06% CAGR through 2031, buoyed by rising rotator cuff and elbow ligament procedures.
How significant is Asia-Pacific to future growth?
Asia-Pacific is forecast to expand at a 7.27% CAGR between 2026-2031, supported by streamlined regulations in China and manufacturing incentives in India.
Are smart braces reimbursed?
In the United States, sensor-enabled braces can qualify for Remote Therapeutic Monitoring codes introduced in 2024, providing a pathway to reimbursement.
What are the main barriers to adoption of premium braces?
High device cost, fragmented reimbursement for over-the-counter products, and persistent counterfeit circulation remain the primary hurdles.