
Market Overview
| Study Period | 2021 - 2031 |
|---|---|
| Market Size (2026) | USD 5.48 Billion |
| Market Size (2031) | USD 8.62 Billion |
| Growth Rate (2026 - 2031) | 9.49 % |
| Fastest Growing Market | Europe |
| Largest Market | Asia Pacific |
| Market Concentration | Low |
Major Players
*Disclaimer: Major Players sorted in no particular order Image © Mordor Intelligence. Reuse requires attribution under CC BY 4.0. |
|
Organic Tea Market Analysis by Mordor Intelligence
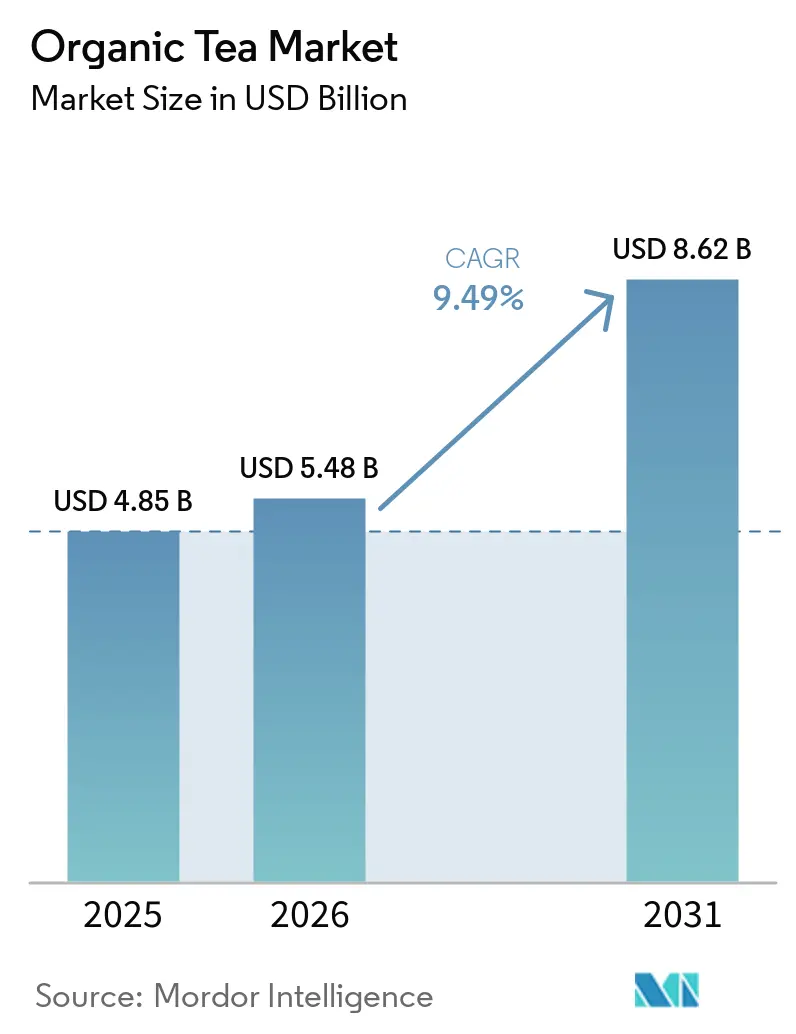
The organic tea market size in 2026 is estimated at USD 5.48 billion, growing from 2025 value of USD 4.85 billion with 2031 projections showing USD 8.62 billion, growing at 9.49% CAGR over 2026-2031. Heightened health awareness, stringent organic-farming regulations, and a premium market positioning have reshaped consumer expectations for clean-label beverages. Supermarkets, cafés, and online platforms are increasingly dedicating shelf space to green, herbal, and functional tea blends. Moreover, sustainability credentials—such as carbon-neutral farms, regenerative practices, and recyclable packaging—have emerged as key differentiators. While Asia-Pacific leads in volume, bolstered by its agricultural expertise and a burgeoning middle class, Europe spearheads value growth, driven by established certification regimes and robust purchasing power. The organic tea market is witnessing a disciplined expansion phase, underscored by vertical integration, stricter enforcement of organic standards, and strategic acquisitions. In this evolving landscape, certified supply, brand authenticity, and an omni-channel presence are paramount.
Key Report Takeaways
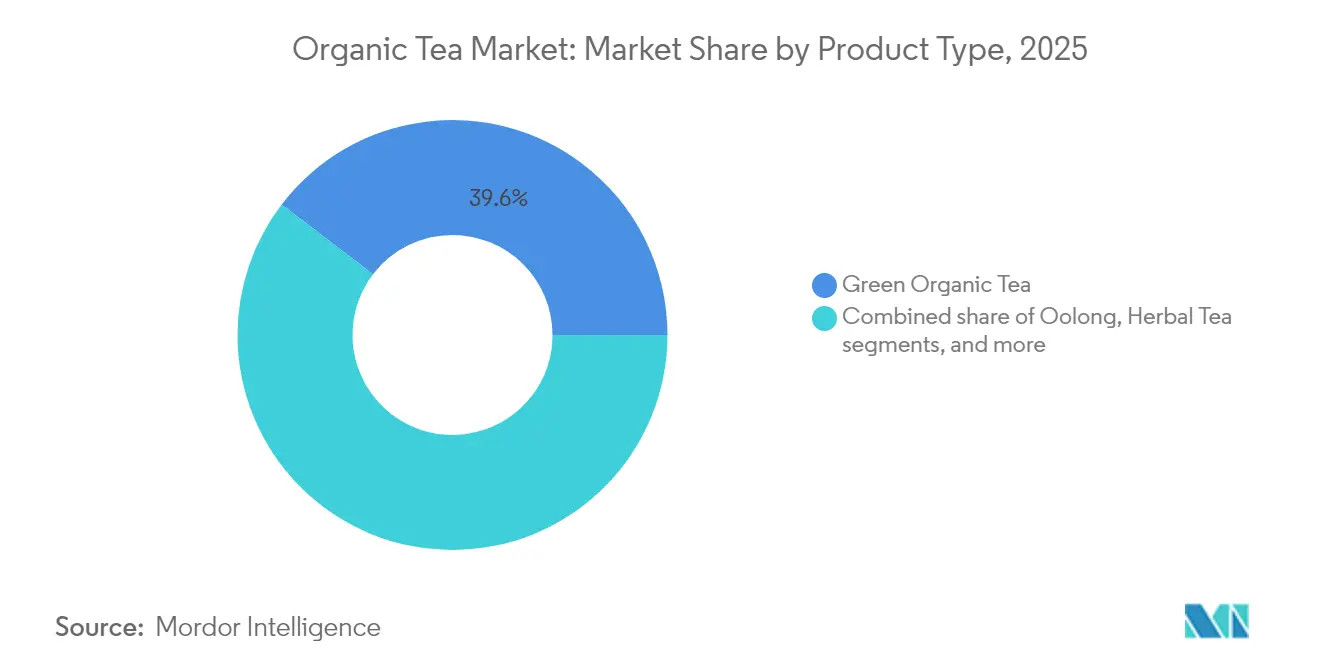
- By type, green tea led with 39.62% organic tea market share in 2025; herbal/fruit infusions are projected to advance at a 10.73% CAGR through 2031.
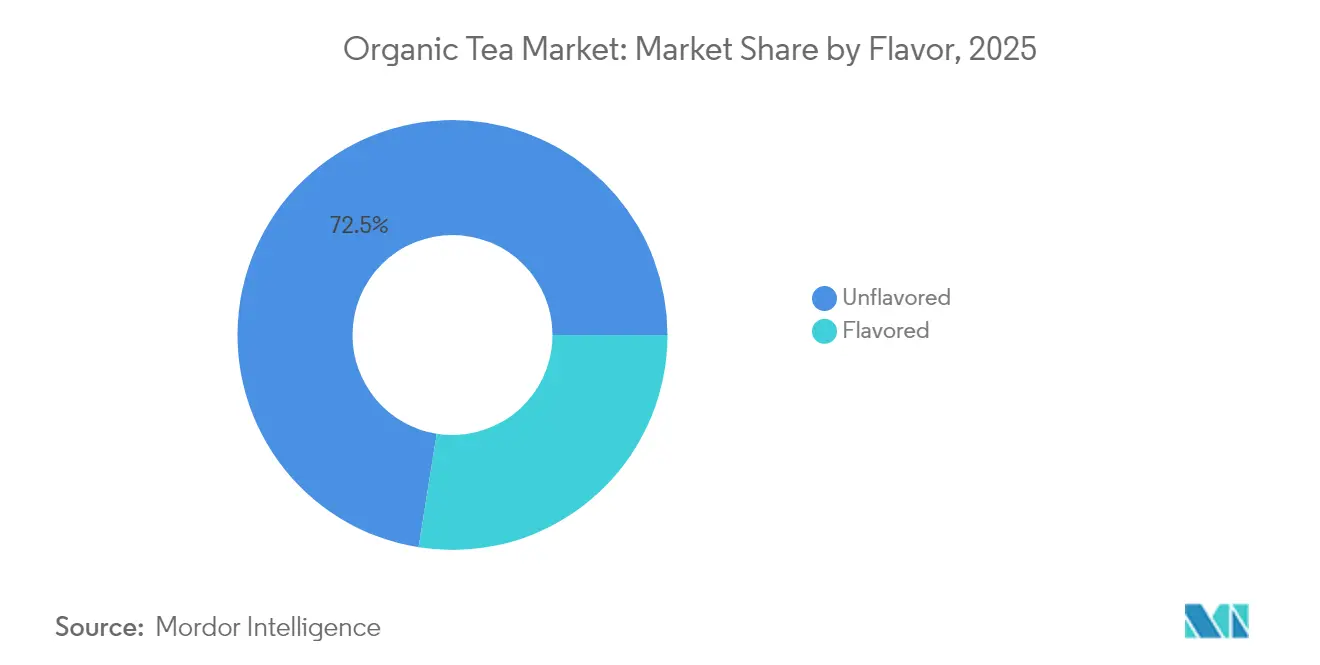
- By flavor, the unflavored segment accounted for 72.48% of the organic tea market size in 2025, while naturally flavored variants are set to expand at 10.07% CAGR between 2026-2031.
- By packaging, cartons held 34.62% revenue share in 2025; tins/cans are the fastest-growing format at 13.46% CAGR to 2031.
- By distribution channel, off-trade outlets controlled 51.74% of 2025 sales, but on-trade venues are expected to grow at 13.23% CAGR, reflecting strong café and restaurant demand.
- By geography, Asia-Pacific dominated with 41.68% revenue share in 2025, whereas Europe is forecast to register the quickest regional CAGR at 9.80% from 2026-2031.
Note: Market size and forecast figures in this report are generated using Mordor Intelligence’s proprietary estimation framework, updated with the latest available data and insights as of 2026.
Market Trends and Insights
Drivers Impact Analysis of Organic Tea Market*
| Driver | (~) % Impact on CAGR Forecast | Geographic Relevance | Impact Timeline |
|---|---|---|---|
| Rising Health Awareness Increases Demand for Chemical-Free Beverages | +3.20% | Global, with stronger impact in North America and Europe | Medium term (3-4 years) |
| Eco-Conscious Consumers Prefer Tea Sourced from Sustainable and Organic Farming Practices | +2.70% | Europe, North America, Urban APAC | Long term (≥ 5 years) |
| Government Incentives Boosts Growth by Promoting Organic Agriculture Adoption | +1.50% | Europe, North America, India | Medium term (3-4 years) |
| Premium Positioning of Organic Tea Appeals to Affluent Consumers | +2.10% | Global, with concentration in urban centers | Short term (≤ 2 years) |
| Functional Benefits Like Detox and Relaxation Drive Organic Tea Popularity | +2.40% | Global, with stronger impact in North America and Europe | Medium term (3-4 years) |
| Growth in E-Commerce Platforms Fueling the Market Growth | +1.90% | Global, with acceleration in APAC and North America | Short term (≤ 2 years) |
| Source: Mordor Intelligence | |||
Rising Health Awareness Increases Demand for Chemical-Free Beverages
The rising health awareness among consumers has significantly increased the demand for chemical-free beverages, a key driver in the organic tea market. For instance, the United States Department of Agriculture (USDA) has reported a steady rise in organic product sales, including beverages, over the past decade. According to the USDA's 2023 Organic Survey, organic beverage sales accounted for a significant portion of the USD 63 billion organic market in the United States. Similarly, the Organic Trade Association (OTA) highlighted in its 2023 report that organic beverage sales grew by 8% year-over-year, driven by consumer preference for healthier alternatives. In Europe, the European Commission's "Farm to Fork" strategy has further encouraged the adoption of organic products, including tea, by promoting sustainable and chemical-free agricultural practices. Additionally, leading companies like Unilever, through its Lipton brand, have emphasized their commitment to offering organic and chemical-free tea options, as outlined in their latest annual report. Tata Consumer Products Limited, in its 2023 annual report, highlighted the expansion of its organic tea portfolio to cater to the growing consumer base seeking chemical-free options [1]Tata Consumer Products Limited, "Annual Report-2023", www.tataconsumer.com. These developments underscore the growing trend of health-conscious consumption, further propelling the organic tea market.
Eco-Conscious Consumers Prefer Tea Sourced from Sustainable and Organic Farming Practices
The growing preference for tea sourced from sustainable and organic farming practices is a significant driver of the Organic Tea Market. For instance, the United States Department of Agriculture (USDA) has established strict guidelines for organic certification, ensuring that tea producers adhere to sustainable farming methods [2]U.S. Department of Agriculture, "USDA Certified Organic: Understanding the Basics", www.ams.usda.gov. Similarly, the European Union's organic farming regulations promote environmentally friendly agricultural practices, further supporting the market's growth. According to the Food and Agriculture Organization (FAO), sustainable farming practices not only reduce environmental impact but also improve soil health, which is critical for tea cultivation. Additionally, companies like Unilever, through their Lipton brand, have committed to sourcing 100% of their tea sustainably, as highlighted in their annual sustainability reports. Companies like Tata Consumer Products and Unilever PLC, also emphasized its focus on sustainable sourcing and organic product offerings to meet evolving consumer preferences. Furthermore, initiatives like the Rainforest Alliance certification and Fair Trade certification are gaining traction, with many tea producers aligning their operations to meet these standards. These efforts reflect the increasing alignment of industry players with consumer demand for eco-conscious products, thereby driving the market forward.
Government Incentives Boosts Growth by Promoting Organic Agriculture Adoption
Government initiatives and incentives have significantly contributed to the growth of the organic tea market by promoting the adoption of organic agriculture practices. For instance, the United States Department of Agriculture (USDA) provides financial assistance through programs like the Organic Certification Cost Share Program (OCCSP), which helps farmers and processors offset the costs of organic certification. Similarly, the European Union has implemented the Common Agricultural Policy (CAP), which includes subsidies and grants to support organic farming. In India, the Paramparagat Krishi Vikas Yojana (PKVY) scheme encourages organic farming by offering financial aid and training to farmers [3]Ministry of Agriculture & Farmers Welfare, "PARAMPARAGAT KRISHI VIKAS YOJANA", www.pib.gov.in. According to the Food and Agriculture Organization (FAO), global organic farming land area increased by over 20% in the last decade, driven by such government initiatives. Additionally, companies such as Unilever and Tata Consumer Products have highlighted in their annual reports their commitment to sourcing organic tea, aligning with government policies and consumer demand for sustainable products. For example, Unilever reported a 15% increase in its procurement of organic tea in 2023, reflecting its alignment with sustainability goals. These efforts collectively drive the expansion of the organic tea market by fostering a supportive ecosystem for organic agriculture.
Premium Positioning of Organic Tea Appeals to Affluent Consumers
The premium positioning of organic tea serves as a significant driver for the organic tea market, particularly appealing to affluent consumers. For instance, according to the Organic Trade Association (OTA), the demand for organic beverages, including tea, has been steadily increasing, with a reported growth of over 5% in 2023. Additionally, government initiatives promoting organic farming practices, such as the USDA Organic Certification program, have further bolstered consumer trust in organic products. The European Union's Common Agricultural Policy (CAP) also supports organic farming through subsidies and incentives, further driving the market. Companies like Unilever, through their Lipton Organic Tea range, and Tata Consumer Products, as highlighted in their annual reports, have emphasized the rising preference for premium organic tea among high-income groups. Furthermore, the Tea Board of India has reported a notable increase in the production and export of organic tea, reflecting its growing demand globally. These factors collectively underscore the growing appeal of premium organic tea to affluent demographics.
Restraints Impact Analysis of Organic Tea Market*
| Restraint | (~) % Impact on CAGR Forecast | Geographic Relevance | Impact Timeline |
|---|---|---|---|
| High Production Costs Make Organic Tea Expensive for Many Consumers | -1.70% | Global, with stronger impact in price-sensitive markets | Medium term (3-4 years) |
| Supply Chain Limitations Hinder Consistent Organic Tea Availability | -0.40% | Global, with acute impact in emerging markets | Short term (≤ 2 years) |
| Strong Competition from Conventional and Flavored Teas Limits Organic Tea's Market Growth | -0.90% | Global, with stronger impact in traditional tea markets | Long term (≥ 5 years) |
| Lack of Knowledge on Organic Farming Hindering the Market Growth | -1.00% | APAC core, Africa, with spill-over to Latin America | Medium term (3-4 years) |
| Source: Mordor Intelligence | |||
High Production Costs Make Organic Tea Expensive for Many Consumers
High production costs remain a significant restraint for the global organic tea market, driven by labor-intensive farming practices, strict organic certification standards, and reliance on natural fertilizers and pest control methods, all of which elevate production expenses compared to conventional tea. The limited scale of organic tea farming further exacerbates costs, as achieving economies of scale is challenging, while lower yields due to the absence of synthetic inputs add to the financial strain. The certification process, requiring regular audits and compliance with stringent regulations, is both expensive and time-consuming, compounding the cost burden. Furthermore, the underdeveloped supply chain for organic tea compared to conventional tea leads to higher logistics and distribution expenses, resulting in a premium price point that restricts accessibility, particularly in price-sensitive markets. This pricing challenge continues to impede the global adoption of organic tea, despite increasing consumer awareness and demand for organic products, while also limiting producers' ability to compete with conventional tea manufacturers who benefit from lower production costs and established supply chains. Consequently, affordability remains a critical concern, posing significant barriers to the growth of the global organic tea market.
Supply Chain Limitations Hinder Consistent Organic Tea Availability
The global organic tea market is significantly restrained by supply chain limitations that disrupt the consistent availability of organic tea. These challenges arise from the complexity of sourcing certified organic raw materials, limited production capacities, and stringent regulatory requirements, with smaller-scale farming operations often unable to meet growing global demand. The time-consuming and costly certification process for organic products further complicates the supply chain, while transportation and storage issues, such as maintaining organic certifications during transit, exacerbate disruptions. Additionally, the market's reliance on specific geographic regions for organic tea cultivation creates vulnerabilities to climate change, natural disasters, and geopolitical tensions, which further destabilize supply chains. The lack of advanced infrastructure in key producing regions amplifies inefficiencies in processing, packaging, and distribution, ultimately hindering the market's ability to ensure a steady supply of organic tea and affecting its growth potential during the forecast period. As consumer demand for organic tea continues to rise, addressing these supply chain constraints will be critical for market players to achieve sustainable growth and meet evolving consumer expectations.
*Our forecasts treat driver/restraint impacts as directional, not additive. The impact forecasts reflect baseline growth, mix effects, and variable interactions.
Organic Tea Market Segment Analysis
By Product Type:
Green Tea Leads, Herbal Infusion Tea Gain MomentumIn 2025, green organic tea holds a 39.62% market share, establishing itself as the leading segment. This leadership is attributed to its proven health benefits and increasing scientific validation of its functional properties. The shift toward healthier beverage options has significantly boosted its demand. Key benefits, including weight management, metabolism improvement, and antioxidant content, have driven its popularity among health-conscious consumers. Additionally, the rise in organic certifications and sustainable farming practices has strengthened consumer trust in green organic tea products.
The herbal and fruit infusion segment is projected to grow at a strong 10.73% CAGR from 2026 to 2031, outpacing other segments. This growth is driven by innovative flavor combinations and targeted functional claims, appealing to younger consumers seeking caffeine-free alternatives. The segment benefits from rising demand for natural and organic ingredients and increased awareness of the health benefits linked to herbal and fruit infusions. These beverages, often marketed as stress relievers, immunity boosters, and digestive aids, align with evolving consumer preferences. Furthermore, advancements in packaging and marketing strategies have enhanced the appeal of herbal and fruit infusions, solidifying their position in the global organic tea market.


By Packaging:
Catons Reign Supreme, Tins Grow RapidlyIn 2025, cartons lead the global organic tea packaging market with a 34.62% share, driven by their cost-effectiveness, sustainability, and shelf stability. These features make cartons a preferred choice for manufacturers and retailers aiming to meet consumer demand for eco-friendly and practical packaging. Paper pouches, another significant segment, offer comparable sustainability benefits with added flexibility. Their lightweight design reduces transportation costs, making them particularly attractive to specialty retailers and e-commerce platforms that require adaptable packaging solutions.
Tins and cans, while currently holding a smaller share of the organic tea packaging market, are expected to grow at an 13.46% CAGR from 2026 to 2031. Their premium appeal resonates with consumers seeking high-quality organic tea products, while their ability to preserve freshness and aroma aligns with the quality standards expected by organic tea buyers. These attributes are likely to drive their increased adoption during the forecast period, particularly among brands targeting the premium segment.
By Distribution Channel:
On-Trade Growth Transforms MarketIn 2025, the off-trade segment held a 51.74% market share, with supermarkets and hypermarkets serving as key purchase points for mainstream organic tea buyers. These outlets meet the growing demand from health-conscious consumers by offering convenience and accessibility. Convenience and grocery stores also contribute significantly, attracting impulse buyers who make unplanned purchases during routine shopping. Online retail channels have gained traction, offering the widest product range and detailed information that appeals to informed organic tea consumers, enabling product comparisons and informed decisions, driving growth in the off-trade segment.
The on-trade segment, though smaller, is projected to grow at a strong CAGR of 13.23% from 2026 to 2031. This highlights the importance of cafes, restaurants, and hotels in the global organic tea market. These venues enhance brand visibility and encourage consumers to explore premium organic tea options. The shift toward premium and specialty organic teas is driving innovation, with brands developing exclusive blends and tailored packaging for food service applications. This trend is reshaping market competition as companies strive to differentiate and capture a larger share of this channel. Additionally, the segment benefits from the rising popularity of tea culture and the growing number of tea-focused establishments, which introduce consumers to a broader range of organic tea options.
By Flavor:
Unflavored Leads, Flavored Gains MomentumIn 2025, the unflavored segment accounted for 72.48% of the global organic tea market, reflecting strong consumer demand for the authentic and pure qualities of natural organic tea. This preference stems from a focus on minimal processing and clean ingredients, aligning with wellness goals. The segment benefits from the growing demand for clean-label products, as consumers increasingly value transparency in sourcing and production. Additionally, its association with traditional tea-drinking cultures enhances its appeal among health-conscious and culturally aware buyers. In contrast, the flavored segment, while smaller, is projected to grow at a 10.07% CAGR from 2026 to 2031, driven by advancements in natural flavoring techniques that maintain organic standards while improving taste. The segment's growth is fueled by the popularity of innovative flavor combinations, such as fruit-infused, floral, and herbal blends, catering to diverse consumer preferences.
Younger consumers, particularly millennials and Gen Z, are driving this trend, seeking flavor exploration without compromising health benefits. These demographics view flavored organic teas as a balance of indulgence and wellness, creating opportunities for brands that can combine organic authenticity with appealing taste profiles. Companies investing in R&D to develop unique, naturally flavored teas are well-positioned to capture market share. The flavored segment's growth is further supported by the increasing availability of organic tea products across online and offline retail channels, expanding accessibility. As consumer preferences evolve, the global organic tea market is set for dynamic growth, with both unflavored and flavored segments shaping its trajectory.
Geography Analysis
APAC, EMEA and the Americas Organic Tea Market
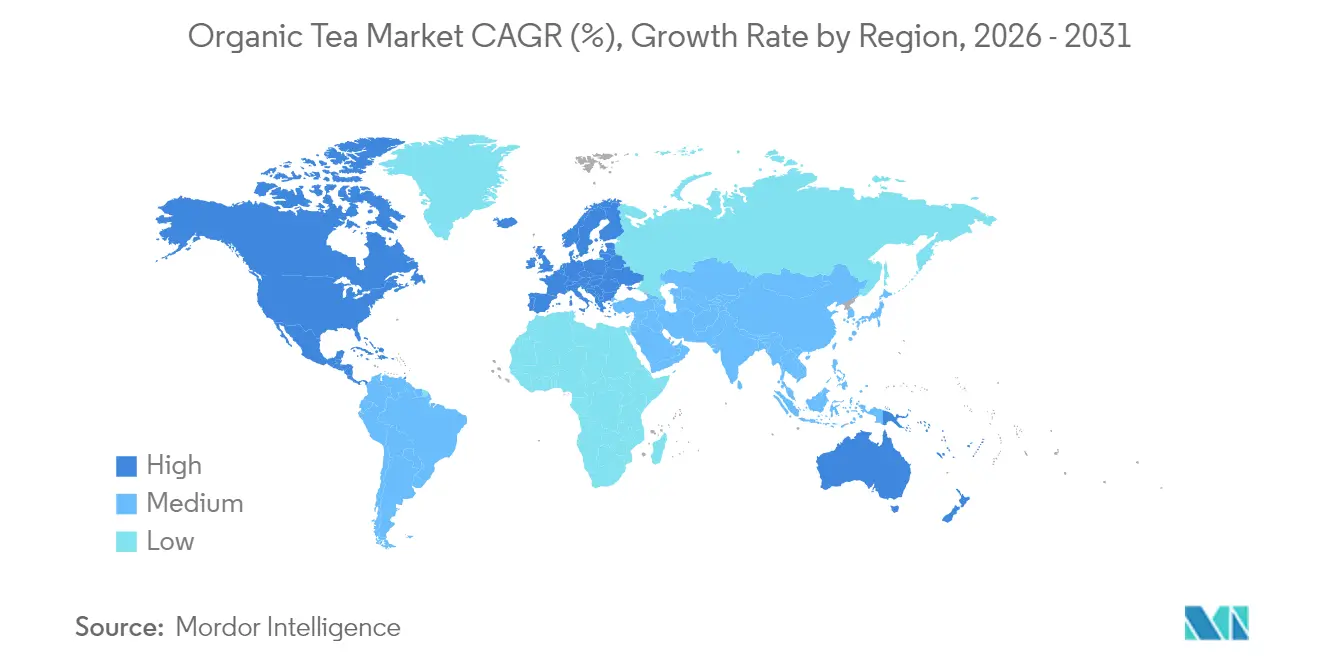
In 2025, Asia-Pacific held a 41.68% share of the organic tea market, driven by its established role as a global tea production hub and rising domestic demand for premium organic teas. China leads with strong production capabilities and a growing middle class focused on health and wellness. In India, urban areas are reshaping tea consumption with specialized cafés boosting demand for premium organic options. Japan drives innovation in cultivation and processing, while Australia and South Korea see growth fueled by health-conscious urban populations. However, the region faces challenges in standardizing organic certifications due to varying regulatory frameworks.
Europe is projected to grow at a 9.80% CAGR from 2026 to 2031, supported by increasing consumer awareness of sustainability and a robust organic certification system. Strict regulations enhance trust in certifications, while a shift toward premium, ethically sourced products drives demand. In Switzerland, specialized tea retailers are aligning with these trends, introducing innovative products and campaigns focused on quality and authenticity.
North America, despite a smaller market share, shows significant growth potential. The U.S. organic tea market benefits from a health and wellness trend, with the ready-to-drink segment standing out as organic certification differentiates premium products. South America is emerging as an innovation hub, exemplified by Ecuador's Tippytea Blends, which supports fair trade, sources from local families, and uplifts around 250 households. Their unique Andean flavors are gaining global recognition. In the Middle East & Africa, markets like South Africa and the UAE are experiencing growing interest in organic teas. Premium positioning and health benefits appeal to affluent urban consumers, while traditional tea culture and rising sustainability awareness among younger demographics provide a strong foundation for market growth.

Regulatory Landscape
Organic tea is shaped by stringent certification, labeling, and import-control regimes that affect cross-border trade. In the European Union, Regulation (EU) 2018/848 provides the core framework for organic production and labeling, and its compliance-based import regime has been in full application since January 2025. This has reinforced requirements around certification bodies, operator controls, and import documentation.
Import compliance is tightening further through digital controls and time-bound changes to recognition mechanisms. The EU system continues to rely on TRACES electronic certificates for organic imports, while existing country-level equivalence recognitions are scheduled to expire by 31 December 2026, which pushes exporters toward trade agreement-based pathways to maintain EU market access. In the United States, the USDA National Organic Program (NOP) requires electronic NOP Import Certificates under the Strengthening Organic Enforcement framework, and in February 2026 the USDA AMS moved the tariff flag code for certain organic import HTS codes in the Automated Commercial Environment (ACE) to mandatory filing status (AM8), increasing scrutiny on shipment declarations and document integrity.
Value Chain Analysis
The organic tea value chain begins with organic-compliant cultivation (tea estates and smallholders), where synthetic fertilizers and chemical pesticides are prohibited. This increases reliance on integrated soil management, nutrient recycling, and manual or mechanical pest and disease control. Upstream compliance is formalized through certification systems aligned with major standards such as USDA NOP and EU Regulation (EU) 2018/848, with audits and documentation requirements extending into harvesting, primary processing, and handling to protect organic integrity.
After farmgate aggregation, tea moves through local traders, brokers, cooperatives, and processing units that use segregation and traceability controls, then on to exporters, brand owners, and downstream channels spanning off-trade retail and on-trade foodservice. Key enablers include certification bodies and agricultural research and extension support. Recurring bottlenecks include certification and paperwork burdens for smallholders, higher logistics costs tied to maintaining organic segregation, and added complexity from digital import documentation for major destinations, including EU e-certification systems and US electronic NOP import certificates. These constraints encourage cooperative models and vertical integration among brands to secure certified supply and reduce compliance risk.
Competitive Landscape
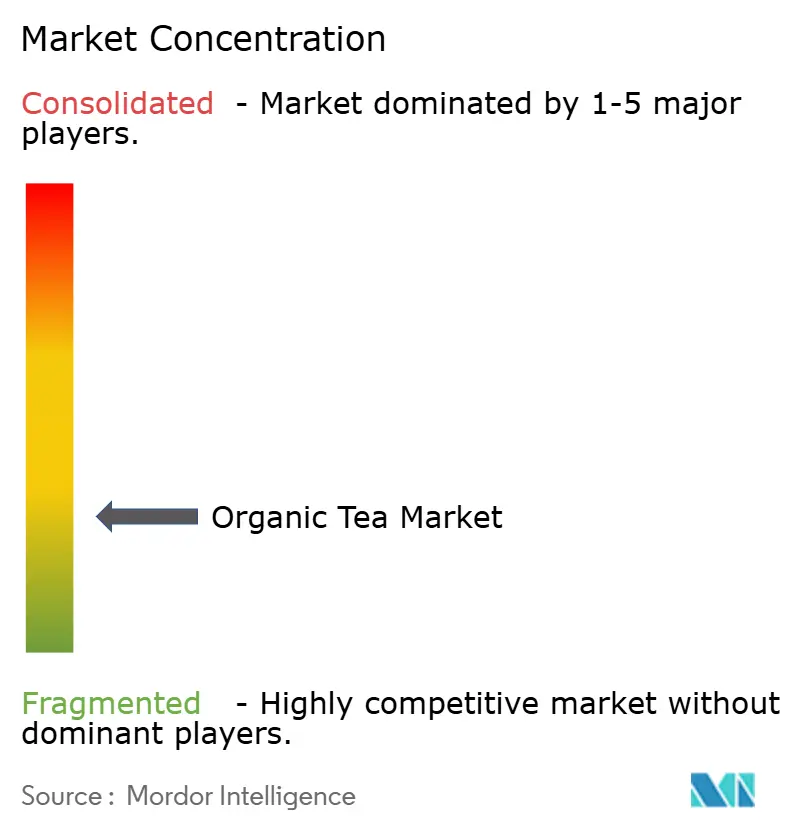
The organic tea market is fragmented, fostering competition as established players contend with innovative entrants. Companies are increasingly adopting vertical integration to secure organic supply chains and strengthen their market position. For example, in January 2024, Tata Consumer Products acquired Organic India to expand its wellness portfolio and enhance distribution synergies. This reflects a broader consolidation trend, offering larger players advantages in certification compliance and distribution reach. Smaller players, however, face challenges due to limited resources and infrastructure.
Sustainability has become a critical differentiator in the market. Companies are moving beyond organic certification to implement initiatives like carbon neutrality, ethical sourcing, and eco-friendly packaging. These efforts align with consumer demand for environmentally responsible products, helping to build brand loyalty. Larger players, with greater resources, are better positioned to execute these strategies, intensifying competition.
Consumer preferences and regulatory requirements are also reshaping the market. Demand for transparency in sourcing and production is driving investments in traceability and supply chain management. Meanwhile, stricter regulations on organic certification and labeling are pushing companies to ensure compliance while managing costs. These factors, combined with consolidation and sustainability trends, are creating a challenging environment for smaller players. The market continues to evolve, driven by innovation, acquisitions, and a focus on sustainability.
Organic Tea Industry Leaders
-
Unilever Plc
-
Hain Celestial Group
-
Tata Consumer Products Ltd.
-
Associated British Foods plc
-
Harney & Sons Fine Teas
- *Disclaimer: Major Players sorted in no particular order
Organic Tea Market Companies Covered in this Report
- Tata Consumer Products Ltd.
- Unilever PLC
- Hain Celestial Group
- Bigelow Tea Company
- Associated British Foods plc
- East West Tea Company LLC
- Harney & Sons Fine Teas
- Equal Exchange
- Numi Organic Tea
- Rishi Tea & Botanicals
- The Republic of Tea
- Dilmah Ceylon Tea Company PLC
- Clipper Tea Co.
- Traditional Medicinals
- Halssen & Lyon GmbH
- Madura Tea Estates
- Teapigs Ltd
- R.Twining & Co.
- Pukka Herbs Inc.
- Full Leaf Tea Company

Market Opportunities and Future Outlook
Traceability-led differentiation is a clear whitespace as enforcement and documentation move deeper into digital workflows across importing regions. EU organic imports require an electronic certificate of inspection (e-COI) via TRACES, and the United States mandates electronic NOP Import Certificates, which increases the value of tighter lot-level tracking from fresh-leaf procurement through processing and export. Standard-setting activity supports this shift: China implemented GB/T 46114-2025 on 1 April 2026 to define a technical framework for tea supply chain management across procurement, processing, and distribution. It provides a template for brands and suppliers to strengthen supply chain transparency and operational controls.
Opportunity also shows up in programs and assurance systems that extend beyond organic into measurable sustainability performance, supporting premium positioning and retailer acceptance. Frameworks such as trustea (ISEAL-aligned) encourage structured adoption of better agronomy and performance measurement on tea estates, complementing organic practices such as integrated pest management and input discipline. On the product side, ongoing activity in ready-to-drink and packaged formats, including organic teas in cans and expanded organic assortments from large consumer brands, points to room for innovation that pairs certified organic claims with functional positioning, packaging sustainability, and verifiable sourcing data across major off-trade and on-trade channels.
Recent Industry Developments in Organic Tea Market
- May 2026: Tata Consumer Products highlighted Organic India performance and ongoing innovation in its wellness portfolio, including new formulations under its offerings. The update reinforced organic and functional beverages as a priority growth engine within a scaled distribution platform following the Organic India acquisition.
- January 2026: Unilever Indonesia announced the divestment of its SariWangi tea business to PT Savoria Kreasi Rasa for about IDR 1.5 trillion (around USD 89 million) as part of portfolio optimization. The move reshaped competitive positioning in Indonesia by transferring a mainstream tea asset to a local player while Unilever reallocated focus toward higher-growth FMCG segments.
- August 2024: Wild Orchard Tea Company debuted its Organic Certified Everyday Green Tea, Everyday Black Tea, and Cinnamon Black Tea Bags at Wegmans Food Markets across 90 locations in the Northeast. The launch expanded retail availability for regenerative organic-positioned tea and signaled increasing shelf placement for certified organic offerings in mainstream supermarkets.


Organic Tea Market Report Scope and Research Methodology
Market Definition and Coverage
For this study, the organic tea market covers retail and foodservice sales value of tea that is certified organic, across leaf and bag formats, and across key tea types including black, green, oolong, and herbal blends.
Scope exclusions: Products that are not certified organic, plus unrelated organic beverages and supplements, are not counted in this market sizing.
Segments Covered in This Report
-
By Type
- Black Organic Tea
- Green Organic Tea
- Oolong Organic Tea
- Herbal/Fruit Infusion Organic Tea
- Others
-
By Flavor
- Unflavored
- Flavored
-
By Packaging
- Cartons
- Paper Pouches
- Tins/Cans
- Sachets
- Others
-
By Distribution Channel
-
Off-Trade
- Supermarkets & Hypermarkets
- Convenience/Grocery Stores
- Online Retail Stores
- Other Distribution Channels
- On-Trade
-
Off-Trade
-
By Geography
-
North America
- United States
- Canada
- Mexico
- Rest of North America
-
Europe
- Germany
- United Kingdom
- Italy
- France
- Spain
- Netherlands
- Poland
- Belgium
- Sweden
- Rest of Europe
-
Asia-Pacific
- China
- India
- Japan
- Australia
- Indonesia
- South Korea
- Thailand
- Singapore
- Rest of Asia-Pacific
-
South America
- Brazil
- Argentina
- Colombia
- Chile
- Peru
- Rest of South America
-
Middle East & Africa
- South Africa
- Saudi Arabia
- United Arab Emirates
- Nigeria
- Egypt
- Morocco
- Turkey
- Rest of Middle East and Africa
-
North America
Data Sources, Market Sizing, and Validation
Desk Research
Desk work starts by setting a consistent organic-certification definition and how it appears in trade and agriculture records, so the model does not mix organic and conventional volumes. We mainly use public sources such as USDA Organic and National Organic Program references, FAOSTAT tea and agriculture series, and ITC Trade Map style customs statistics for tea HS codes, along with materials from the International Tea Committee and similar associations.
To turn those signals into usable inputs, we also review annual reports, investor presentations, and sustainability disclosures from tea brand owners and packers. We then cross-check with reputable press coverage and retail-channel updates. Where needed, a paid subscription for company financials and intelligence is used to align revenue ranges and to avoid double counting across parent and subsidiary entities. A patent database is also reviewed to spot packaging and processing shifts that can change product mix. These desk sources are illustrative, and many other public and subscription sources were also referred to for data collection, validation, and clarification.
Primary Interviews and Surveys
Primary work is used to confirm the split between leaf, tea bags, and newer formats, and to test pricing and organic premium assumptions by channel. We speak with tea growers and processors, brand owners, distributors, and retail and foodservice buyers across APAC, EMEA, and the Americas, so the inputs reflect sourcing, certification use, and consumption behavior rather than only published claims.
Distribution of primary research fieldwork respondents
| Company type | Respondent position | Region |
|---|---|---|
| Top tier: 33% | CXOs: 13% | APAC: 47% |
| Mid tier: 50% | Functional/Unit leaders: 31% | EMEA: 33% |
| Smaller Players: 17% | Managers: 56% | Americas: 20% |
Market-Sizing & Forecasting
The core sizing starts with a top-down build that reconstructs organic tea demand from consumption signals and trade flows, then converts it to value using segment-level price ladders. In practice, we map organic-eligible tea volumes by region, adjust for packaged tea conversion and channel mix, and apply organic premiums that were validated through interviews.
Several market-specific variables are tracked to keep the model realistic, including organic certification penetration in tea-growing origins, export and import movements for key tea categories, the mix shift between tea bags and loose leaf, online versus offline channel shares, and observed organic price premiums by type and pack size. When data is missing at a country level, gaps are handled using proxy markets with similar tea consumption patterns and then checked against retailer assortment and import reliance.
To corroborate the totals, selective bottom-up approximations are also run using sampled brand and private label pricing, typical pack weights, and a reasoned throughput view of key packers and blenders. The results are then reconciled back to the demand pool. For forecasting, scenario analysis is used around organic certification expansion, pricing pressure, and channel shifts, and the scenario paths are aligned to expert views gathered during primary discussions.
Data Validation & Update Cycle
Outputs are cross-checked against independent signals, including trade value trends, regional tea consumption direction, and organic product launches that can be observed in public channels. If a region shows an abnormal jump, the driver assumptions are revisited, and respondents are re-contacted to confirm whether the change is real or caused by pricing, currency timing, or mix effects.
Before sign-off, the model and its assumptions go through multi-step analyst review, so calculation logic and conversion factors remain consistent across regions. The report is refreshed annually, with interim updates when material events occur, such as major certification rule changes or sharp input-cost swings. Right before delivery, a final pass is done to reflect the latest available public data and validated market signals.
Mordor Intelligence's Organic Tea Market Sizing Compared With Other Published Estimates
It is normal to see different market sizes published for organic tea, because teams do not always count the same products, years, or price points, and the organic definition can be applied differently across blends and formats. Differences can also come from how each model treats channels, the currencies used for conversion, and how frequently assumptions are refreshed.
The benchmark table shows a clear spread, and in Mordor Intelligence's model the value is counted only for certified organic tea sold through measured retail and foodservice channels, with type and packaging mix used to apply realistic organic premiums instead of one flat price uplift.
Benchmark comparison
| Source | Market Size | Gaps in Research Methodology |
|---|---|---|
| Mordor Intelligence | USD 1.58 B (2026) | |
| Industry Study A | USD 0.70 B (2024) | Uses an earlier base year and a narrower revenue pool that can understate markets where organic tea is bought more through online and specialty outlets, and it may classify some herbal infusions differently than true tea. |
| Industry Study B | USD 1.21 B (2024) | Applies a broader interpretation of organic tea types and may rely on slower-moving secondary splits for channel and pricing, which can distort the organic premium when pack sizes and formats change quickly. |
Taken together, the table suggests that scope boundaries and price-mix handling explain most of the gap, more than any single growth assumption. By tying the total to observable trade and consumption signals and then checking premiums and channel splits with market participants, the estimate stays traceable to inputs that can be reviewed and repeated over time.


Key Questions Answered in the Report
What is the current size of the global organic tea market?
The organic tea market is valued at USD 5.48 billion in 2026.
What compound annual growth rate (CAGR) is forecast for the organic tea market through 2031?
The market is projected to expand at a 9.49% CAGR between 2026 and 2031.
Which region holds the largest revenue share in the organic tea market?
Asia-Pacific leads with a 41.68% share as of 2025, supported by deep production expertise and rising middle-class demand.
Which organic tea category is growing the fastest?
Herbal and fruit infusion teas are expected to register the highest growth, advancing at a 10.73% CAGR from 2026 to 2031.
Page last updated on:


 Your data is secure and never sold or shared.


