
Organic Soap Market Size and Share
Market Overview
| Study Period | 2021 - 2031 |
|---|---|
| Market Size (2026) | USD 7.57 Billion |
| Market Size (2031) | USD 10.07 Billion |
| Growth Rate (2026 - 2031) | 5.86 % |
| Fastest Growing Market | Asia-Pacific |
| Largest Market | Asia Pacific |
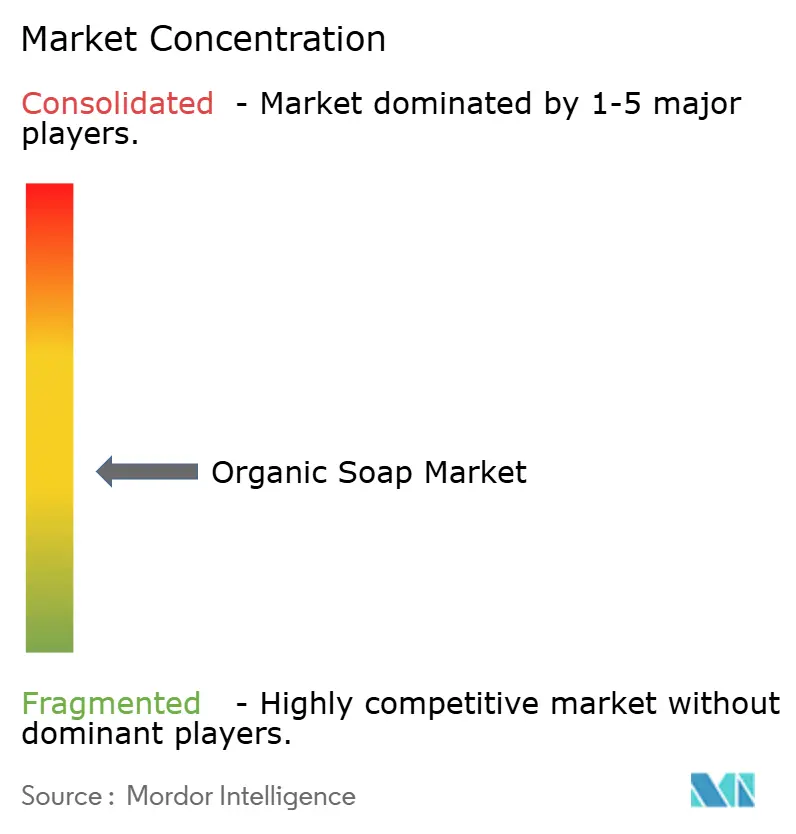
| Market Concentration | Medium |
Major Players
*Disclaimer: Major Players sorted in no particular order Image © Mordor Intelligence. Reuse requires attribution under CC BY 4.0. |
|
Organic Soap Market Analysis by Mordor Intelligence
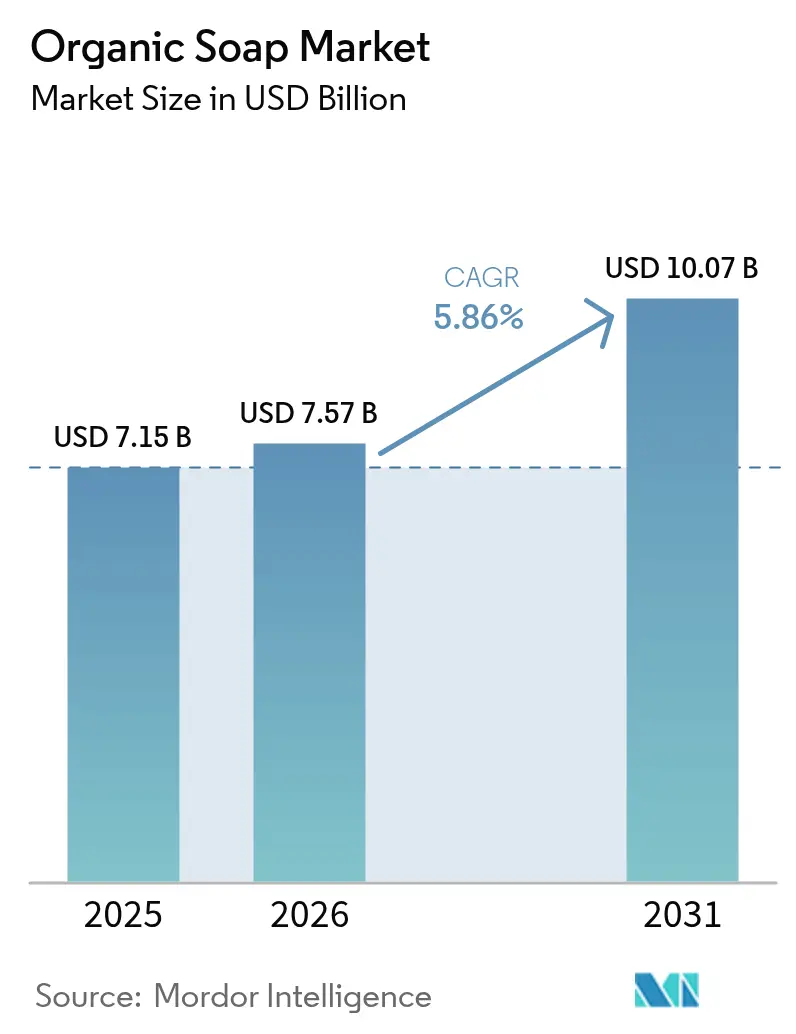
Organic soap market size in 2026 is estimated at USD 7.57 billion, growing from 2025 value of USD 7.15 billion with 2031 projections showing USD 10.07 billion, growing at 5.86% CAGR over 2026-2031. As consumers increasingly gravitate towards clean-label, chemical-free personal care products that embody wellness and sustainability values, the organic bar soap market is witnessing steady expansion. Credible certification frameworks like USDA Organic and COSMOS bolster trust in these offerings. While North America and Europe lead in maturity due to established certifications and demand, the Asia-Pacific region is on the rise, fueled by increasing incomes and a penchant for herbal, traditional formulations. Bar soaps dominate the market: for instance, Sagitta Hand Soap 1911 highlights functional, gentle cleansing by incorporating prebiotic inulin with juniper and pine oils from organic sources. In India, Indo Naturals showcases formulation innovation by blending probiotics with turmeric and herbs in compact shaving-soap formats. Digital platforms and social commerce have emerged as pivotal distribution channels, enabling niche brands to connect directly with global consumers. Concurrently, sustainability trends are driving innovations in biodegradable and minimal-packaging designs, resonating with circular economy objectives. These structural and technological evolutions, coupled with shifting clean-beauty consumer behaviors, pave the way for continued growth in the organic bar soap sector.
Key Report Takeaways
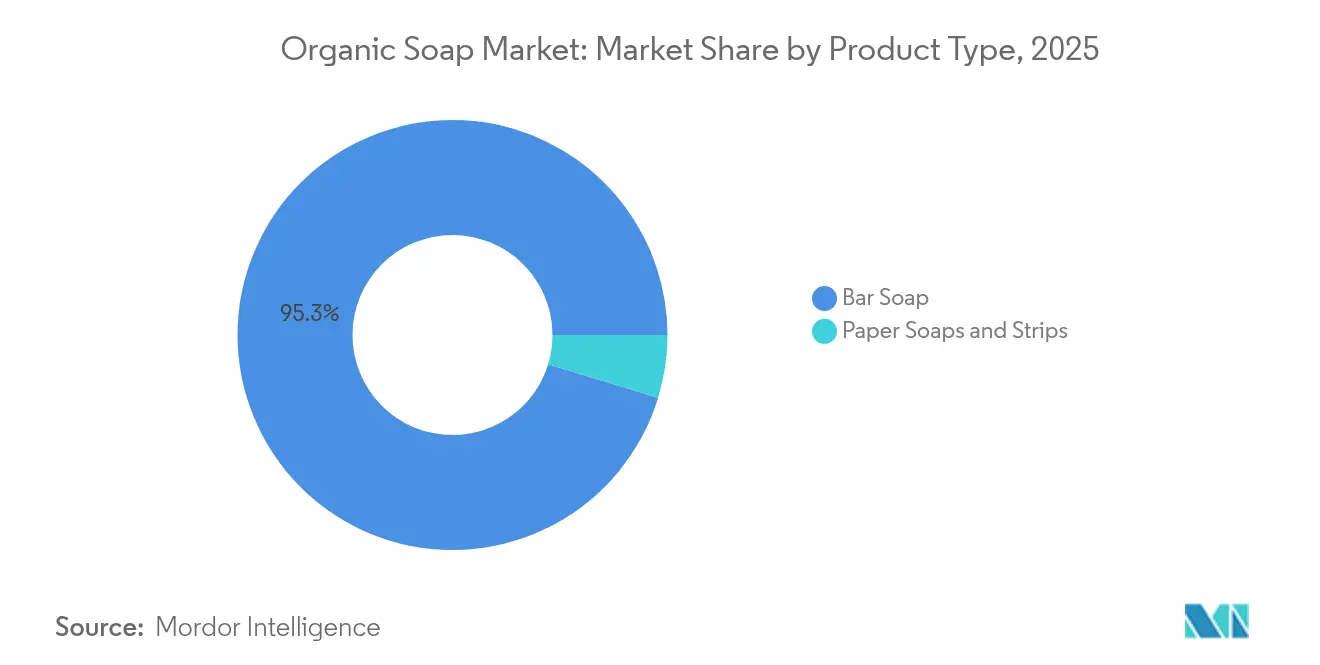
- By product form, bar soap led with 95.29% of the organic soap market share in 2025, whereas paper soaps and strips are advancing at a 5.94% CAGR through 2031.
- By category, the premium segment accounted for the fastest growth, expanding at an 8.28% CAGR to 2031, while the mass segment retained 62.10% share of the organic soap market size in 2025.
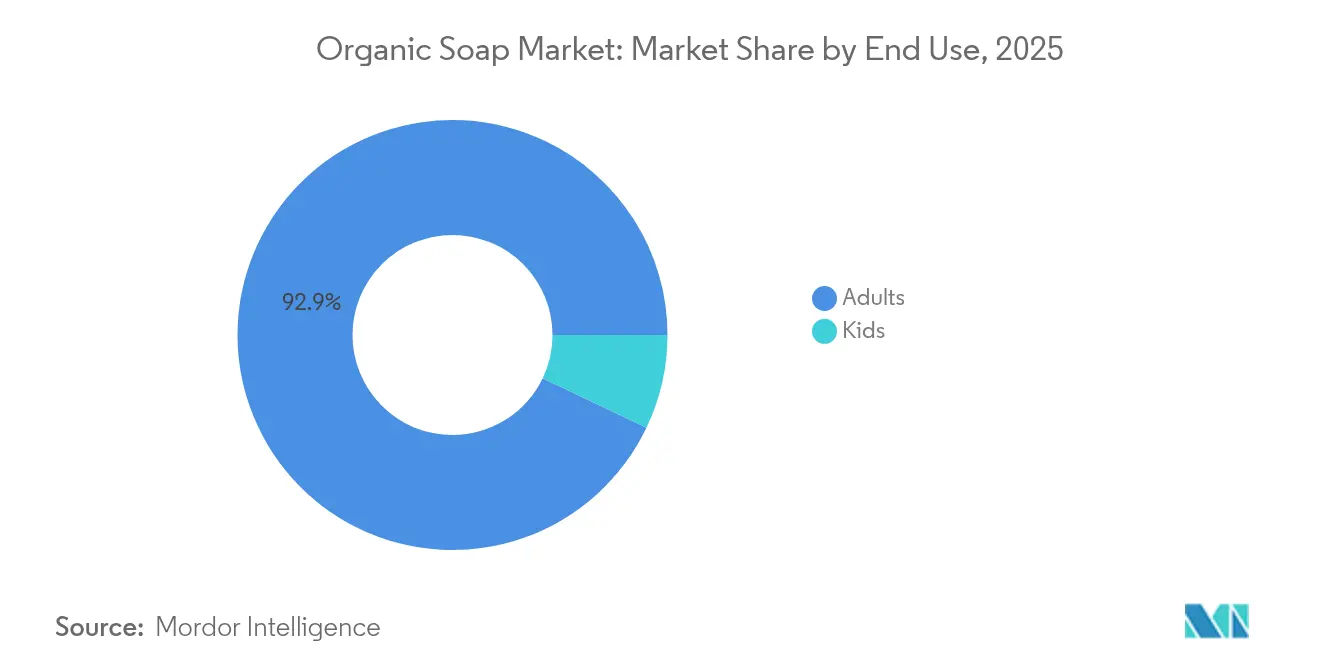
- By end user, adults dominated with 92.90% revenue share in 2025; the kids segment is forecast to accelerate at a 9.10% CAGR to 2031.
- By distribution channel, supermarkets and hypermarkets held 34.66% of the organic soap market size in 2025, yet online retail is projected to grow at a 5.99% CAGR through 2031.
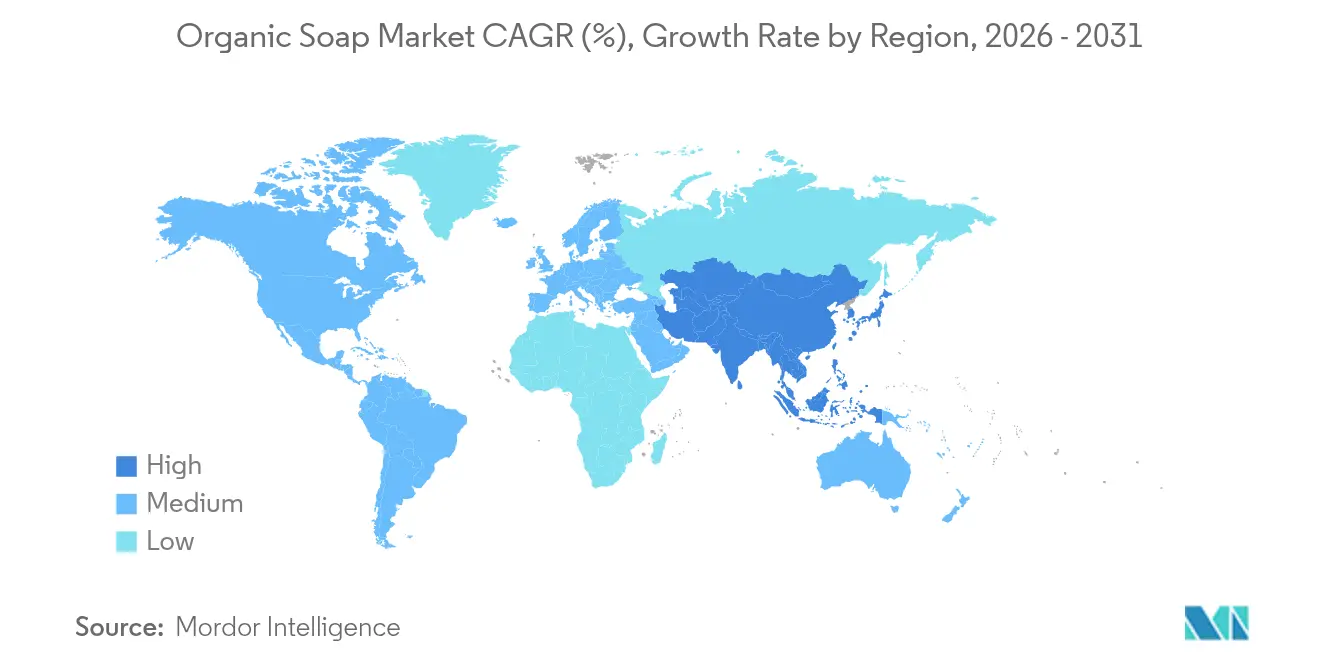
- By geography, Asia-Pacific captured 38.32% organic soap market share in 2025 and is set to post the highest 6.24% CAGR to 2031.
Note: Market size and forecast figures in this report are generated using Mordor Intelligence’s proprietary estimation framework, updated with the latest available data and insights as of 2026.
Market Trends and Insights
Drivers Impact Analysis of Organic Soap Market*
| Driver | (~) % Impact on CAGR Forecast | Geographic Relevance | Impact Timeline |
|---|---|---|---|
| Rising demand for natural and chemical-free personal care products | +1.2% | Global, strongest in North America and Europe | Medium term (2-4 years) |
| Increasing emphasis on eco-friendly and sustainable products | +0.8% | Global, led by Asia-Pacific emerging markets | Long term (≥ 4 years) |
| Growing demand for premium and homemade artisanal soaps | +1.1% | Core in North America and Europe; urban Asia-Pacific | Short term (≤ 2 years) |
| Increasing preference for organic soaps among sensitive-skin consumers | +0.9% | Global, with medical endorsement in developed markets | Medium term (2-4 years) |
| Aggressive marketing and advertisement campaigns | +0.7% | North America and Europe; social-media driven in Asia-Pacific | Short term (≤ 2 years) |
| Innovation in exotic ingredients and multifunctional formulations | +0.6% | Premium segments worldwide; research and developments hubs in North America | Long term (≥ 4 years |
| Source: Mordor Intelligence | |||
Rising Demand for Natural and Chemical-Free Personal Care Products
As consumers increasingly prioritize ingredient transparency and safety, the demand for natural and chemical-free bar soaps is surging, propelling market expansion. A 2024 survey by the National Sanitation Foundation (NSF) reveals that 74% of Americans prefer organic ingredients in personal care, and 65% actively seek transparent ingredient lists to sidestep harmful components [1]Source: NSF International, “Global Consumer Insights on Organic Personal Care,” nsf.org. . In response, brands are emphasizing authenticity and eco-conscious values. For instance, in 2024, The Little Soap Company introduced its Eco Warrior Baby & Child Edit bars, tailored for sensitive skin, garnering praise from parents prioritizing allergen-free and sustainable choices. Likewise, brands like Ethique, Meow Meow Tweet, and Alaffia have cultivated dedicated followings by championing plant oils, shea butter, and zero-waste packaging, resonating with health-conscious and eco-minded consumers. This trend underscores a broader lifestyle evolution, where natural soaps symbolize holistic wellness and environmental responsibility. Such alignment of values with purchasing decisions fuels the momentum for organic bar soaps, cementing their role as pivotal players in the broader personal care market's evolution.
Increasing Emphasis on Eco-Friendly and Sustainable Products
As consumers increasingly prioritize eco-friendliness, the demand for sustainable bar soaps is surging. In 2024, Goop teamed up with evolvetogether to launch a low-to-zero waste soap bar. This soap not only adheres to Goop's clean-certified standards but is also wrapped in eco-friendly paper derived from wood pulp. The soap's formula features fine coconut shell powder for a gentle cleanse, shea and murumuru butters, and olive oil for hydration, and licorice root to bolster the skin barrier, catering to consumers who value both sustainability and skin health. ITC's Savlon has also entered the fray, unveiling glycerin bar soaps encased in recycled plastic, making sustainable choices more mainstream. Meanwhile, niche brands are pushing the envelope with biodegradable wrappers and innovative plantable seed-paper packaging, resonating with consumers who see packaging as a reflection of product integrity. These trends underscore how consumers are increasingly favoring brands that seamlessly blend sustainable packaging with natural ingredients, driving the bar soap segment from a niche market to a mainstream powerhouse. The growing emphasis on eco-consciousness is also encouraging brands to innovate further, ensuring they stay competitive in this evolving market.
Growing Demand for Premium and Homemade Artisanal Soaps
As consumers increasingly prioritize quality, authenticity, and sensory experiences, they're turning to premium and homemade artisanal bar soaps, fueling market growth. In response, brands are crafting innovative, small-batch formulations that blend unique ingredients with sustainable practices. OffCourt, for example, offers gentle exfoliating vegan bars such as Coconut Water + Sandalwood and Fresh Citron + Driftwood. Green-Beauty Co. showcases Ayurvedic soaps infused with Neem, Turmeric, and Charcoal. EcoRoots offers a diverse range of scents, from Lemongrass and Patchouli to Tangerine Lavender and Spearmint Sage. Meanwhile, Smoosh tempts with fragrances like Amber Santal, Seasalt Orchid, Citrus Ocean, and Cedarwood Bergamot. These curated offerings resonate with consumers who value craftsmanship, luxury, and ethical production, resulting in increased engagement, repeat purchases, and social sharing. Bolstering this trend, the V‑Label, a globally recognized seal for vegan and vegetarian products, highlighted that about 85% of consumers regularly opt for cruelty-free and vegan personal care products, with 86% eager to increase their purchases of such items [2]Source: V-Label, "Key consumer insights on vegan cosmetics, "v-label.com. This strong consumer preference demonstrates how the premium and artisanal segment has evolved from a niche category to a significant driver of growth in the ethical and specialty bar soap market.
Increasing Preference for Organic Soaps Among Sensitive Skin Consumers
The increasing prevalence of skin sensitivity among consumers is shaping market trends, as highlighted in Aveeno’s 2024 State of Skin Sensitivity report, which reveals that 71% of global consumers report experiencing this issue [3]Source: Kenvue Inc., “Aveeno State of Skin Sensitivity 2024,” aveeno.com. This has led to a rising demand for organic bar soaps, especially those emphasizing gentle, hypoallergenic, and natural ingredients. In response, brands are rolling out innovative, small-batch products tailored to cleanse, nourish, and safeguard sensitive skin. For instance, A Wright Creations debuted a natural soap line in 2025, spotlighting items like the Double Honey Turmeric Facial Soap and Sea Moss Eczema Relief Soap, both crafted for delicate skin. In a similar vein, iHeart Nature launched their Honey Oat & Shea Bar Soap, a blend of shea butter, honey, and oats, designed to hydrate and bolster the skin’s natural barrier. Such offerings resonate with consumers prioritizing both safety and effectiveness, leading to increased repeat purchases, heightened brand loyalty, and organic word-of-mouth endorsements. The pronounced alignment of these organic, gentle formulations with the preferences of sensitive-skin consumers who dominate the market has not only propelled the growth of the organic soap segment but also positioned it as a pivotal driver of the broader market's expansion.
Restraints Impact Analysis of Organic Soap Market*
| Restraint | (~) % Impact on CAGR Forecast | Geographic Relevance | Impact Timeline |
|---|---|---|---|
| Dominance of conventional soaps | –0.9% | Global, strongest in price-sensitive emerging markets | Long term (≥ 4 years) |
| Stringent organic certification regulations | –0.7% | North America and Europe regulatory frameworks | Medium term (2-4 years) |
| Premium pricing of organic soaps | –0.8% | Emerging markets with lower disposable incomes | Short term (≤ 2 years) |
| Raw-material price volatility and supply constraints | –0.6% | Global supply chains, concentrated in key producing regions | Medium term (2-4 years) |
| Source: Mordor Intelligence | |||
Dominance of Conventional Soaps
The widespread preference for conventional soaps poses a significant challenge to the growth of the organic soap market. Conventional soap brands like Lux, Dove, and Lifebuoy leverage aggressive pricing, widespread distribution, and relentless innovation to maintain their edge. For example, Lux's new Stratos technology cuts palm oil content by 25%, boosting both skin protection and fragrance delivery. Meanwhile, Dove's Garden Tea Party Collection introduces fresh fragrances and formulations, broadening its appeal. Lifebuoy continues to focus on health and hygiene benefits, further solidifying its position in the market. Such innovations not only deepen consumer loyalty but also elevate product performance and value standards, making it tough for organic brands to match in price and functionality. Furthermore, the strong brand recall and emotional ties consumers have with these conventional soaps bolster their market stance, leaving scant room for organic alternatives. Consequently, organic soap brands struggle to carve out a significant market share, as many consumers stick with established names they view as reliable, convenient, and affordable.
Premium Pricing of Organic Soaps
Organic soaps, often priced at a premium, face challenges in achieving widespread market growth. Typically, handmade soaps range from USD 5 to USD 15 per bar, a pricing influenced by their high-quality ingredients, artisanal crafting, and eco-friendly packaging. For example, Sweet Harvest Farms markets a sample soap pack at USD 14, boasting organic shea butter, coconut oil, and sustainable palm oil. Such elevated price tags render organic soaps less attainable for budget-conscious consumers, especially in emerging markets. Consequently, many shoppers gravitate towards more affordable options from established brands like Lux, Dove, and Lifebuoy, which offer similar cleansing benefits at a fraction of the cost. This pricing gap limits the broader appeal of organic soaps, relegating them to a niche market of health-conscious or affluent buyers. Furthermore, the belief that a higher price doesn't necessarily equate to better results deters potential first-time purchasers, hindering the market's overall growth and penetration. To overcome these challenges, manufacturers may need to explore cost-effective production methods or introduce smaller, more affordable product sizes to attract a broader consumer base.
*Our forecasts treat driver/restraint impacts as directional, not additive. The impact forecasts reflect baseline growth, mix effects, and variable interactions.
Organic Soap Market Segment Analysis
By Product Form:
Bar Soap Dominance Faces Innovation PressureIn 2025, bar soap is set to dominate the global organic soap market, capturing a substantial 95.29% share. This stronghold can be attributed to consumer familiarity, cost-effectiveness, and user-friendliness. Bar soap's supremacy is further bolstered by its manufacturing efficiency, extended shelf life, and straightforward packaging. These attributes resonate with both producers and consumers who are on the lookout for uncomplicated organic choices. Brands such as Alaffia, with their Lavender and Coconut-scented Good Soap Bar Multipack, and Green-Beauty Co., presenting Neem, Turmeric, and Charcoal bars, underscore the allure of bar soaps. Their gentle, natural formulations strike a balance between effectiveness and convenience, appealing to a diverse consumer demographic. This widespread preference across various demographics solidifies bar soap's foundational role in the organic soap market.
Paper soaps and strips are emerging as the fastest-growing segment, boasting a CAGR of 5.94% projected through 2031. Their rise is fueled by the convenience they offer to travelers, heightened hygiene concerns, and evolving lifestyles in the wake of the pandemic. Brands are pushing boundaries, introducing biodegradable paper substrates and concentrated formulations. These innovations ensure cleansing effectiveness while being mindful of the environment. A case in point is Bon Organics, which provides a 30-sheet pack of handmade paper leaflets, each coated with organic soap, catering to the on-the-go hand hygiene need. Additionally, novel formats like strip-based or dissolvable sheets are gaining momentum. These innovations not only cater to the demand for compact, eco-friendly, and TSA-compliant solutions but also address significant consumer concerns like portion control and contamination in shared spaces. This trajectory of innovation not only fuels the overall market growth but also complements the established bar soap segment.


By Category:
Premium Segment Accelerates Amid Mass Market StabilityIn 2025, the mass segment dominates the global organic soap market, boasting a 62.10% share. Brands such as Dr. Bronner’s, Tom’s of Maine, Chagrin Valley, Crate 61 Organics, and Kirk’s Original lead the charge. These brands provide affordable, non-luxury organic soaps, targeting consumers who prioritize eco-friendliness and effectiveness without the luxury price tag. Their consistent quality and broad availability have cemented their appeal across diverse demographics. Additionally, the mass segment benefits from strong distribution networks, ensuring accessibility in both urban and rural markets.
On the other hand, the premium segment is on an upward trajectory, forecasting a CAGR of 8.28% through 2031. This surge aligns with a wider trend in consumer goods, where genuine brand stories and artisanal methods justify higher price points. Brands like Flamingo Estate are at the forefront, showcasing products like their botanical bar soap, a handcrafted blend of Big Sur sea salt, French blue clay, poppy seeds, and organic peppermint. The premium segment's expansion is fueled by consumers' growing inclination to splurge on luxury personal care, prioritizing quality, sustainability, and distinct formulations. Furthermore, the segment is leveraging digital platforms and exclusive retail partnerships to enhance visibility and attract niche audiences.
By End Users:
Kids Segment Emerges as Growth EngineIn 2025, adults account for a dominant 92.90% share of the market, driven by established usage patterns and a diverse product range tailored to various skin types and preferences. Catering to specific dermatological concerns and lifestyle needs, the adult segment offers a wide array of products, ranging from multiple formulations and fragrances to therapeutic applications. Brands such as Dr. Bronner’s, Tom’s of Maine, Chagrin Valley, Crate 61 Organics, and Kirk’s Original provide affordable, non-luxury organic and natural soaps. These brands resonate with consumers who prioritize effective, eco-friendly options without the premium price tag. Such offerings foster unwavering loyalty among mature consumers, who value efficacy, sustainability, and consistent performance in their personal care routines.
Meanwhile, the kids' segment is witnessing the fastest growth, surging at a CAGR of 9.10% through 2031. This growth is largely attributed to heightened parental concerns about chemical exposure and recommendations from pediatric dermatologists for individuals with sensitive skin. Safety is paramount in this segment, driving brands to innovate with tear-free formulations, hypoallergenic ingredients, and eye-catching packaging. For example, The Good Soap's fun-shaped natural soap bars, like Danny Dinosaur and Sparkle Unicorn, are crafted to make handwashing and bathing for kids while being gentle on their skin. Similarly, Rush Organics offers customizable soaps for kids, available in a variety of shapes, colors, and scents, ensuring a playful yet safe bathing experience. Bolstering this segment is regulatory backing, highlighted by the Consumer Product Safety Commission's updated guidelines that favor organic formulations over synthetic ones. Companies adept at navigating pediatric testing and securing endorsements can carve out a niche and cultivate loyalty in this burgeoning market.
By Distribution Channel:
E-commerce Disrupts Traditional Retail PatternsIn 2025, supermarkets and hypermarkets command a 34.66% market share, capitalizing on established consumer shopping habits and diverse product ranges that encourage the exploration and trial of organic soaps. These conventional outlets not only seize impulse buying moments but also showcase organic soaps alongside their conventional counterparts, making it easier for consumers to compare and switch brands. Notable brands in this space, such as Dr. Bronner’s, Tom’s of Maine, and Chagrin Valley Soap, cater to health-conscious shoppers with their diverse organic soap offerings.
Meanwhile, online retail stores are on track to achieve a 5.99% CAGR through 2031, underscoring a significant evolution in consumer shopping habits and the benefits of direct-to-consumer branding. This surge in e-commerce can be attributed to various factors, including the rise of subscription models, the melding of social commerce, and tailored product suggestions that enhance both customer acquisition and loyalty. Brands like A Wild Soap Bar, The Yellow Bird, and Aspen Kay Naturals have adeptly utilized online platforms, presenting their handcrafted organic soaps, boasting unique formulations and eco-conscious packaging, to a wider audience. Convenience stores, health and beauty outlets, and other channels continue to perform steadily, catering to specific regions and demographics where traditional retail ties are robust. This varied channel approach allows organic soap producers to fine-tune their distribution strategies, aligning them with customer preferences and regional market nuances.
Geography Analysis
APAC Organic Soap Market
In 2025, the Asia-Pacific region holds a dominant 38.32% share of the global organic soap market, driven by rising disposable incomes, a cultural preference for natural ingredients, and a rapid adoption of e-commerce. This region not only leads in market share but also showcases the fastest growth rate, boasting a 6.24% CAGR projected through 2031. India and Indonesia emerge as key players, supplying organic oils and botanical extracts, while China's robust digital commerce infrastructure accelerates brand expansion. Meanwhile, Japan and South Korea are propelling the premium segment, driven by discerning consumers who prioritize and are willing to invest in innovative formulations. Brands like Taiwan's Mumu Bath, India's Nyassa, and South Korea's Binu Binu epitomize this trend, crafting soaps that harmoniously fuse traditional Asian ingredients with contemporary design.
North America and Europe Organic Soap Market
North America and Europe, characterized as mature markets, witness steady growth bolstered by regulatory endorsements, such as the United States Department of Agriculture, organic certification, and EU organic standards. These regions not only champion innovation in sustainable packaging and ingredient transparency but also set global benchmarks, shaping product development worldwide. Noteworthy brands include the UK's Lush, celebrated for its handmade, cruelty-free ethos, and the U.S.-based Sodambi, which draws inspiration from traditional African recipes for its natural moisturizing bar soaps.
MEA and South America Organic Soap Market
Emerging markets in South America, the Middle East, and Africa showcase diverse growth patterns. Brazil spearheads South America's ascent, rooted in its rich tradition of natural products and a burgeoning urban consumer base. The UAE and Saudi Arabia in the Middle East are witnessing a surge driven by rising disposable incomes and heightened health consciousness among the youth. In Africa, brands like Togo's Alaffia and U.S.-based Shea Terra Organics (sourcing directly from Africa) are making waves. Alaffia champions fair-trade, handcrafted African black soap, while Shea Terra Organics stays true to authenticity, crafting its African black soap with time-honored ingredients, including cocoa pod ash and shea butter.

Regulatory Landscape
In the United States, cosmetics safety and labeling rules apply, but the FDA does not define organic or natural for cosmetics. Claims must still be supported under the FTC Green Guides in 16 CFR Part 260.
In the European Union, cosmetics marketed in the EU must comply with Regulation (EC) No 1223/2009, including preparing a Cosmetic Product Safety Report (CPSR) and notification via the Cosmetic Products Notification Portal (CPNP). Commission Regulation (EU) 2026/909, issued in April 2026, amended annex restrictions for multiple substances such as Benzyl Salicylate and DHHB. That change has led brands to re-check fragrance and preservative systems and update product information files. Certification programs such as COSMOS and NATRUE remain common anchors; COSMOS sets organic content rules (for example, 95 percent of physically processed agro-ingredients organic and at least 20 percent organic ingredients in the total formula), and NATRUE tightened recertification requirements from July 1, 2025.
Competitive Landscape
Global organic soap market is moderately fragmented and manufacturers are carving out their niches with marketing strategies that spotlight product authenticity, natural ingredients, and sustainability. Niche brands, like Flamingo Estate with its handmade botanical bar soaps and Alaffia emphasizing fair-trade sourcing, are drawing in health-conscious and eco-aware consumers through artisanal formulations and eco-friendly packaging. Meanwhile, industry giants like Unilever and Procter & Gamble are positioning their organic acquisitions, such as Wild, as premium alternatives to conventional products. They're leveraging brand storytelling and cross-channel promotions to bolster consumer trust and broaden their reach.
In the race for a competitive edge, technology adoption stands out. Both multinational corporations and smaller players are channeling investments into digital tools. Niche brands harness social commerce, influencer partnerships, and targeted online ads to scale swiftly and foster community ties. On the other hand, established players are turning to data analytics, AI-driven personalization, and e-commerce tweaks to boost customer acquisition and retention. Moreover, technologies ensuring supply chain transparency are becoming vital, enabling brands to showcase their sourcing, ingredient traceability, and environmental commitments to a more informed consumer base.
To solidify their market presence, companies are leaning into strategies like partnerships, mergers, and market expansions. Multinationals, for instance, are opting to acquire genuine organic brands over in-house product development, highlighted by Unilever’s USD 230 million acquisition of Wild. Clorox and Procter & Gamble are also enhancing their capabilities through focused investments and collaborations. Niche brands are not left behind; they're forging partnerships with ingredient suppliers, subscription services, and e-commerce platforms to boost distribution and visibility. Such strategic maneuvers allow these companies to maintain a premium stance while ensuring operational efficiency and adhering to diverse regulatory standards.
Organic Soap Industry Leaders
-
Dr. Bronner’s Magic Soaps
-
Weleda AG
-
Neal’s Yard Remedies Limited
-
Faith In Nature Limited
-
Laverana GmbH & Co. KG
- *Disclaimer: Major Players sorted in no particular order
Organic Soap Market Companies Covered in this Report
- Dr. Bronner's Magic Soaps (Dr. Bronner's)
- Colgate-Palmolive Company (Tom's of Maine)
- The Clorox Company (Burt's Bees)
- Weleda AG
- Neal's Yard Remedies Limited
- Unilever PLC (Dr. Squatch
- SheaMoisture
- Nubian Heritage)
- L'Occitane International SA (L'Occitane en Provence)
- Pre de Provence SAS (Pre de Provence)
- Faith In Nature Limited (Faith In Nature)
- Laverana GmbH & Co. KG (lavera)
- The Hain Celestial Group Inc. (Jason)
- W.S. Badger Company Inc. (Badger)
- Sukin Naturals Pty Ltd (Sukin)
- Kneipp GmbH (Kneipp)
- S. C. Johnson & Son Inc. (Mrs. Meyer's)
- Lush Limited (Lush)
- The Body Shop International Limited (The Body Shop)
- Windmill Health Products LLC (Kiss My Face)
- L'Oreal S.A. (CeraVe)
- Herbivore Botanicals LLC

Market Opportunities and Future Outlook
Ongoing regulatory and standards updates are creating room for brands that pair clean positioning with verifiable compliance and documentation. In the EU, Regulation (EU) 2026/405 on detergents and surfactants (February 2026) raises biodegradability, labeling, and digital information requirements, while cosmetics rules continue under Regulation (EC) No 1223/2009 and its amendments, including Commission Regulation (EU) 2026/909. This environment favors manufacturers that can support traceable ingredient sourcing, safety substantiation, and digitally accessible product information across online retail and cross-border marketplaces.
Recent Industry Developments in Organic Soap Market
- May 2026: A limited-edition Cherry Blossom Pride Soap was released by Dr. Bronner's for the US market in June and July 2026. The release links a core product format to cause-led storytelling and seasonal merchandising, improving brand visibility in a crowded natural bar-soap aisle.
- March 2026: Weleda AG received B Corp certification and placed the pursuit of the common good and ecological well-being in company bylaws. The certification improves third-party credibility for sustainability and governance claims, which increasingly affect retailer acceptance and consumer trust in natural and organic personal care.
- November 2024: Forest Essentials opened its first U.S. flagship store in New York City, introducing Ayurvedic premium organic soaps to a broader luxury-wellness audience. The addition of brand-controlled retail provides another route to educate consumers on ingredient narratives and support premium category penetration.


Organic Soap Market Report Scope and Research Methodology
Market Definition and Coverage
This market covers retail and institutional sales of soap products that are positioned as organic, meaning the formulation uses organic inputs and is marketed on that basis, across bars and newer formats, and sold through offline and online channels.
Scope exclusions: We exclude conventional soaps that are only natural, herbal, or chemical free without an organic positioning, and we also exclude adjacent personal care items like body wash gels and hand sanitizers.
Segments Covered in This Report
-
By Product Form
- Bar Soap
- Paper Soaps and Strips
-
Category
- Mass
- Premium
-
End Users
- Adults
- Kids
-
By Distribution Channel
- Supermarkets/Hypermarkets
- Convinence Stores/ Grocery Stores
- Health and Beauty Stores
- Online Retail Stores
- Other Channels
-
By Geography
-
North America
- United States
- Canada
- Mexico
- Rest of North America
-
Europe
- Germany
- United Kingdom
- Italy
- France
- Spain
- Netherlands
- Poland
- Belgium
- Sweden
- Rest of Europe
-
Asia-Pacific
- China
- India
- Japan
- Australia
- Indonesia
- South Korea
- Thailand
- Singapore
- Rest of Asia-Pacific
-
South America
- Brazil
- Argentina
- Colombia
- Chile
- Peru
- Rest of South America
-
Middle East and Africa
- South Africa
- Saudi Arabia
- United Arab Emirates
- Nigeria
- Egypt
- Morocco
- Turkey
- Rest of Middle East and Africa
-
North America
Data Sources, Market Sizing, and Validation
Desk Research
Desk work starts with building the demand and supply story for organic soaps and then placing it inside the wider hygiene and personal care environment. We referenced public sources such as USDA organic program materials, the European Commission organic regulation pages, and certification body guidance like COSMOS and ECOCERT to align on what is usually sold as organic soap.
To ground volumes and trade movement, we also reviewed customs and national trade statistics (such as UN Comtrade and selected national statistics offices), along with trade association and retail channel publications that discuss soap consumption and category shifts. Company annual reports, investor presentations, and reputable press help us map brand activity, channel expansion, and pricing direction. We additionally used paid subscriptions for company financials and intelligence, patent databases, and shipment-level import and export checks, mainly to cross-verify revenue pools and product innovation signals. These desk sources are illustrative only, and many other references were used to collect, validate, and clarify the data points.
Primary Interviews and Surveys
Primary work is used to pressure-test assumptions that cannot be read clearly from public material, especially organic-claim adoption, channel mix, and price premiums by format. We spoke with manufacturers, ingredient and packaging participants, distributors and retailers, and also industry experts across APAC, EMEA, and the Americas, so the model reflects regional differences in certification expectations and buying behavior.
Distribution of primary research fieldwork respondents
| Company type | Respondent position | Region |
|---|---|---|
| Top tier: 36% | CXOs: 14% | APAC: 48% |
| Mid tier: 50% | Functional/Unit leaders: 32% | EMEA: 30% |
| Smaller Players: 14% | Managers: 54% | Americas: 22% |
Market-Sizing & Forecasting
The main model uses a top-down approach where the overall soap and personal cleansing demand pool is reconstructed using country level consumption signals, trade flows, and category growth indicators, and then filtered to the organic share based on adoption and availability. To keep results stable, we check them with selective bottom-up approximations such as sampled brand revenue pools, channel checks for online and health and beauty stores, and a simple ASP times volume sanity check for bars and paper or strip formats.
Inputs that are tracked include organic certification penetration in relevant geographies, format mix shifts (bar versus paper or strips), distribution channel share changes, price premium movement versus conventional soap, and consumer preference indicators tied to clean label buying. For the forecast, scenario analysis is used, because policy and certification interpretation, input cost swings, and retailer listing behavior can change the slope quickly. When interview feedback shows gaps in reported volumes for small brands, we apply conservative uplift factors based on channel presence and observed shelf or online assortment breadth, then re-check the totals against trade and category growth signals.
Data Validation & Update Cycle
Outputs are validated through multiple checks so the final totals match reality from different angles. We compare results against independent signals like trade movement, price ranges observed in key channels, and company level revenue disclosures where available, and then we investigate large variances before the numbers are finalized. A second analyst review is completed to ensure assumptions are consistent across regions and that the math logic is repeatable.
The report is refreshed annually, and interim updates are triggered when there are material events such as large regulatory changes in organic labeling, major channel policy shifts, or sharp raw material price moves that can affect organic soap pricing. Before delivery, a final pass is performed so clients receive an updated view that reflects the latest public data and fresh expert feedback.
Mordor Intelligence's Organic Soap Market Size Compared Against Other Published Estimates
Published market sizes for organic soap do not always match because each publisher draws the line differently on what is counted, which year is treated as the anchor, and how pricing is converted into USD. Differences also come from how much of the market is assumed to be premium priced, and whether niche formats are included as full soap demand.
Some sources focus more narrowly on bar and liquid formats and may apply a lower organic share to the broader soap category, which usually compresses the total. Others use longer forecast windows with stronger growth assumptions and do not always explain how certification-leaning products are separated from general natural soaps, and then currency timing and retail price premium assumptions add another layer of spread. In the Mordor Intelligence build, the total is expanded by including paper soaps and strips, but it is tightened by counting only products positioned as organic and excluding adjacent cleansing categories that can inflate soap totals.
Benchmark comparison
| Source | Market Size | Gaps in Research Methodology |
|---|---|---|
| Mordor Intelligence | USD 7.57 B (2026) | |
| Global Consultancy A | USD 2.69 B (2026) | Typically centers the definition on core bar and liquid soaps and applies a conservative organic penetration rate, which can leave out newer soap formats and reduce the addressed demand pool. |
| Industry Publisher B | USD 2.50 B (2024) | Uses an earlier base year with different pricing and conversion timing, and the scope notes are lighter on how organic-claim products are separated from wider natural soaps, which can shift both volume and ASP assumptions. |
Across the three figures, the spread is mainly explained by scope choices, base year selection, and how the organic share and price premium are applied. When the variables are stated clearly and checked against trade and channel signals, the outcome is easier to reproduce and easier to pressure-test during planning discussions.


Key Questions Answered in the Report
How large is the organic soap market in 2026?
The organic soap market size is valued at USD 7.57 billion in 2026.
What is the forecast CAGR for organic soap through 2031?
The sector is set to expand at a 5.86% CAGR between 2026 and 2031.
Which region leads both value and growth in organic soap?
Asia-Pacific holds 38.32% share and posts the highest 6.24% CAGR through 2031.
Which is the fastest growing region in Organic Soap Market?
Asia-Pacific is estimated to grow at the highest CAGR over the forecast period (2026-2031).
Page last updated on:


 Your data is secure and never sold or shared.


